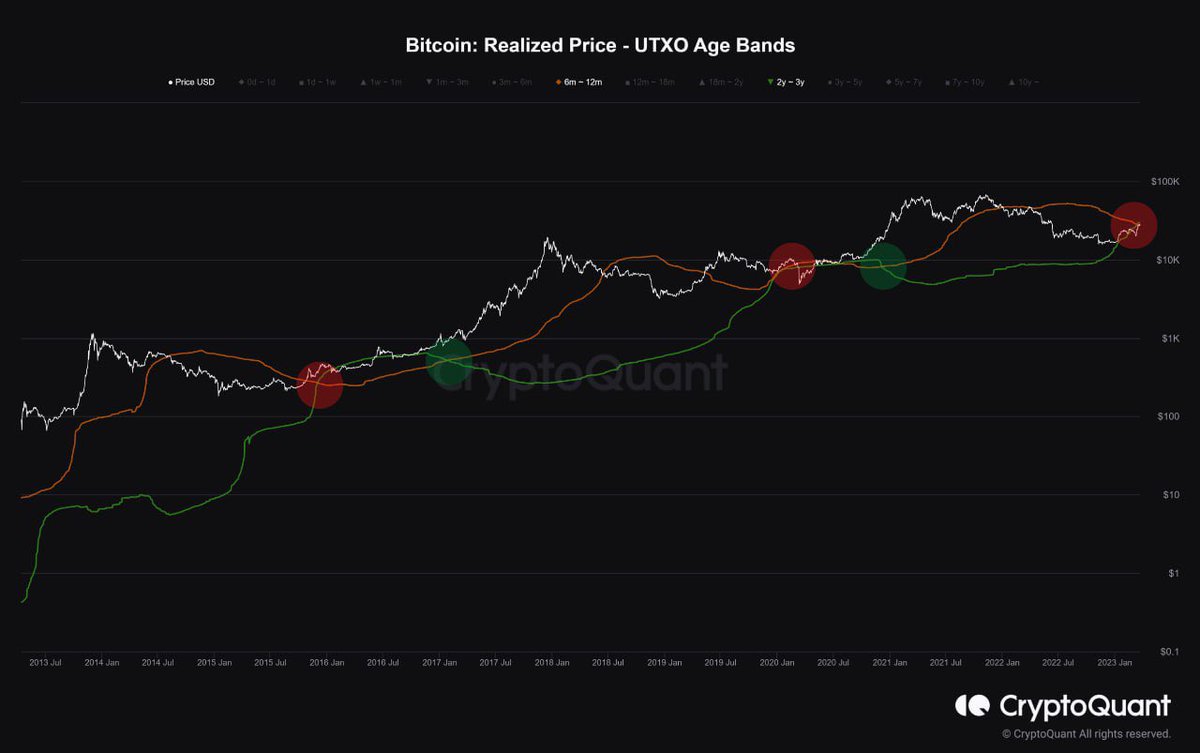
The BEAM ("#Bitcoin Economics Adaptive Multiple") indicator gives you a great high level overview when to buy (🟩 zone) and sell (🟥 zone). Notice 👀 the bullruns 🚀 after the $BTC halvings... Check the #BTC#tradingview#indicator here: https://t.co/YgWTTFgICS
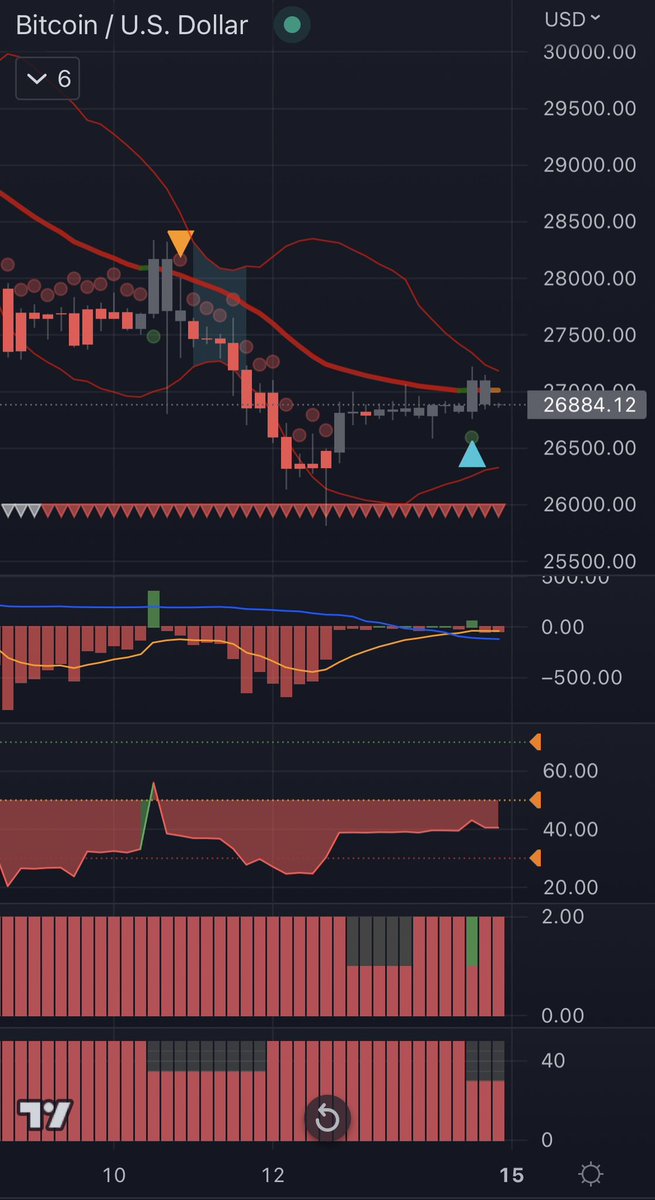
#bitcoin still in a sea of red 🔴, but that blue arrow could be very interesting… 🕵🏻 Let’s wait and see what next week will bring… 👀 #BTC $BTC #crypto#trading#tradingview Copy our strategy here: https://t.co/BBY3OhrQ4n
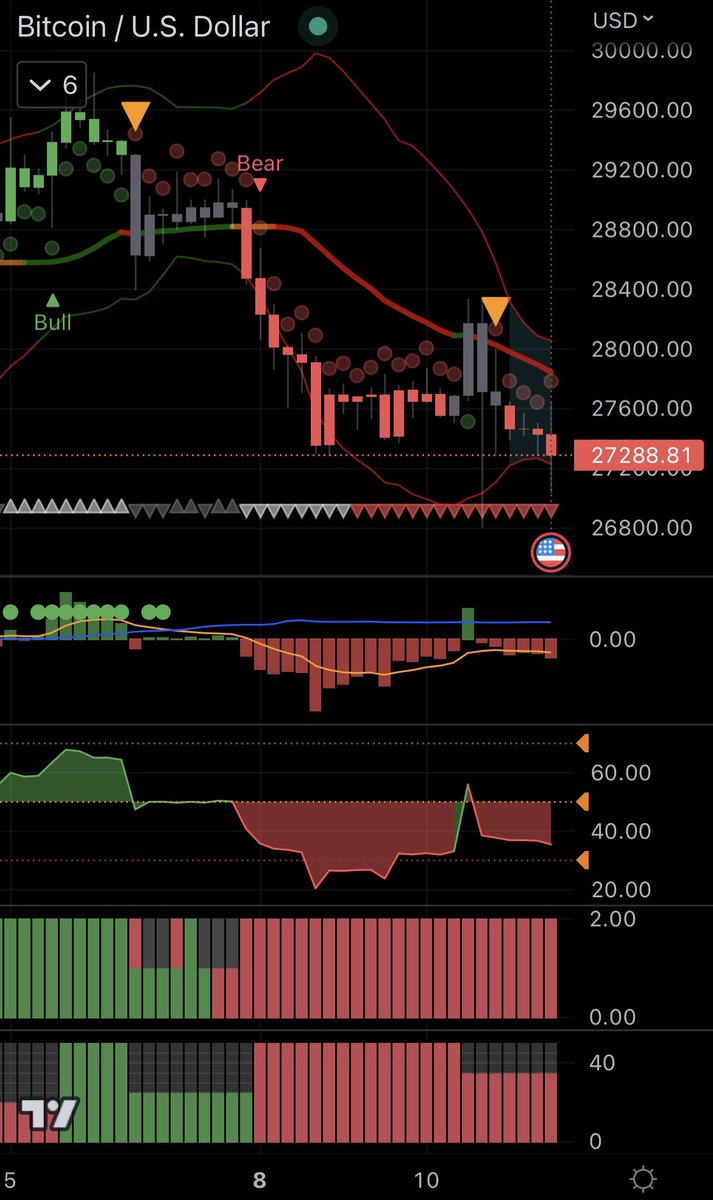
Let’s see if #BTC will go another leg down… 🔻 We also added a new complex custom developed indicator to our #Tradingview setup… 🥳 However we stick to our motto, to keep the visuals simple with an easy to read colouring code: 🟢⚫️🔴… The first results are satisfying… 👍🏻
#Bitcoin 300.000 $ next cycle? 👀🚀
In the past cycles $BTC reached at least the x15 Top cap…
- Top cap x 15 = 2,4 $ Trillion  (114k $ per #BTC)
- Top cap x 35 = 5,7 $ Trillion  (319k $ per #BTC)
An Inverted Head and Shoulders pattern on the weekly chart of #Bitcoin, indicating a potential bullish reversal. The pattern suggests a target price of 38-39K zone, with a condition that the pattern would be invalidated if the price falls below the right shoulder. #BTC $BTC
After #Bitcoin reached its highest price since June 2022 and exceeded the $28K level, it is expected that the price range of 29K-30K to form an extreme resistance, and for the price to correct from this range several times before succeeding in breaking through it. #BTC $BTC
Just to keep things in perspective, let’s zoom out… 👀 The Power LAW model projects the following $BTC milestones: $100,000 by 2025 -> $1 million by 2033 -> $10 million by 2044... #BTC#crypto#smartmoney