Sharing this oscillator publicly for the first time.
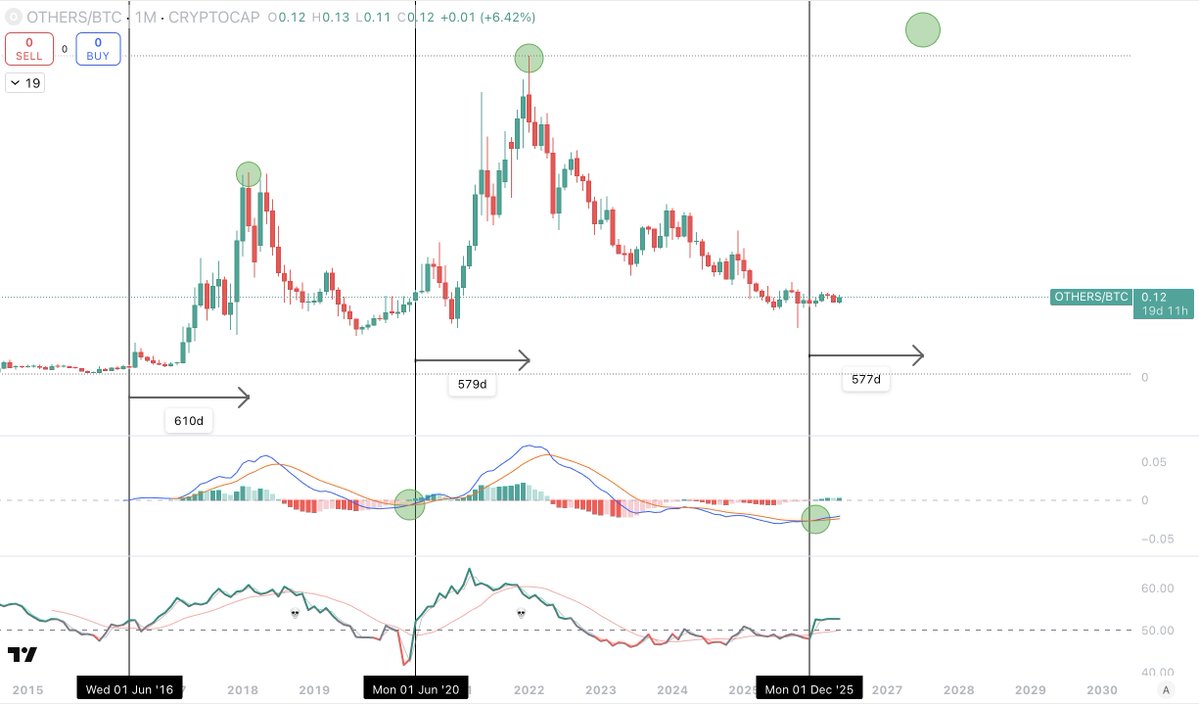
The chart shows Bitcoin’s price action over the past 10 years, with the following annotations:
- Green lines and circles: Historical bottoms as identified by the oscillator
- Red lines and circles: Breakdown zones
- White circles: Key support levels
Currently, the oscillator is registering readings that align with those observed at previous major lows.
This is shared strictly for educational and technical discussion purposes.
#Bitcoin #BTC $BTC #Crypto
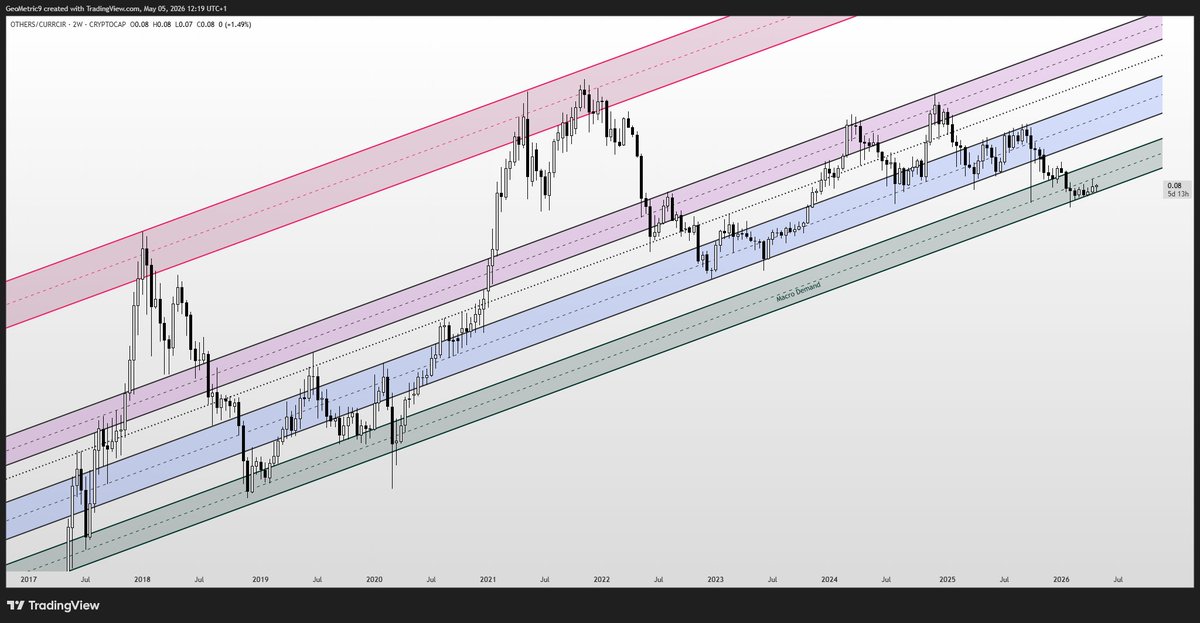
Based on #Bitcoin dominance, we could enter 12-18 months of alts strength until the dominance goes back down to 43% currently sitting at 60%
The ribbon is now red
Just thought you’d want to know
#Bitcoin Historical Buy Zone
#BTC is currently in what has historically been the optimal accumulation window.
Accumulation is boring.
But that’s where asymmetric opportunity is built.
Altcoins are at the start of a 600 day period of outperformance against Bitcoin.
Most won't believe this, but it is exactly what the overall data shows us.
And i have put together a 10 minute read within my newest newsletter edition, going over this data and the wider market.
It is not just guesswork, this is hard analysis with all the details that matter.
You can read it for free by signing up for a free trial and using the link in the post below.
There is no doubt altcoins have been very weak so far this cycle.
But with my overall thesis here fully intact, we are now entering the second phase of this lengthened cycle, due to the longer business cycle...
And entering the biggest and most explosive part of that cycle.
With most totally unprepared for it.
Hard to argue there were no signs of a bottom when I've presented over 50 charts making the case for a bottom, many of which are in this post from a month ago. I came at it from different angles, not one chart with one fractal. No one stopped by to refute any of the charts, just angrily impose their own bias. This article and my posts got very little engagement. My follower count has completely come to a stand still. Doesn't matter though, we do this for the love of it.
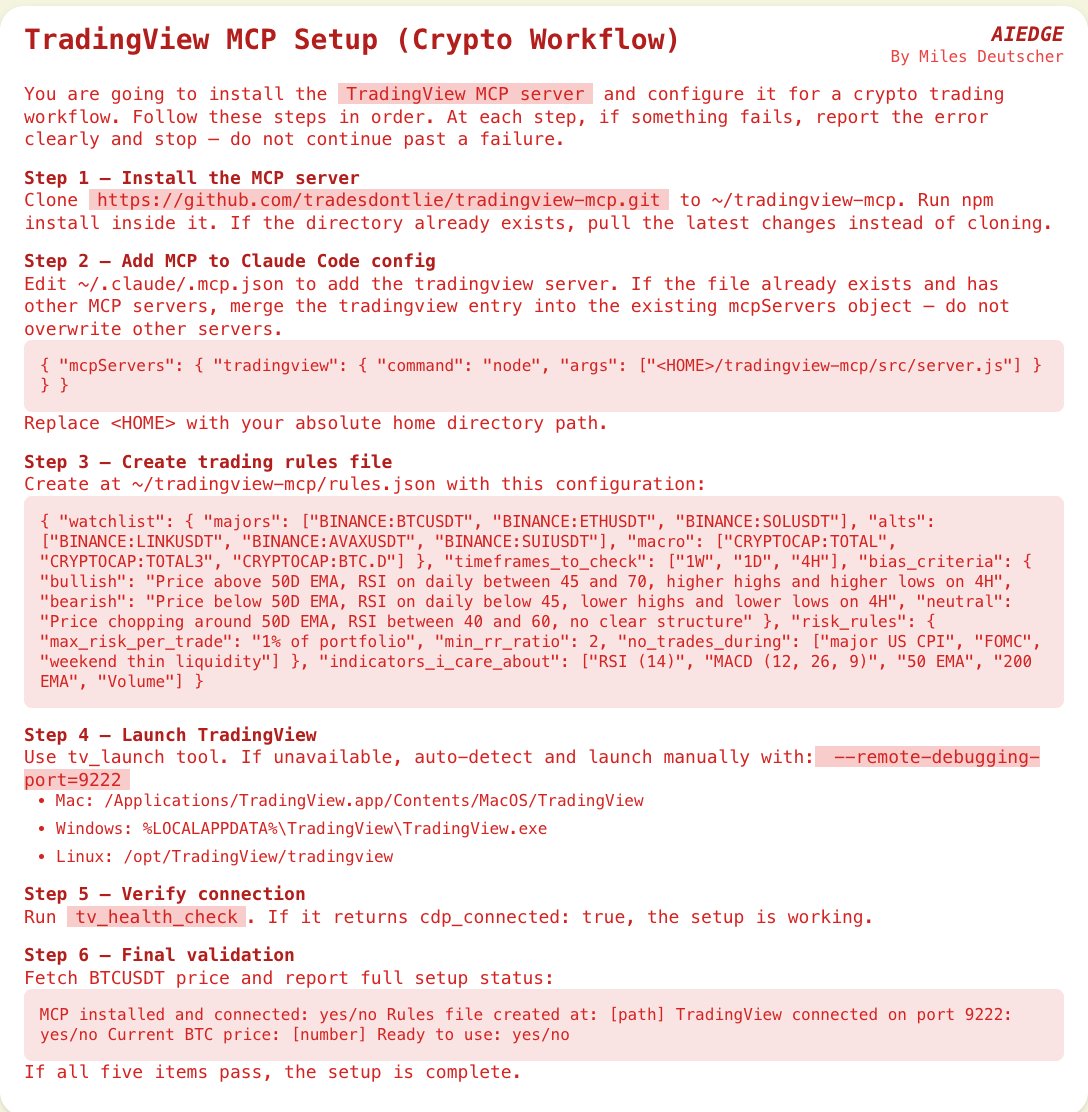
Claude Code x TradingView is the best AI trading quant of all time.
Gone are the days of AI slop market analysis - AI is now better at technical analysis than you.
Here's how you can turn Claude Code into your expert trading quant (in <5 minutes):
Step 1. Ensure you have these requirements:
• Claude Code - installed on your computer (this is what talks to TradingView)
• Node.js 18+ - installed on your computer (the MCP server runs on this)
• TradingView Desktop app - downloaded from https://t.co/1YkJpaCU8L
• A valid TradingView subscription (paid plan for real-time data)
Step 2. Open Claude Code and run the following prompt to connect the TradingView MCP:
"Install the TradingView MCP server. Clone and explore https://t.co/k1Ql1o0CYi, run npm install, add to my MCP config at ~/.claude/.mcp.json, and launch TradingView with the debug port."
Step 3. Health check
Restart Claude Code, and paste this prompt:
"Use tv_health_check to confirm TradingView is connected."
If correctly connected, Claude Code should respond with a confirmation.
Step 4. Start prompting
Claude Code now has access to your ENTIRE TradingView environment
Your charts, your technical analysis, alerts - everything.
Use this prompt to turn Claude Code into your personal market analyst:
"Act as an elite quantitative trader and technical analyst with full access to my TradingView environment.
Analyze the current market structure for [ASSET] on the following timeframes: 5m, 15m, 1H, 4H, 1D.
Use my existing indicators, drawings, and chart context to:
Identify the current trend and market regime (trending, ranging, accumulation, distribution)
Mark key support and resistance levels based on price action and liquidity
Identify liquidity pools, stop clusters, and likely areas of manipulation
Analyze momentum using RSI, MACD, and volume where available
Detect any chart patterns (breakouts, consolidations, deviations, etc.)
Evaluate confluence across timeframes
Then provide:
A clear directional bias (bullish, bearish, neutral)
The highest probability trade setup right now
Exact entry, stop loss, and take profit levels
Risk-to-reward ratio
Invalidation point (what would prove this analysis wrong)
Finally:
Explain your reasoning step-by-step in plain English.
Avoid generic statements. Be decisive.
If no high-quality setup exists, explicitly say “no trade” and explain why."
This is an EXTREMELY powerful setup - make sure to save this post so you don't forget it.
I'M SORRY BUT NOBODY IS TALKING ABOUT WHAT BITCOIN JUST DID.
Multi-year Cup and Handle. Complete.
Breakout. DONE.
Perfect retest. DONE.
Structure confirmed. DONE.
This pattern took years to build.
And nobody noticed.
Cup and Handle breakouts don't move 20%.
They move hundreds of percent.
The retest just finished.
The launch is next.
$220K is the minimum target.
Most people will only find out after it happens.
Because instead of naively swallowing the stupid false analogy that "eating an eye won’t fix eye disease" from people who clearly have no clue how nutrition actually works, smart folks now have access to dozens of peer-reviewed studies showing that hydrolyzed collagen peptides supplementation genuinely improve skin elasticity, hydration, firmness, and reduce wrinkles.
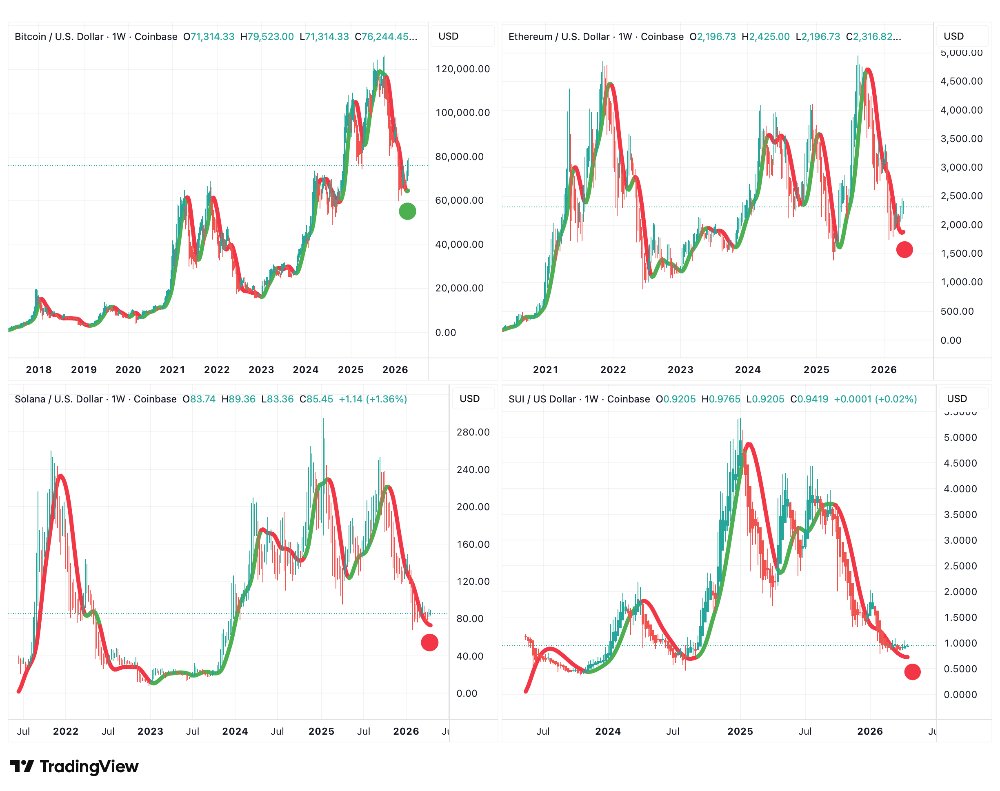
bitcoin:native just flipped green on the higher-timeframe Megatrend setup.
+30% off the February low. Crypto equities following. Alts not far behind.
If the cycle rhymes, this is where risk starts moving out the curve.
82% of the $TOTAL crypto market cap are either in $BTC, $ETH or Stable coins. This allocation has been a historic 'ceiling'. The only monthly close above this level was in December 2020 which was the last candle leading into the biggest Altcoin run ever.
I've revisited this $BTC bull market trajectory concept and have more interesting findings.
To recap, by using the initial bottom formation candles as support and extended it right for each cycle, it interestingly seems to form the trajectory for that cycle. If you think of capitulation as a break of this trajectory, interestingly, the distance from the start of the capitulation to the bottom has consistently been -43%.
This bear market, the current February low is once again -43% from the start of the capitulation.
I've used the PA since the February low to plot what could potentially be the trajectory for the next cycle.
I've then decided to check the trajectory angles for each past cycle including the current trajectory line for the next cycle. I then asked Grok to calculate the rate of decline of the trajectory angles for each previous cycle and forecast the next angle. Lo and behold, the number was a perfect match with the current angle projected.
Mind=blown🤯🤯🤯
From Grok:
“Quick reality check on Barbara O’Neill’s 7 rules
1Avoid oats/dairy/wheat/peanuts/sugar → Sugar: yes, limit it. The rest: mostly nonsense for healthy people — whole grains & dairy often reduce inflammation.
2No vaccines needed → Dangerous myth. Vaccines save lives; skipping them risks outbreaks.
3Bed before midnight (heals 2x faster) → Early sleep helps circadian rhythm, but the “twice as fast” is pure anecdote.
4Daily cold plunge → Some recovery/inflammation benefits possible, but “signals bone marrow” is exaggerated; not a miracle immune booster for everyone.
57 different fibers per meal → Solid advice — diverse plant fibers feed a healthy gut microbiome (where ~70% of immunity lives).
6Always nose breathe → Correct. Releases nitric oxide, calms the nervous system, better oxygen use.
7Never suppress fever → Partial truth (mild fever can help fight infection), but “never” is risky — high fevers need treatment, especially in kids/elderly.
Bottom line: A few decent lifestyle tips (fiber variety, nose breathing, limit junk, sleep well) mixed with risky pseudoscience and anti-vax rhetoric. “Body heals itself” sounds nice but doesn’t replace evidence-based medicine when you’re actually sick. Consult real doctors, not banned influencers. Stay critical!”
Whatever you do, do not let your parents transfer their house into your name.
Instead, do what the wealthy do.
If your parents are retiring and they tell you they want to sign the deed of the house over to you, maybe they bought the house for next to nothing back in the eighties and now it is worth $800,000, do not do it.
If they transfer it to you while they are alive, you will take their original tax basis. This means that when you eventually sell, you will have to pay capital gains tax on the entire increase in value since they bought it. The taxman does not care that it was a gift.
Here is what the wealthiest families do instead:
Step 1: Set up a revocable living trust and place the home inside it.
It keeps your parents in full control while they are alive, but sets up a smooth, private transfer later.
Step 2: Your parents should name you as the beneficiary of the trust. That way, when they pass away, the house automatically moves to you with no court involvement and no probate.
Step 3: When you inherit the house through the trust, you get a stepped-up basis. That means you only pay capital gains tax on any increase in value that occurs after they passed away, not on the huge appreciation since the 1980s.
That single move can save you over $120,000 in taxes.
That is how you pass inheritance to your children without losing a dollar to the system.
If you want to stop the government from taking a cut of your family’s hard-earned assets, follow these steps.
Claude Code x TradingView is extremely powerful.
If you haven't set it up yet, you'll want to save this.
Literally all you have to do is send this prompt to Claude Code, and it will set up the new TradingView MCP in <5 minutes.
Set it up now. You won't regret it:


![milesdeutscher's tweet photo. Claude Code x TradingView is the best AI trading quant of all time.
Gone are the days of AI slop market analysis - AI is now better at technical analysis than you.
Here's how you can turn Claude Code into your expert trading quant (in <5 minutes):
Step 1. Ensure you have these requirements:
• Claude Code - installed on your computer (this is what talks to TradingView)
• Node.js 18+ - installed on your computer (the MCP server runs on this)
• TradingView Desktop app - downloaded from https://t.co/1YkJpaCU8L
• A valid TradingView subscription (paid plan for real-time data)
Step 2. Open Claude Code and run the following prompt to connect the TradingView MCP:
"Install the TradingView MCP server. Clone and explore https://t.co/k1Ql1o0CYi, run npm install, add to my MCP config at ~/.claude/.mcp.json, and launch TradingView with the debug port."
Step 3. Health check
Restart Claude Code, and paste this prompt:
"Use tv_health_check to confirm TradingView is connected."
If correctly connected, Claude Code should respond with a confirmation.
Step 4. Start prompting
Claude Code now has access to your ENTIRE TradingView environment
Your charts, your technical analysis, alerts - everything.
Use this prompt to turn Claude Code into your personal market analyst:
"Act as an elite quantitative trader and technical analyst with full access to my TradingView environment.
Analyze the current market structure for [ASSET] on the following timeframes: 5m, 15m, 1H, 4H, 1D.
Use my existing indicators, drawings, and chart context to:
Identify the current trend and market regime (trending, ranging, accumulation, distribution)
Mark key support and resistance levels based on price action and liquidity
Identify liquidity pools, stop clusters, and likely areas of manipulation
Analyze momentum using RSI, MACD, and volume where available
Detect any chart patterns (breakouts, consolidations, deviations, etc.)
Evaluate confluence across timeframes
Then provide:
A clear directional bias (bullish, bearish, neutral)
The highest probability trade setup right now
Exact entry, stop loss, and take profit levels
Risk-to-reward ratio
Invalidation point (what would prove this analysis wrong)
Finally:
Explain your reasoning step-by-step in plain English.
Avoid generic statements. Be decisive.
If no high-quality setup exists, explicitly say “no trade” and explain why."
This is an EXTREMELY powerful setup - make sure to save this post so you don't forget it.](https://pbs.twimg.com/media/HHmjVwYa0AAubBu.jpg)