bitcoin:native Monthly Chart: Everything is moving faster than most expect.
$58.5K should act as the absolute short-term bottom if price reaches that level.
I’m still expecting a sweep toward the $48K region in the coming months. Meanwhile, liquidity continues to build between $66K and $70K, making a relief bounce increasingly likely.
Sooner or later, a bounce is coming.
#BTC
bitcoin:native is in free fall right now.
Guys, don’t try to catch this falling knife.
Better to stay away for some time instead of forcing longs in this market.
Right now, it doesn’t make much sense to look for longs unless BTC starts reclaiming important resistance zones again.
For now, patience is the best trade. Let the market settle first.
#Bitcoin
bitcoin:native broke the 74.8K support level, and now it looks like we could see a straight move towards the 67K zone.
If price slows down here, we may see some sideways movement or a relief retest back towards the 74K level before the next move.
For now, the overall structure still remains bearish as the Head & Shoulders breakdown continues to play out. 👀 #Bitcoin
🚨🇺🇦🇷🇺 insane video reportedly captures a Ukrainian F-16A running down and destroying a Russian Kh-101 cruise missile in midair, a kill credited to the Air Force's 107th Aviation Wing.
bitcoin:native Update: 3 weekly red closes in a row!
The chart is starting to look eerily familiar. If history rhymes once again, the market may still need more time before carving out a meaningful bottom.
If this structure continues to play out, a potential bottom around mid-October 2026 wouldn’t be surprising.
DYOR | NFA
#BTC
bitcoin:native Weekly: I don’t control where the market goes, but I do respect what the charts are saying.
Right now, BTC doesn’t look healthy on the weekly timeframe.
Weak structure, rejection from resistance, and price still struggling below key moving averages. If this continues, a move into the higher-timeframe FVG below wouldn’t surprise me at all. It won't be a sharp fall, though. Choppy PA is likely to continue.
The market often revisits inefficiencies before deciding its next major direction.
Of course, this view remains valid unless price proves otherwise.
Charts > emotions.
DYOR | NFA
#BTC
USDT.D Update
USDT.D has now broken above the descending trendline, which is a bullish sign for dominance. As long as it holds above the breakout and stays above the key support zone, I think there's room for further upside towards 8.18%.
If USDT.D continues higher, it could put more pressure on altcoins and lead to further downside across the crypto market.
#Crypto
bitcoin:native has done the breakdown of the neckline of the Head & Shoulders pattern as we expected and right now we see a strong straight drop from that area.
The price has already broken down from the key $74.8K neckline support, confirming the bearish structure. This level is now the key resistance to watch.
If BTC can hold around current levels, we may see a short term retest of the neckline again before the next move. But if the selling pressure persists and we continue to see straight down motion, then the next major support zone will be around the $70.8K area
For now the bears are in charge unless BTC gets back above the neckline.
#Bitcoin
#Ethereum bear flag breakdown done. Guys, be ready for this move, it’s coming.
ethereum:native has now lost the lower trendline support after weeks of consolidation, and price is starting to break down from the structure.
If this breakdown confirms on the daily timeframe, we could see a sharp move toward the lower levels, similar to the previous dump shown on the chart.
Bulls need to reclaim this support quickly, otherwise bears may stay in control for the next move down.
bittensor:native just broke below a key support zone and is now trading under the 200 MA, which keeps the overall structure bearish.
Current price action looks like a breakdown retest, and buyers still look weak here.
As long as the price stays below the broken support area, downside pressure remains strong.
Entry: 255 – 260
Stop: 265
Targets:
TP1: 240
TP2: 224
TP3: 200
A rejection from this zone could lead to another strong move down.
Break back above resistance = setup invalid.
#TAO
bitcoin:native Weekly: I don’t control where the market goes, but I do respect what the charts are saying.
Right now, BTC doesn’t look healthy on the weekly timeframe.
Weak structure, rejection from resistance, and price still struggling below key moving averages. If this continues, a move into the higher-timeframe FVG below wouldn’t surprise me at all. It won't be a sharp fall, though. Choppy PA is likely to continue.
The market often revisits inefficiencies before deciding its next major direction.
Of course, this view remains valid unless price proves otherwise.
Charts > emotions.
DYOR | NFA
#BTC
bitcoin:native has done the breakdown of the neckline of the Head & Shoulders pattern as we expected and right now we see a strong straight drop from that area.
The price has already broken down from the key $74.8K neckline support, confirming the bearish structure. This level is now the key resistance to watch.
If BTC can hold around current levels, we may see a short term retest of the neckline again before the next move. But if the selling pressure persists and we continue to see straight down motion, then the next major support zone will be around the $70.8K area
For now the bears are in charge unless BTC gets back above the neckline.
#Bitcoin
bitcoin:native is showing a clear Head & Shoulders pattern on the chart.
After forming multiple lower highs, price now is losing the key resistance area around the 0.382 Fibonacci level, and it’s moving back toward the important $74.8K support zone, which is also acting as the neckline of the pattern.
This is the key level to watch now.
If BTC gets a bounce from there, we could see another recovery attempt. But if the neckline breaks down cleanly, it may trigger a bigger drop toward the $72K zone.
#Bitcoin
While timelines were busy getting overly bullish, we spent the last few days posting shorts right around the local top.
There’s an old saying: “Show me the charts, and I’ll tell you the news.”
Then the Oman headlines hit.
To those who positioned early, well played.
To everyone else, patience. Chasing late moves is how liquidity hunts happen besides RR is not lucrative.
Sometimes the best trade is doing nothing and touching some grass.
bitcoin:native
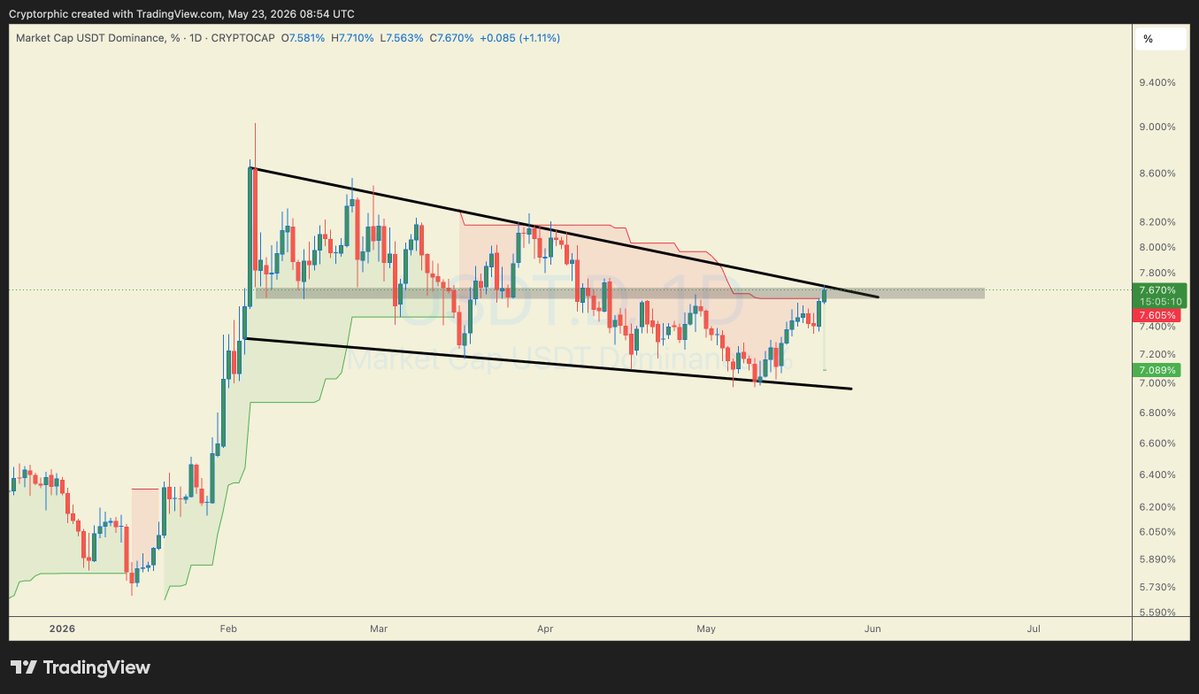
solana:Es9vMFrzaCERmJfrF4H2FYD4KCoNkY11McCe8BenwNYB Dominance is approaching a key breakout point from this falling wedge structure, which is generally considered a bullish pattern.
After holding the 7.0% support zone, dominance is now pressing directly into the upper trendline resistance around 7.7%.
If we get a strong daily candle close above this resistance, it would confirm the breakout and could trigger short-term weakness across altcoins as capital flows back into stablecoins.
Until then, this remains a major decision area, and the next move from this wedge could set the tone for the alt market direction.
#Alts #Crypto
ethereum:0x1f9840a85d5af5bf1d1762f925bdaddc4201f984 has already broken below the rising trendline support, and now price is struggling to reclaim that level.
At the same time, UNI is trading below the major moving averages, which keeps the short-term structure weak. RSI is also staying near the lower zone, showing weak momentum from buyers.
Right now, the $3.30–3.35 area is acting as resistance.
Unless UNI reclaims this zone and moves back above the broken trendline, the chart still looks bearish and we could see another move toward the lower support around $2.65.
For now, bears are still in control.
#UNI
ethereum:0xfaba6f8e4a5e8ab82f62fe7c39859fa577269be3 has already broken down from the symmetrical triangle structure and is now retesting the broken support as resistance.
As long as price stays below this trendline, bearish pressure remains active and we could see continuation toward lower support levels.
#ONDO