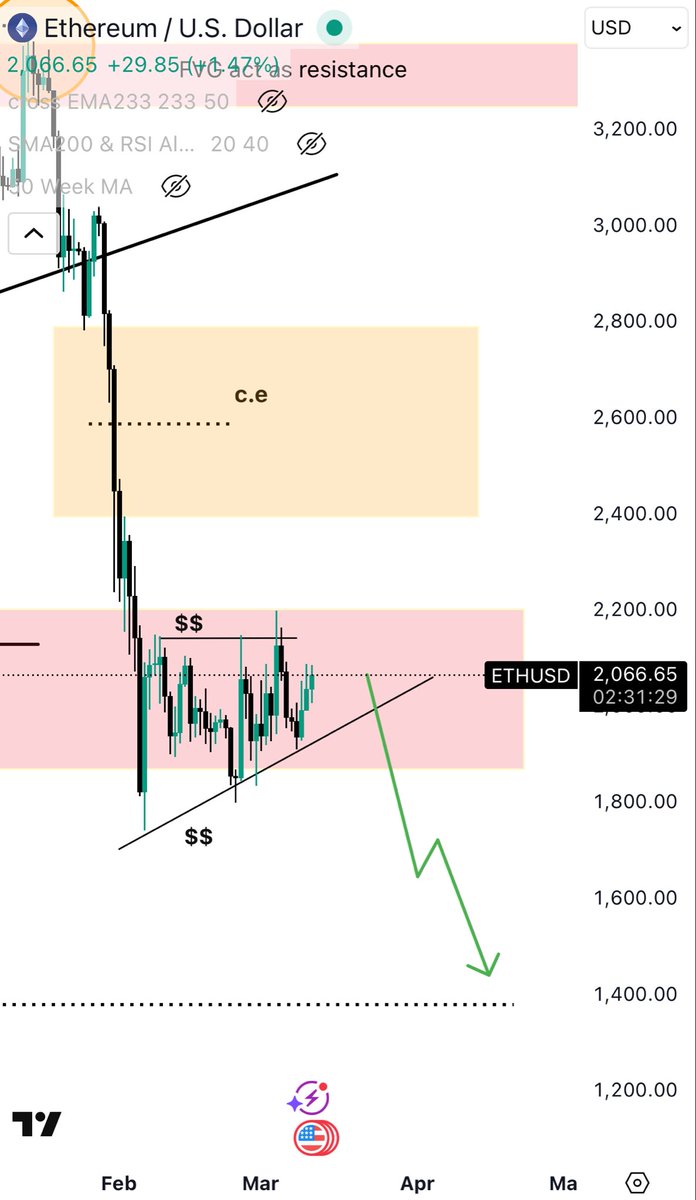
Ethereum got rejected twice from the same FVG zone, confirming it as strong resistance.
Now price is breaking below the rising trendline, which shifts momentum bearish.
➡️ Next key liquidity target sits at the daily FVG below (~$2.2k–$2.4k zone).
#eth#altcoins#cryptomarket
ethereum:native 0.05%
* Price tapping supply / zone (~2300–2400) after a clean relief rally
* Trendline still holding → allows short-term upside wicks
* But overall structure = bearish (lower highs HTF)
👉 Scenario: small push/liquidity sweep above 2400 → rejection
Targets:
* First: 2000–2100 imbalance
* Then: major sweep toward 1400
This is distribution at resistance, not strengt
$RAVE Parabolic move = unsustainable pump (pure hype / low liquidity).
No structure, no base → just vertical expansion = distribution coming.
After moves like this, price typically:
1.Pumps a bit higher (trap FOMO)
2.Then full retrace to origin
👉 Expectation: sharp reversal → back to base (near 0–2 zone).
US Jobs Beat. $BTC Didn’t Move. What Does That Tell Us?
The US economy added 178,000 jobs in March — comfortably above the 130,000 consensus forecast. Under normal conditions a labour beat is risk-on. Bitcoin barely flinched, continuing to trade near $67,000. The non-reaction tells a clear story: macro catalysts are not moving crypto right now. Geopolitical risk from the US-Iran conflict is the dominant variable, and no jobs number changes that. Iran asymmetric forces struck infrastructure in Kuwait at dawn today, keeping oil elevated and risk sentiment cautious. Good Friday means traditional markets are closed, liquidity is thin, and any large order can swing prices sharply in either direction.
💡 Takeaway: Thin Good Friday liquidity + elevated Iran risk = avoid high leverage today. $BTC holding $66K-$68K is consolidation, not a breakout. The real catalyst test comes next week when full market liquidity returns.
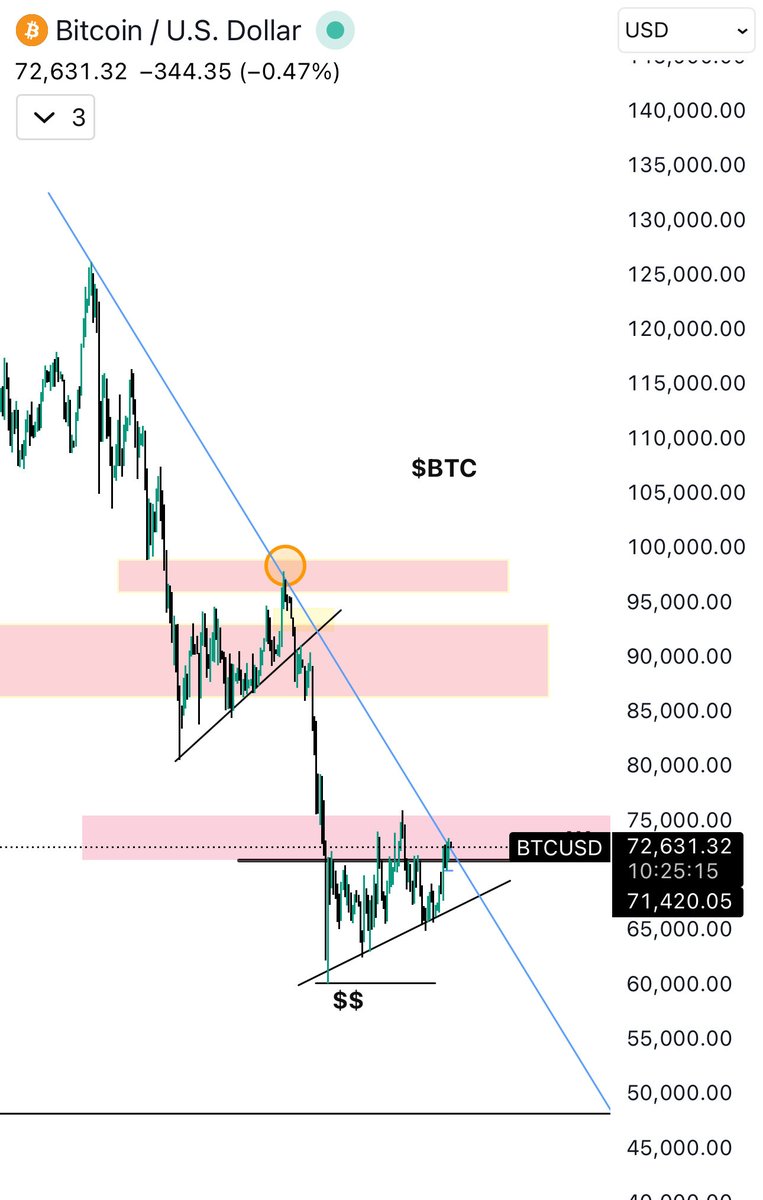
$BTC Is the Bottom Already In — or Is $50K Still on the Table?
The honest answer: both outcomes are supported by credible data right now.
🟢 The case the bottom is in
47 consecutive days of Extreme Fear. $316B stablecoin dry powder — largest in history. Whales accumulated 4,200 BTC in a single session. 200-week EMA held at $68K through six tests. Every crash driver is external — war, rates, options mechanics — not crypto-specific breakdown. Q2 has historically delivered +52% average returns after brutal Q1s. Institutional infrastructure — ETFs, commodity status, staking products — is the strongest it has ever been.
🔴 The case $50K is still possible
Peter Brandt’s bearish flag targets $50K if $66K breaks. Hot March CPI incoming in April with Iran oil shock baked in. Rate hike odds rose to 12.4%. ETF outflows accelerated in the final week of Q1. MARA sold 15K $BTC to service debt. Strategy paused buying for the first time in 3 months. Stagflation risk — inflation high, growth slowing — is the one macro scenario where the Fed can’t cut, and all risk assets suffer.
💡 The level that decides everything: $66,000. Holds → Q2 recovery toward $75K-$80K. Breaks → $50K becomes a legitimate target before May.
$ETH Rejection from supply + weak bounce → still lower high forming (bearish).
Lose trendline → continuation to 1.8k → 1.4k, no strength until reclaim above 2.2k. 📉
Are We Heading Into a Crypto Stagflation Trap — And What Does That Mean for $BTC ?
The macro backdrop that rattled crypto today: hot February PPI data released alongside the FOMC meeting showed inflation running hotter than expected, compounded by oil prices attempting to push back toward $100 as Iran tensions flare again. BMO's deputy chief economist warned that 'the caution flag is waving more vigorously' amid mounting stagflation risks — a scenario where inflation stays high while economic growth slows. In stagflation, central banks cannot cut rates to stimulate growth because inflation is still elevated. The first cut is now priced for October-December 2026 at the earliest.
The silver lining: Bitcoin has historically functioned as a stagflation hedge in severe macro stress scenarios, similar to gold. Gold itself hit an all-time high above $5,500 yesterday before pulling back 2.5% post-FOMC — suggesting even safe-haven assets got caught in the deleveraging. Polymarket now gives a 38% probability to $BTC hitting $65,000 before April. But the same market assigns 100% probability to BTC staying above $60,000 in March — meaning the crowd sees a floor, just not where it was yesterday.
💡 Takeaway: Stagflation risk is the most dangerous macro scenario for all assets including crypto, because the Fed’s hands are tied. Watch oil prices carefully — if WTI stays below $90, inflation fears moderate and rate-cut hopes recover. If oil breaks $100 again, expect another leg down across all risk assets.
The Fed Decides in Hours — Why Is $BTC Hitting a Wall at 75K Right Now?
$BTC surged to $75,925 overnight before pulling back to $73,717 this morning — running directly into the $75,000 options wall where significant open interest is clustered. The Fed's March 17-18 meeting decision drops at 2:00 PM ET today alongside an updated dot plot. Markets are pricing a 97% probability of a hold at 3.50-3.75%. But the real market mover is not the rate decision — it is Powell's language at his 2:30 PM press conference and whether the median dot shifts from one projected cut to two in 2026.
BTC's implied volatility has held steady even as traditional volatility indexes are spiking on equity and bond panic — a signal that crypto traders are less rattled than traditional markets right now. Options market data shows put selling at 70K strikes, indicating institutional support at that level. The BTC/SPX correlation sits at 0.67, elevated versus the 2025 average of 0.52, meaning a sharp equity move post-FOMC could drag crypto either way.
💡 Takeaway: 75K is a ceiling until the #FOMC clears. If Powell delivers dovish language + dot plot shifts to two cuts: 75K breaks and 80K comes into view. If hawkish: expect a fast pullback to 70K-$72K support. Don't trade the decision itself — wait for the dust to settle.
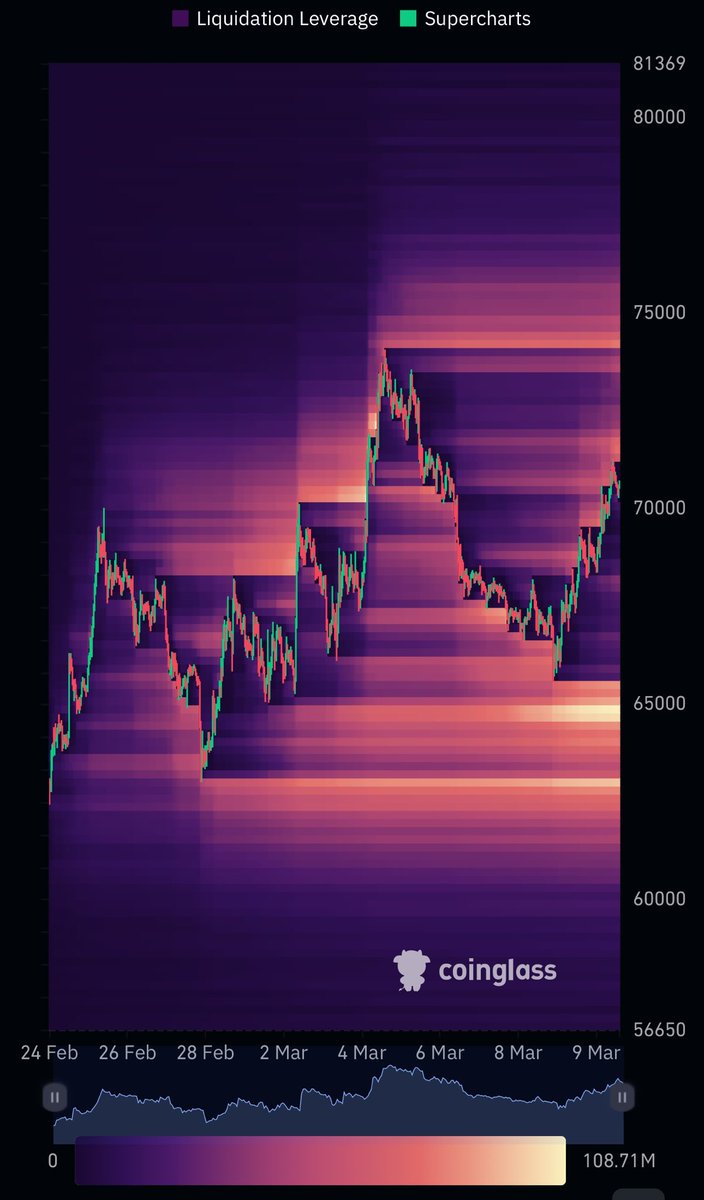
$BTC – Liquidity Heatmap Analysis (3-month)
•Market structure is bearish after the sharp breakdown from ~95k.
•Current price is ranging around 65k–72k, but liquidity below is much larger.
Key observation:
The big liquidity cluster you marked is around 58k–60k.
Implication:
Price often moves toward the largest liquidity pool, so a sweep of 60k liquidity is very likely before any sustainable move up.
Short path:
Small bounce → liquidity grab ~60k → possible deeper wick 55k.
$ETH – Short Analysis
Price is consolidating inside the $1.9k–$2.2k supply zone after a strong drop.
Structure remains bearish, and the ascending trendline looks weak.
If the zone fails, the next draw is $1.6k liquidity, with a potential extension toward $1.4k.
$HYPE Short Analysis (Liquidity Heatmap):
Price is moving toward a large liquidity cluster around $38–$40 (bright zone).
Short term, it may push slightly higher to sweep that liquidity, then react.
If rejected there, price likely rotates back toward $30–$28 liquidity below.
$BTC – Liquidation Heatmap
Price is moving toward stacked liquidity around $72k–$74k, which could trigger a short squeeze.
However, large liquidity remains below at $63k–$65k, acting as the main downside magnet.
With structure still weak, a sweep of $73k liquidity followed by a move back toward $65k is a plausible path.