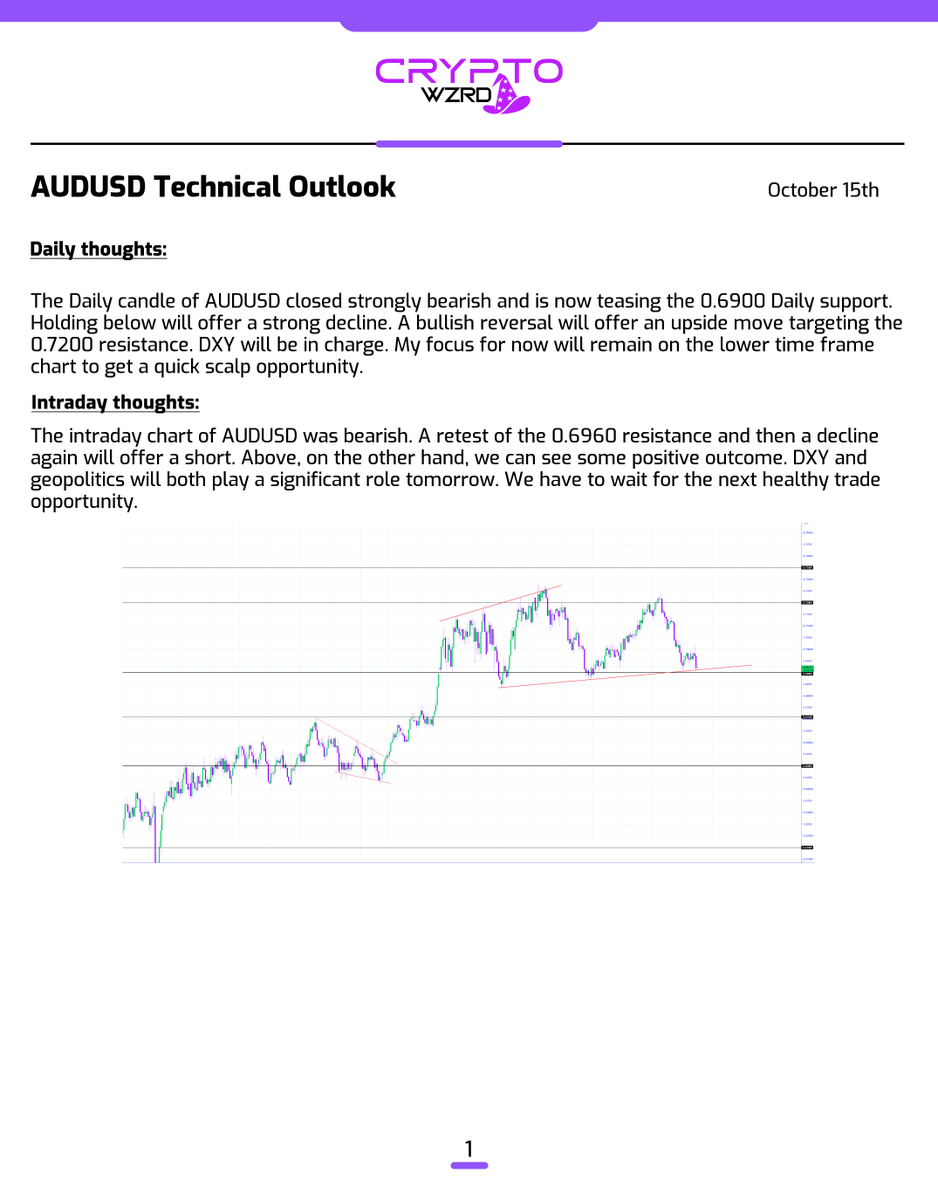
LINK Daily Technical Outlook:
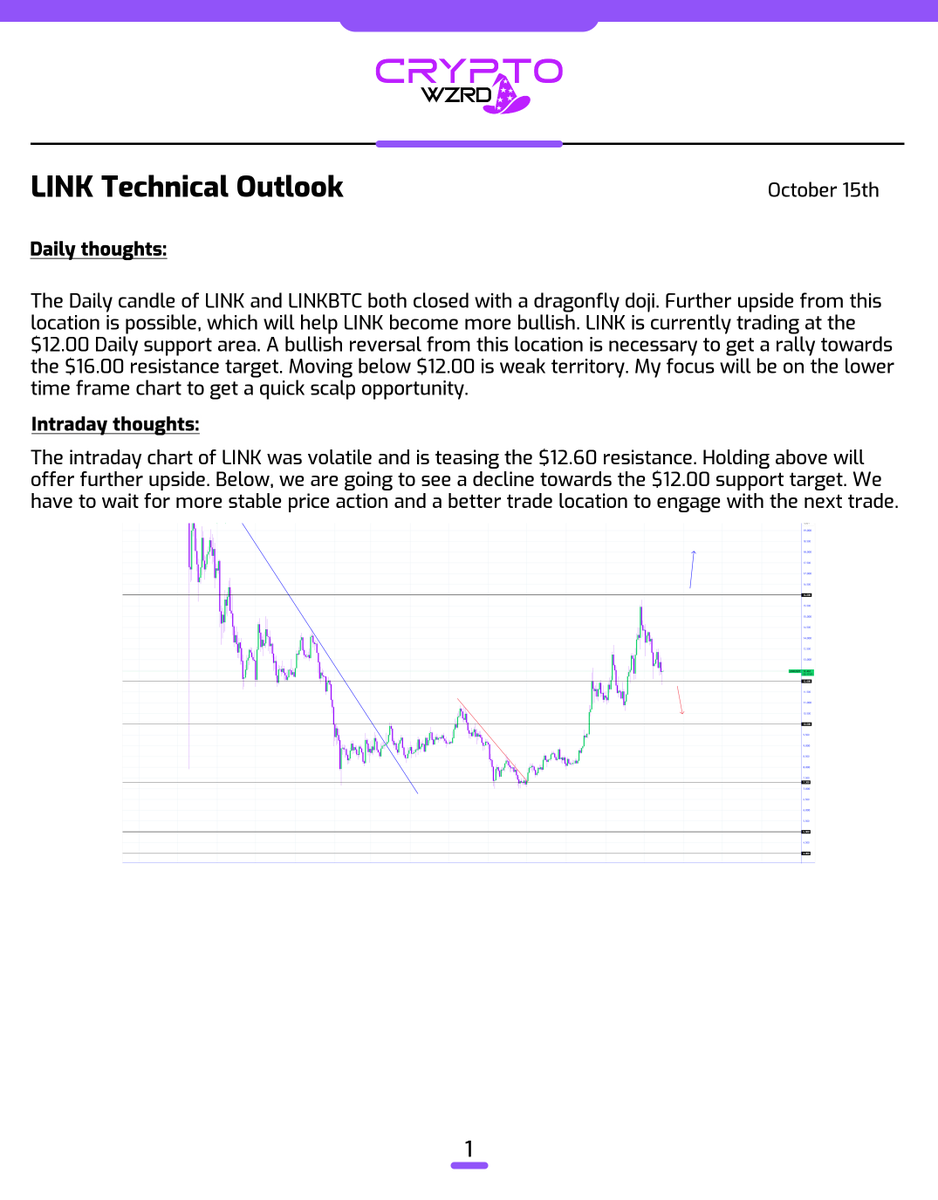
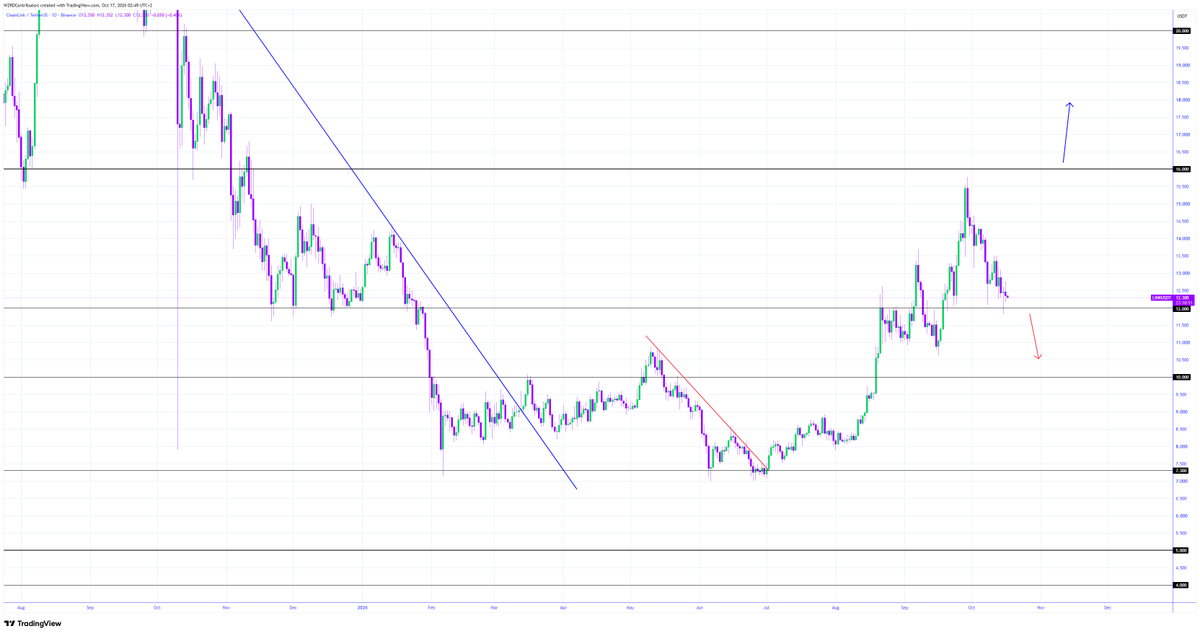
$LINK closed slightly bearish. The intraday chart was choppy. A stable bullish breakout with chart structure above the $12.60 resistance will trigger a long. Holding below will see more sideways movement 🧙♂️
XRP Daily Technical Outlook:
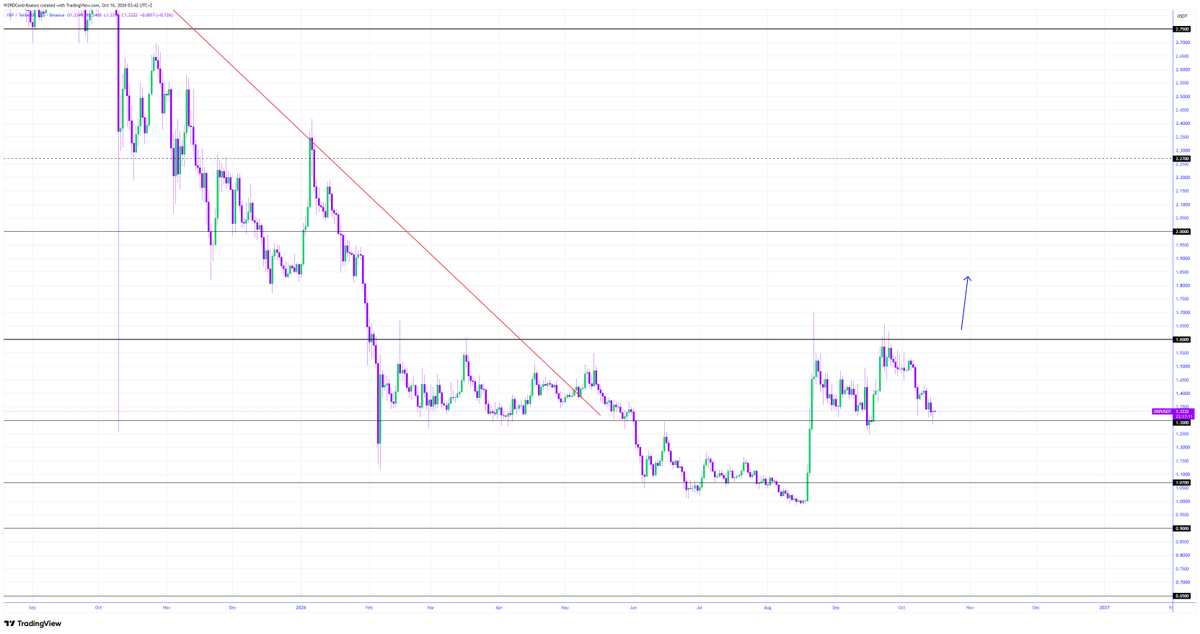
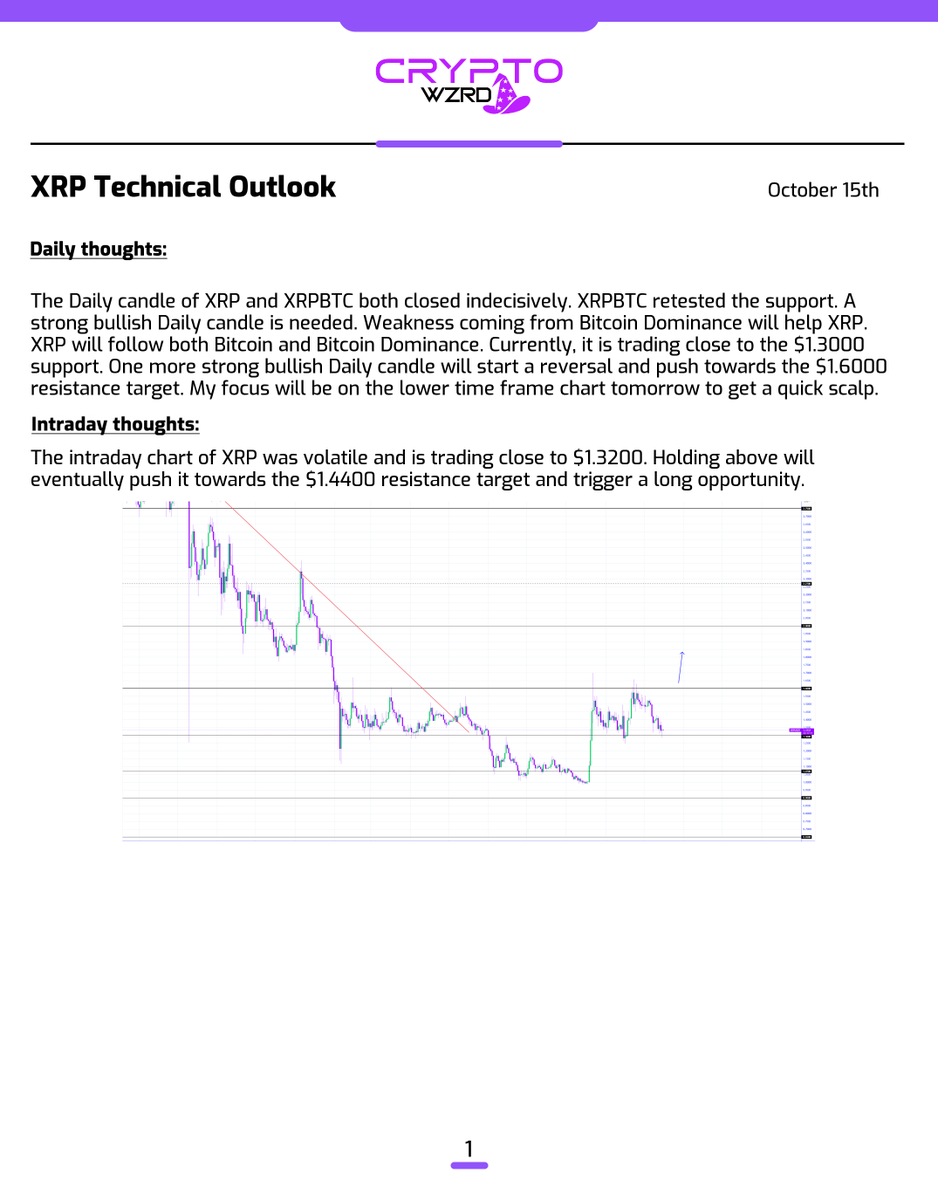
$XRP closed bearish. The intraday chart is trading below $1.3200. A further bearish move will offer a decline and a short. Holding above $1.3200 can offer sideways movement and a long. Bitcoin will play a significant role over the weekend 🤔
LTC Daily Technical Outlook:
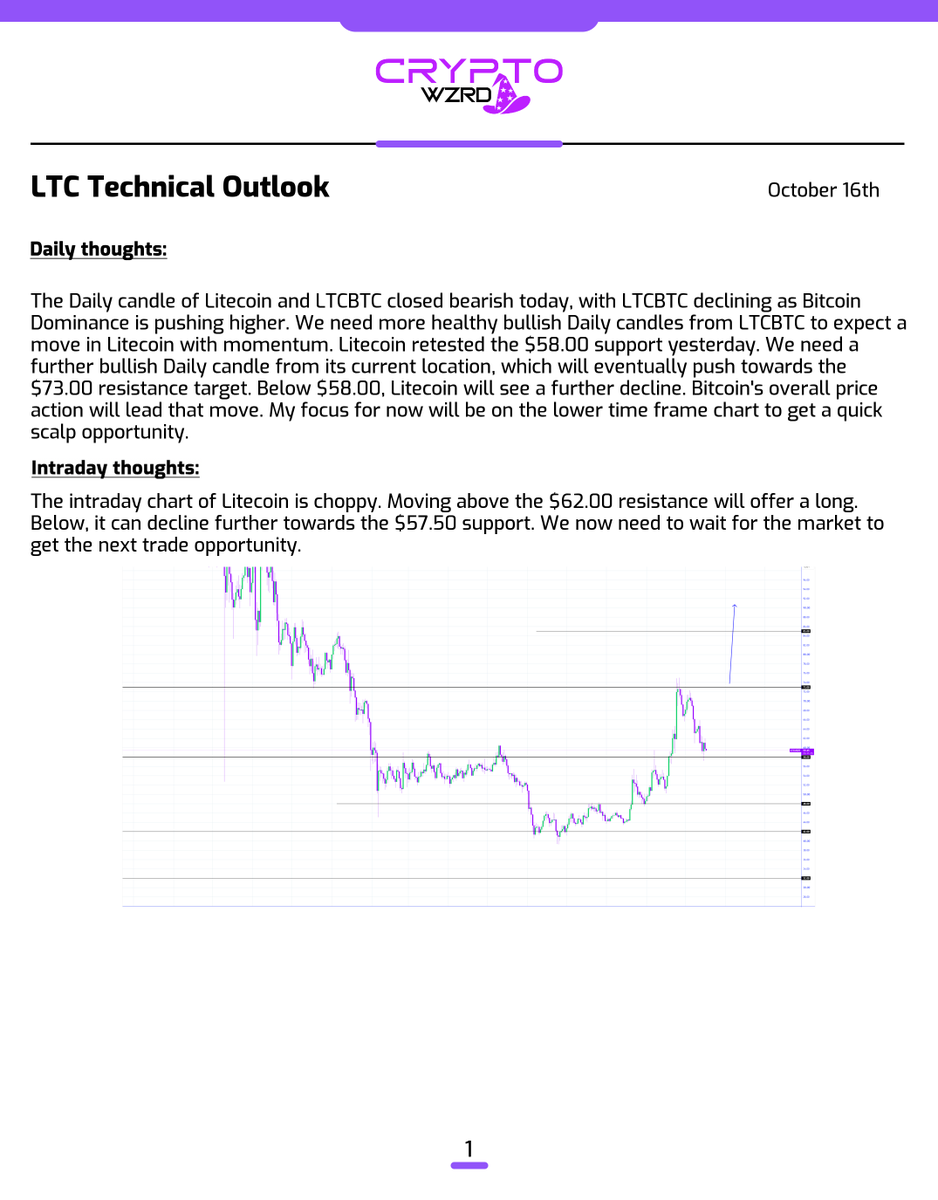
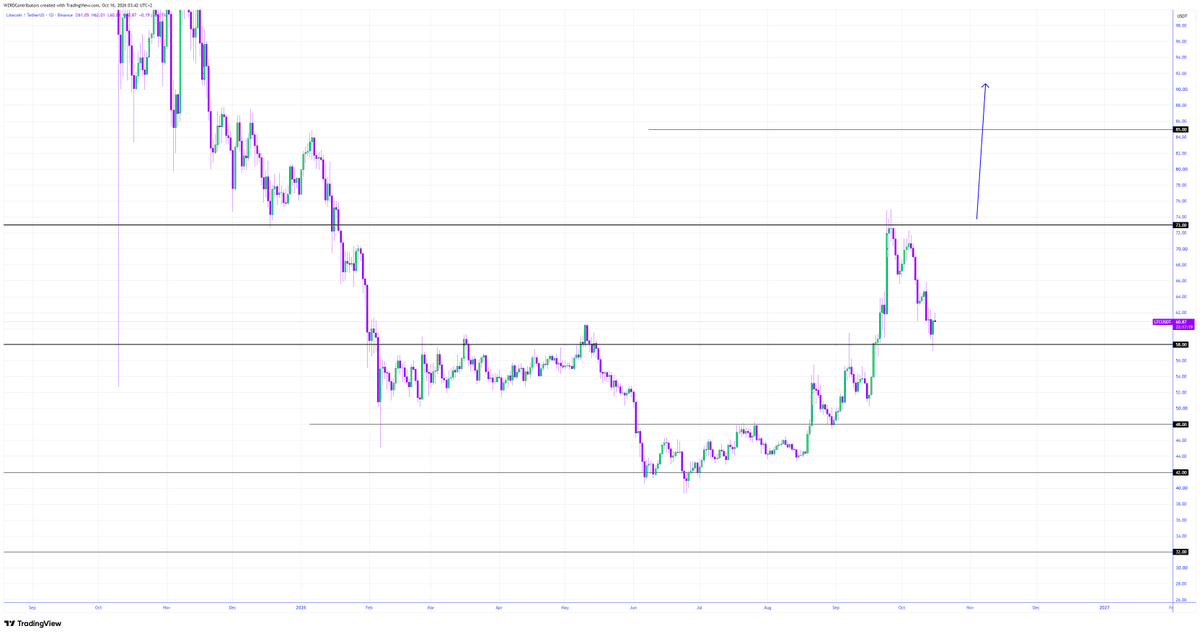
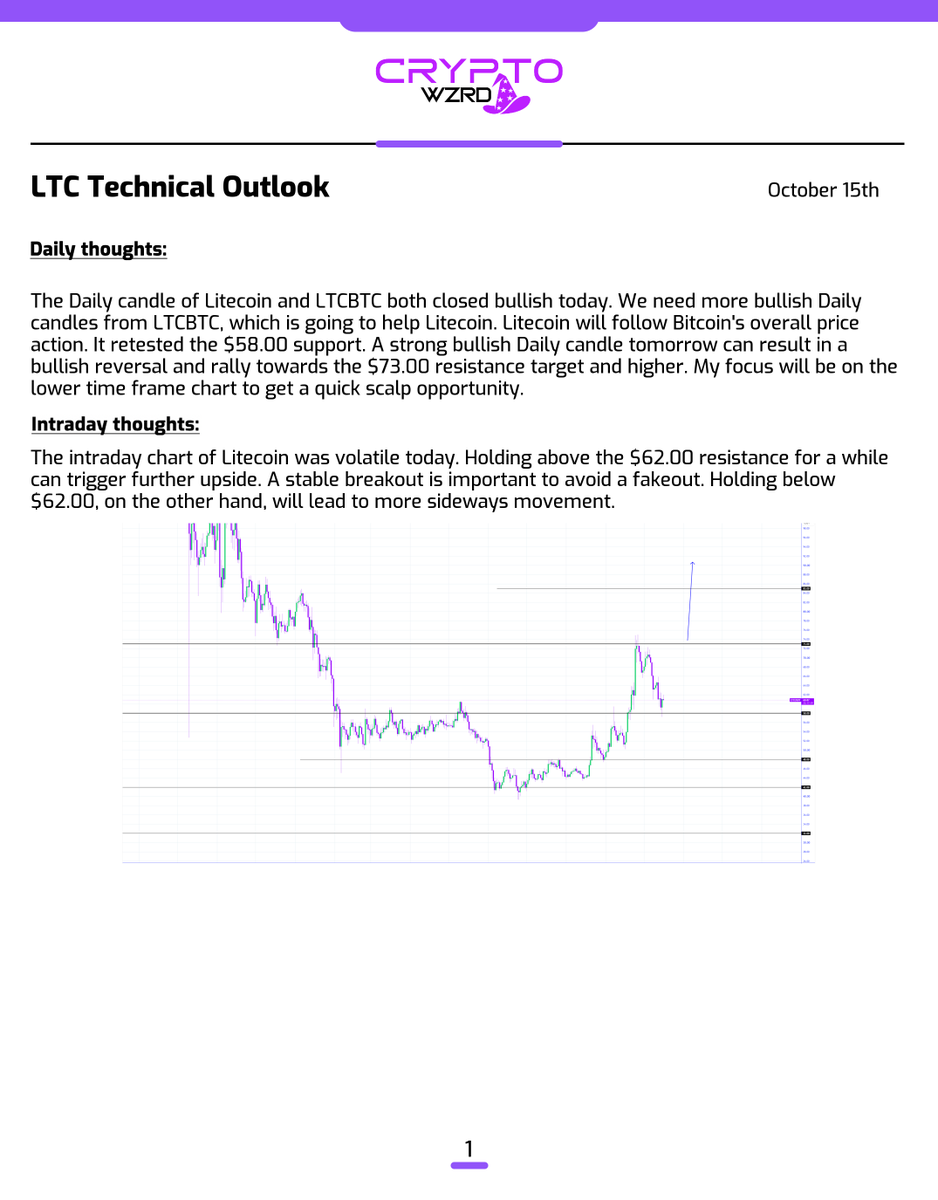
$LTC closed slightly bearish. I’ll focus more on its intraday chart structure over the weekend. Holding above the $62.00 resistance will offer a long. Below, more sideways movement will take place 😈
ETH Daily Technical Outlook:
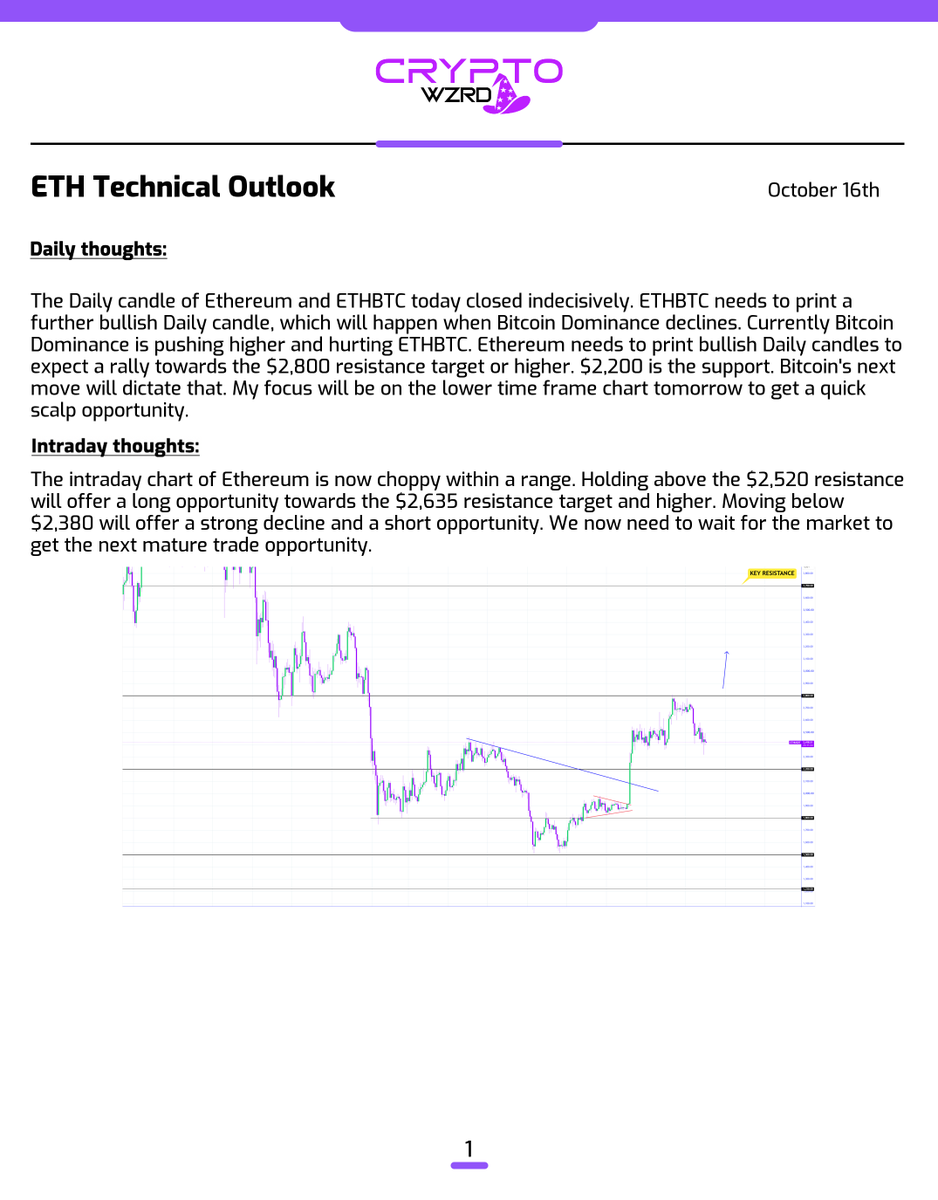
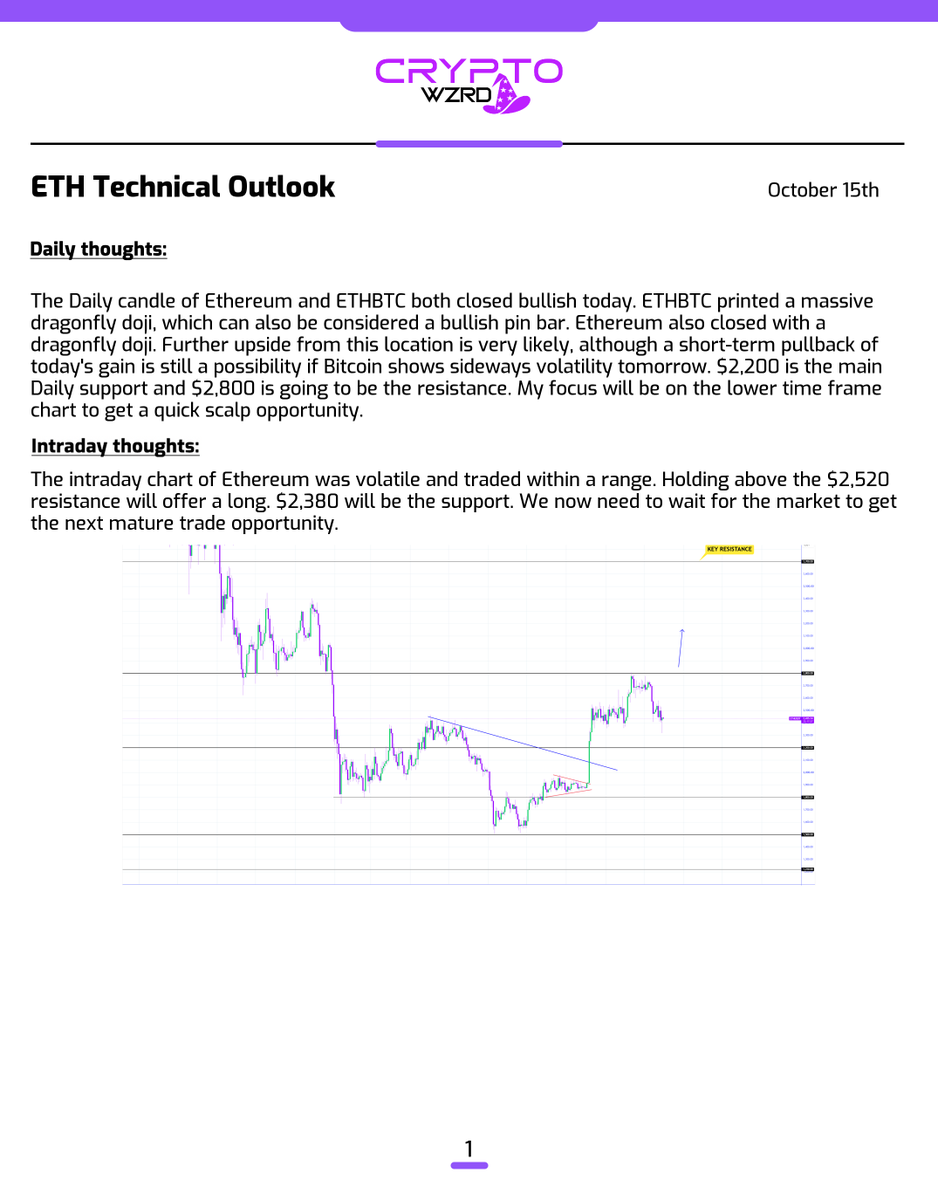
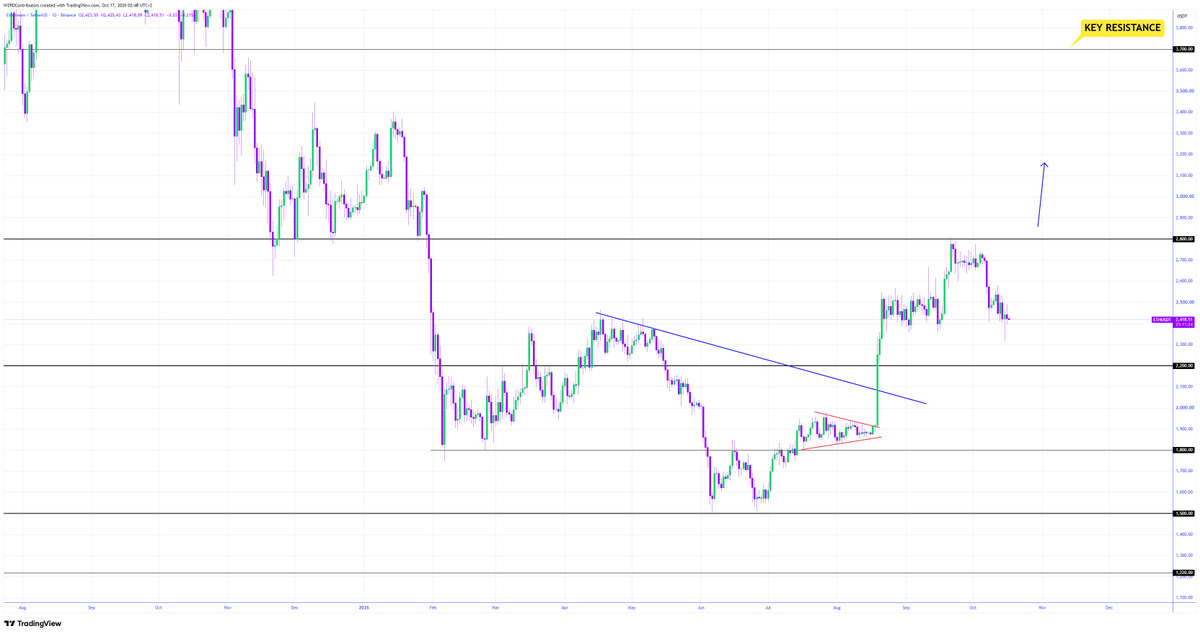
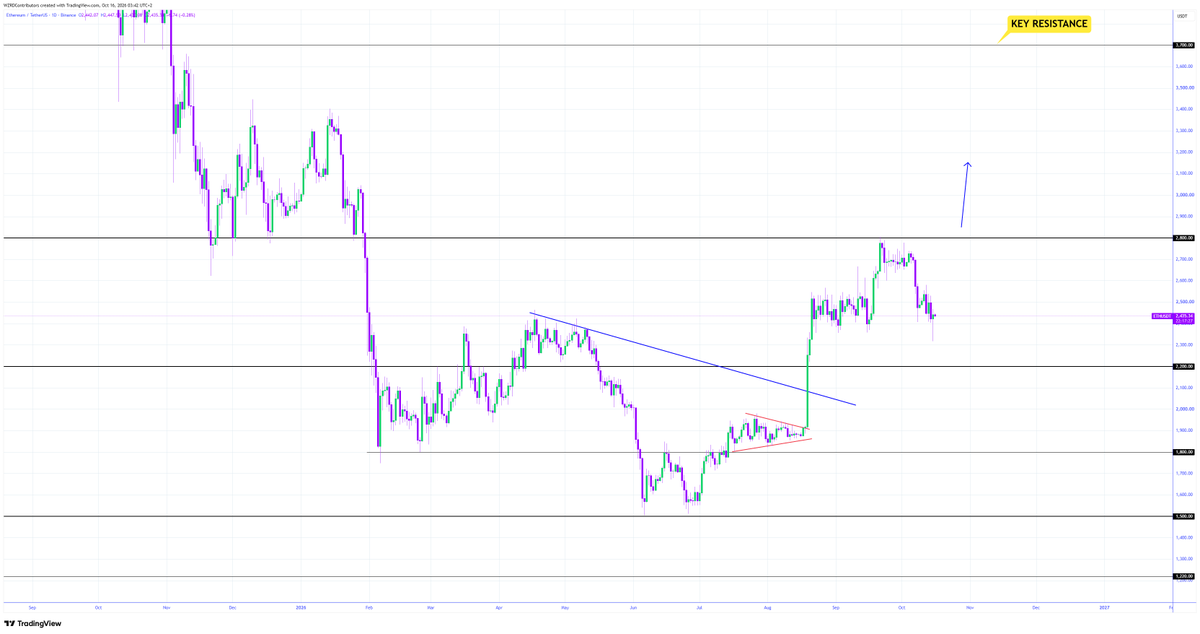
$ETH closed indecisively and entered a sideways trend within a range. A bearish breakout below the $2,380 support will offer a short. Holding above the $2,520 resistance will offer a long 👀
BTC Daily Technical Outlook:
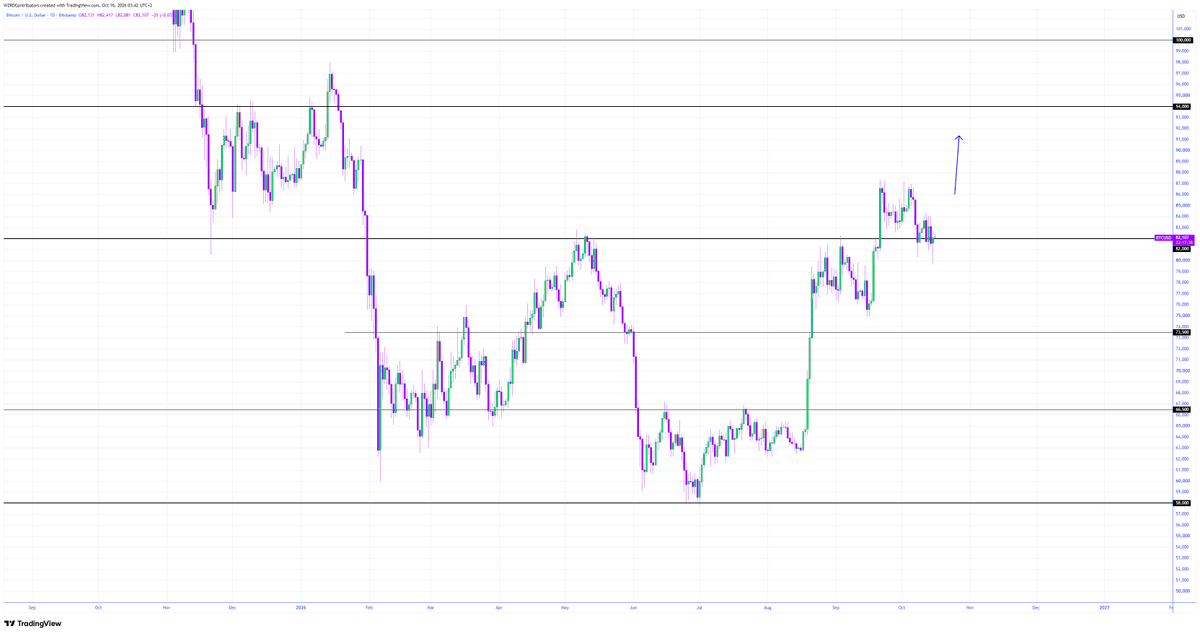
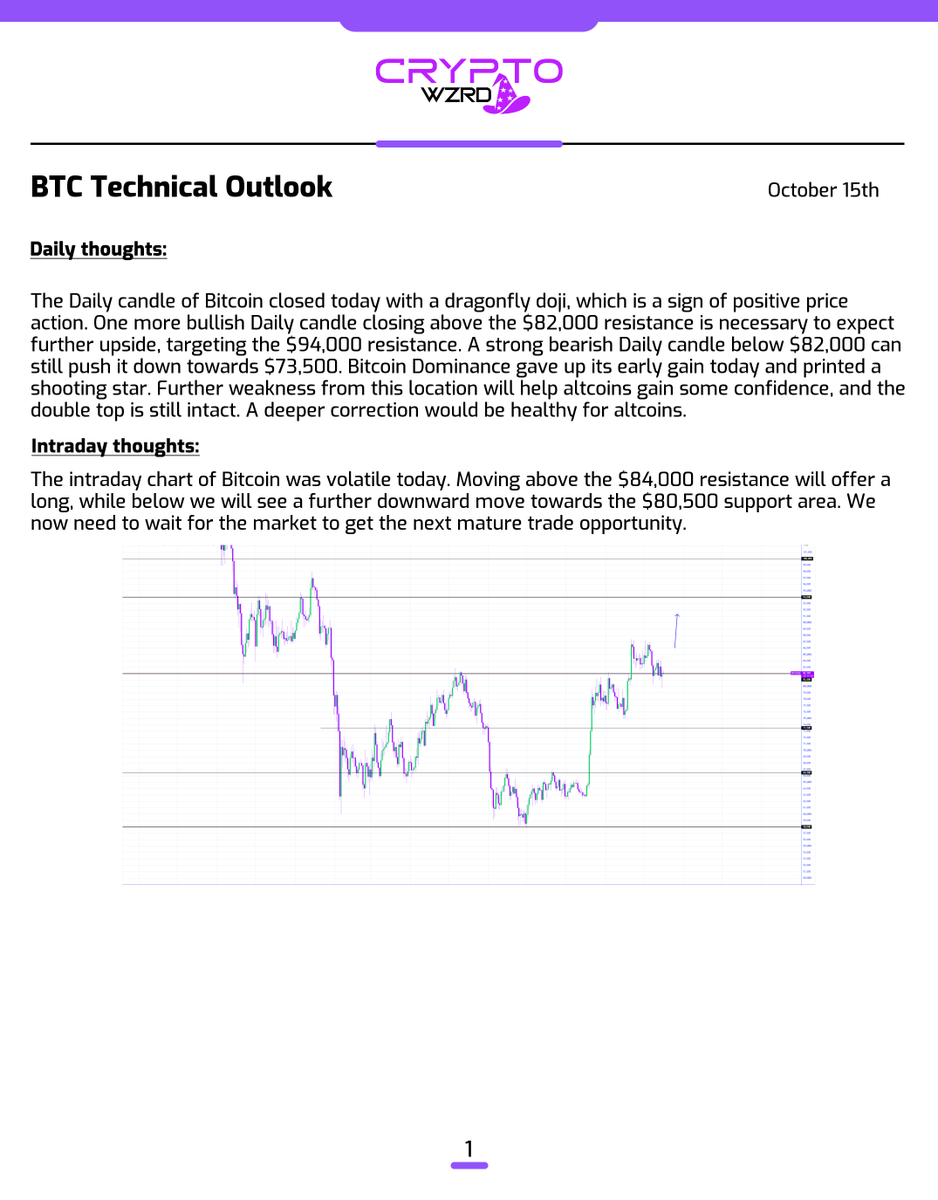
$BTC closed indecisively. A breakout above the $84,000 resistance will offer a long. Below, it will see more sideways movement. A bearish move below $80,500 will offer a short ⚡️
🔮 SIMILARITIES 🔑
It doesn’t just rocket..
⚠️ Once $BTC breaks the bear accumulation it takes a significant time to consolidate before the true lift-off, just look at 2021 🧘🏻
Be Patient! 💭
⚠️ BATTLE IS ON 👀
Once previous support, now resistance..
🚨 Uptober has been quite subdued, for the market to explode higher $BTC has to clear this monthly resistance 🔑
Patience is needed!
LINK Daily Technical Outlook:
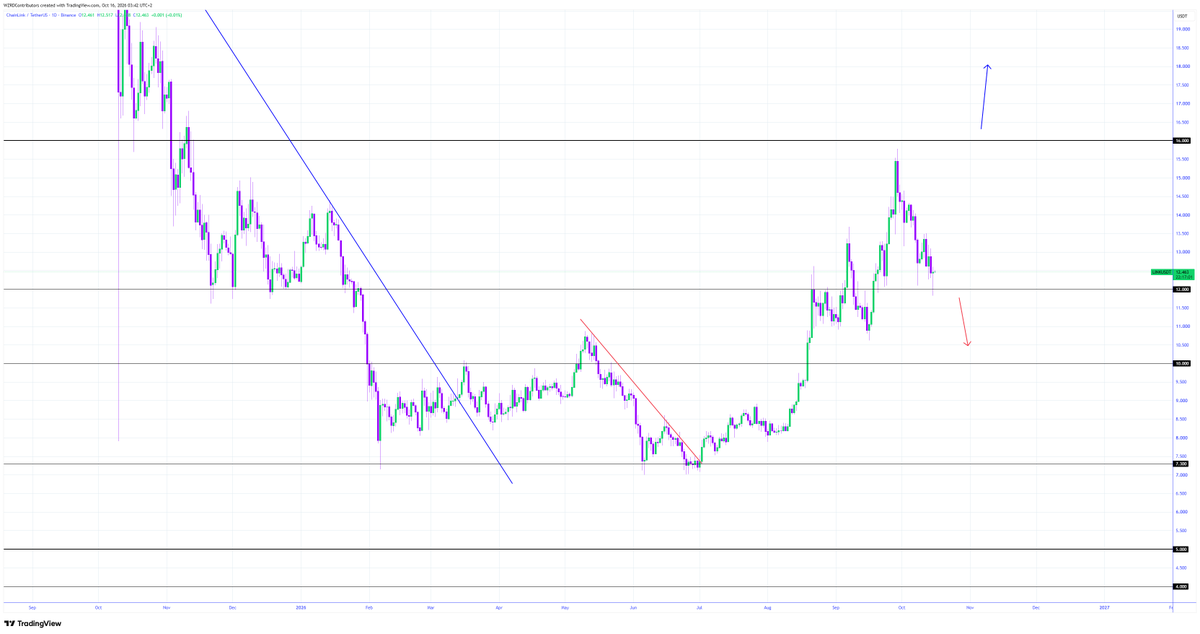
$LINK closed with a dragonfly doji. The intraday chart needs to hold above the $12.60 resistance to expect a long targeting $13.50. Holding below $12.60 will offer further downward movement and a short 🤔
XRP Daily Technical Outlook:
$XRP closed indecisively. Moving and holding above the $1.4400 resistance can trigger a long. Below, $1.3200 is the support. We have to wait for a better chart structure to engage with the next trade ⚡️
LTC Daily Technical Outlook:
$LTC closed bullish. We need to see it hold above the $62.00 resistance for a while to avoid a fakeout and get a quick rally towards the $66.20 resistance and beyond 👀
ETH Daily Technical Outlook:
$ETH closed bullish with a dragonfly doji candle. I expect to see more volatility from Ethereum. Holding above the $2,520 resistance will offer a long. Below, more sideways movement will take place 🧙♂️
BTC Daily Technical Outlook:
$BTC closed bullish. We need one more Daily bullish candle from this location. Holding above the $84,000 resistance will offer a long. Below, $80,500 is the support. Bitcoin's overall price action will play a major role tomorrow for altcoins 😈
Oil Daily Technical Outlook:
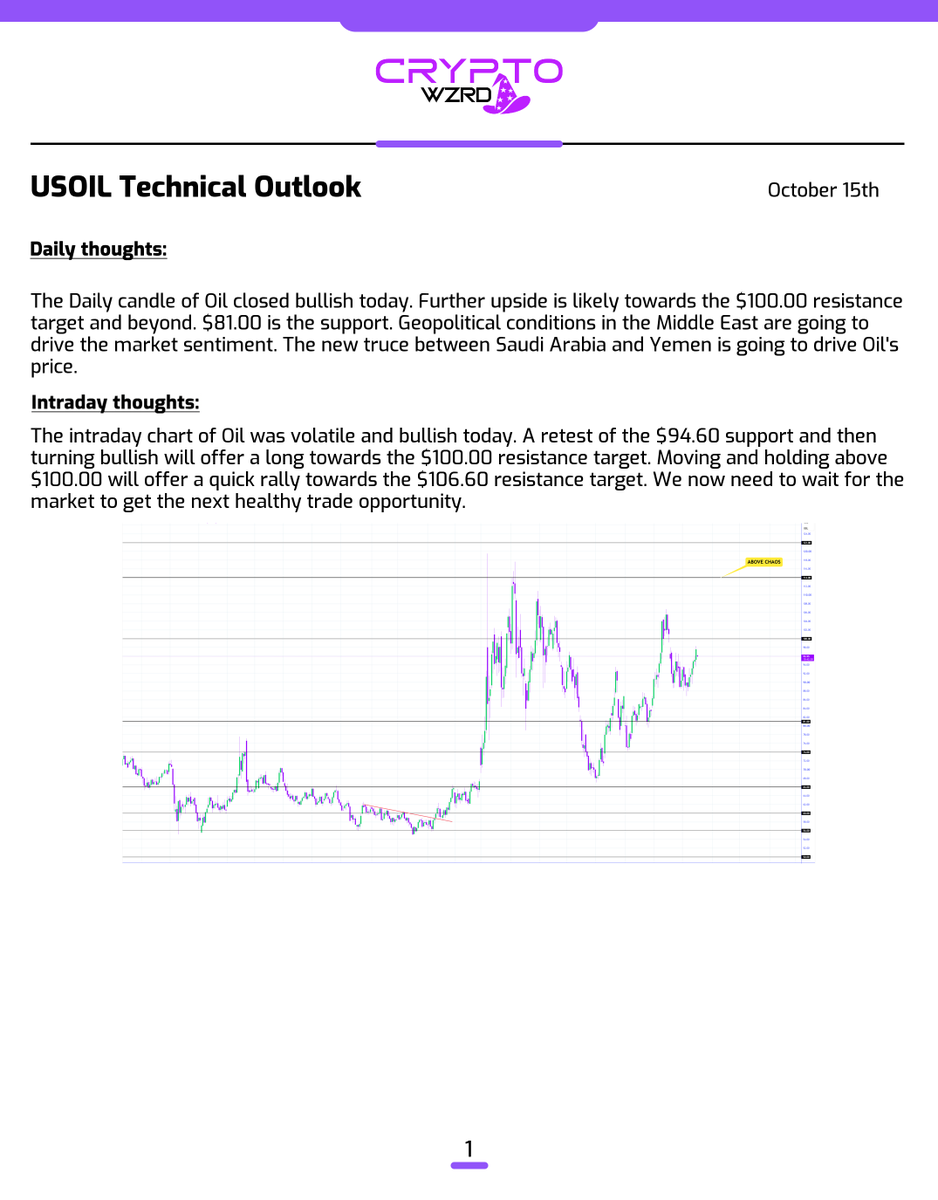
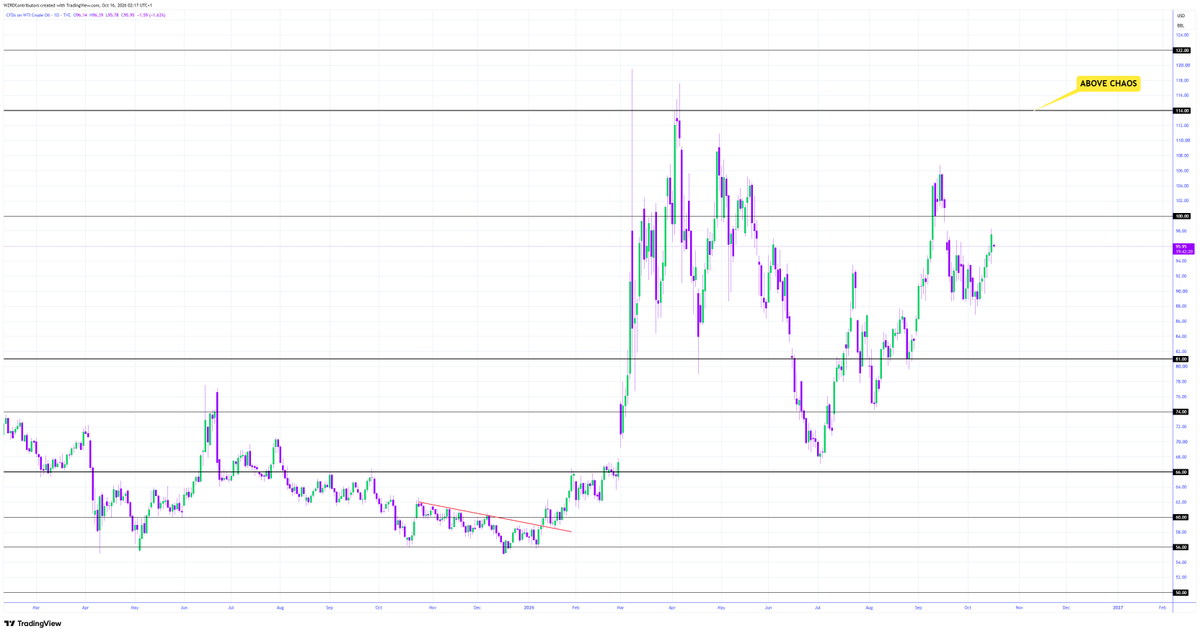
$Oil closed bullish. It is trading close to the $100.00 resistance. Geopolitics will dictate the outcome. The intraday chart holding above $94.60 is bullish territory 👀
XAUUSD Daily Technical Outlook:
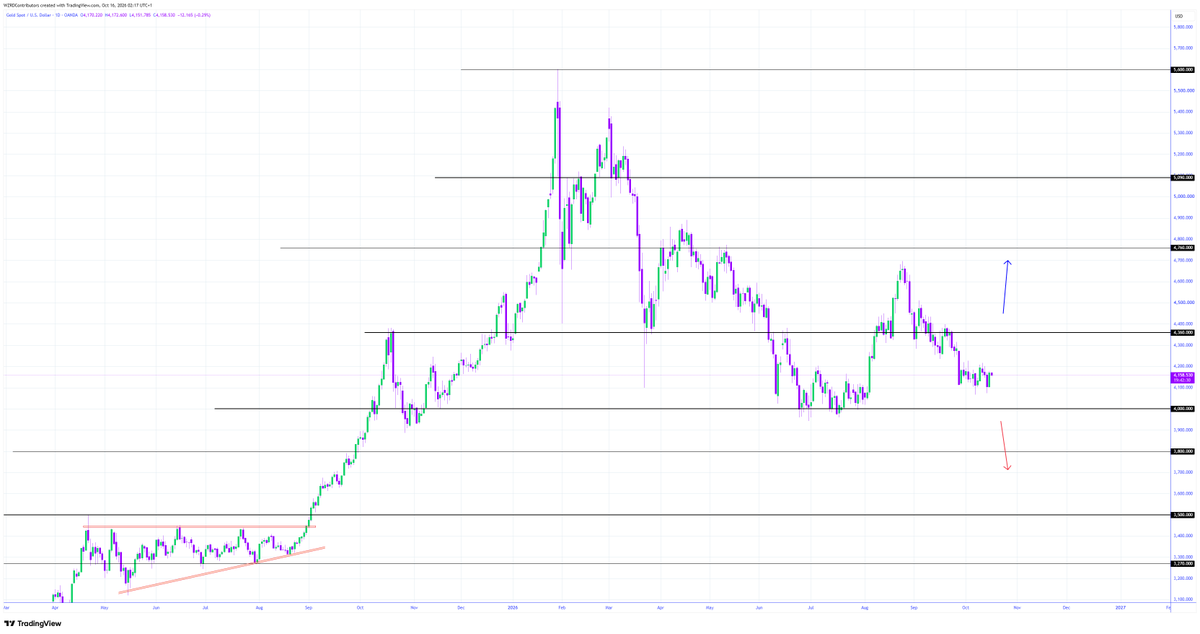
$Gold closed bullish. The intraday chart was somewhat volatile. Holding above the $4,215 resistance is going to offer a long. Below, $4,110 is going to be the support 😈
GBPUSD Daily Technical Outlook:
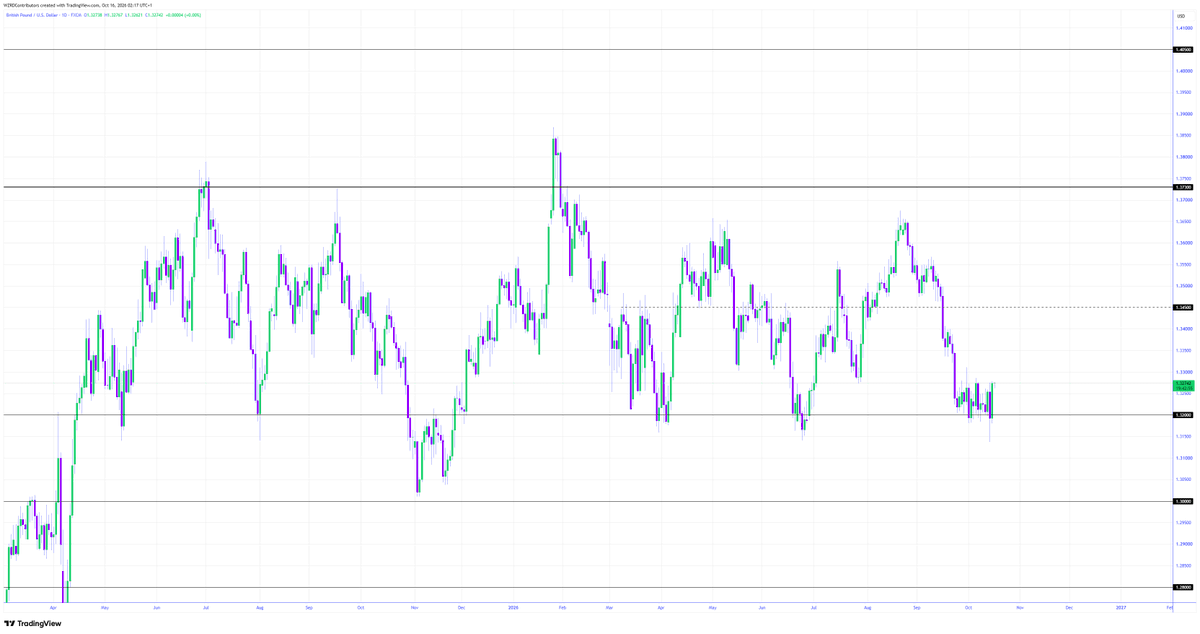
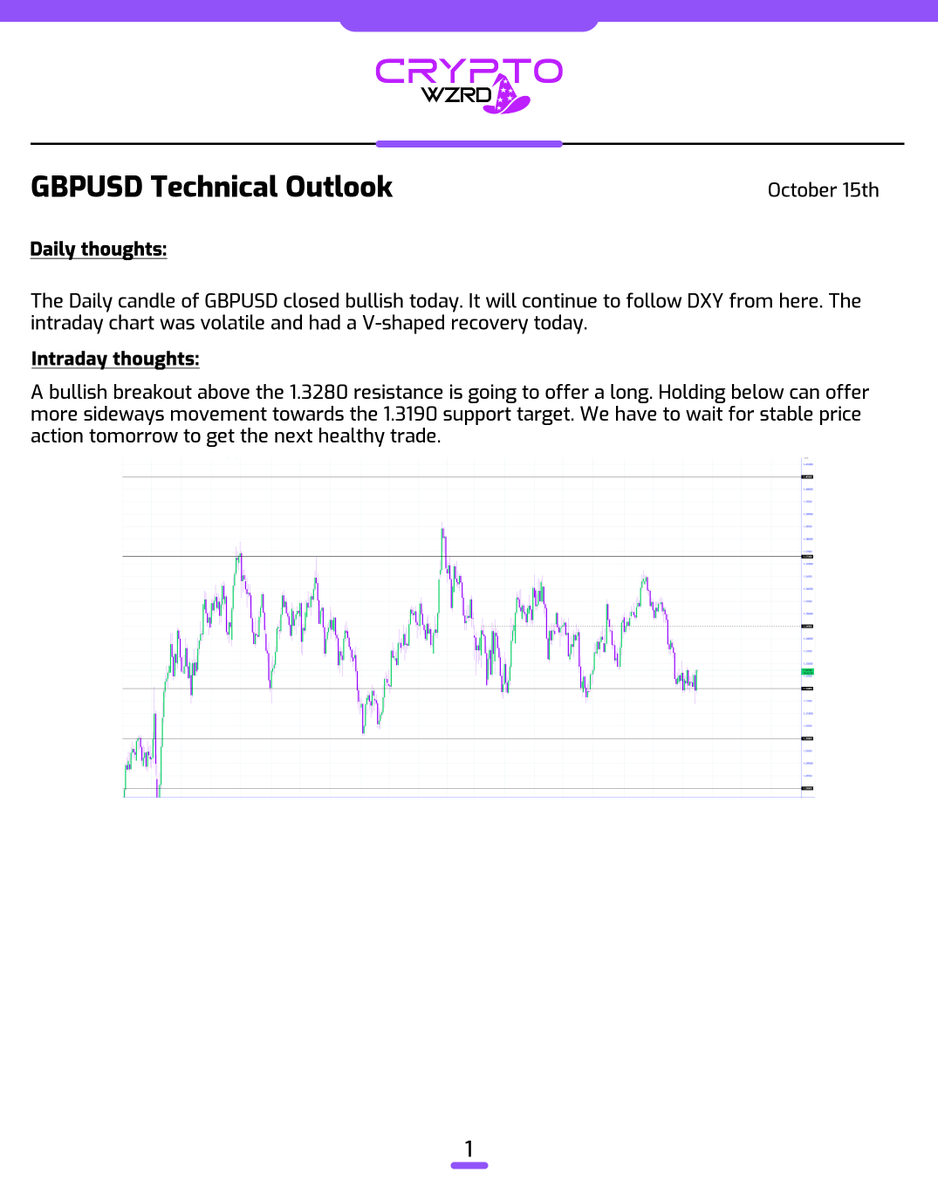
GBPUSD closed bullish and the intraday chart was trading within a range. A bullish breakout above the 1.3280 resistance will offer a long. Below, we will see sideways continuation 🤔
EURUSD Daily Technical Outlook:
EURUSD closed bullish, although we need more healthy Daily candles. The intraday chart was volatile. Moving and holding above the 1.1260 resistance can offer a long, targeting the 1.1340 resistance. Below, 1.1120 is going to be the support ⚡️
⚠️ LOOKING FOR IT? 👀
The pullback continues..
🚨 $BTC has pulled back from the yearly open, could it be headed for a retest of the 200D EMA? It’s a must hold area 🔑
Patience Pays 🧘🏻
🔮 DECISION TIME 🍿
The question I asked a week ago..
⚠️ $BTC has swept the range lows and is now trading in the potential deviation region, bulls need a reversal from here or it will go lower 🔑
Dips are for buying!
🔮 SEEN IT BEFORE 👀
Is the same structure forming?
⚠️ $BTC has been trading in a sideways range similar to September, is a sweep and reversal to come? 🍿
Big moment coming!
LINK Daily Technical Outlook:
$LINK closed bearish. The intraday chart moving above the $12.60 resistance and then turning bearish again will offer a short. To become bullish, it needs to hold above the $13.50 resistance, so it will still take time 👀