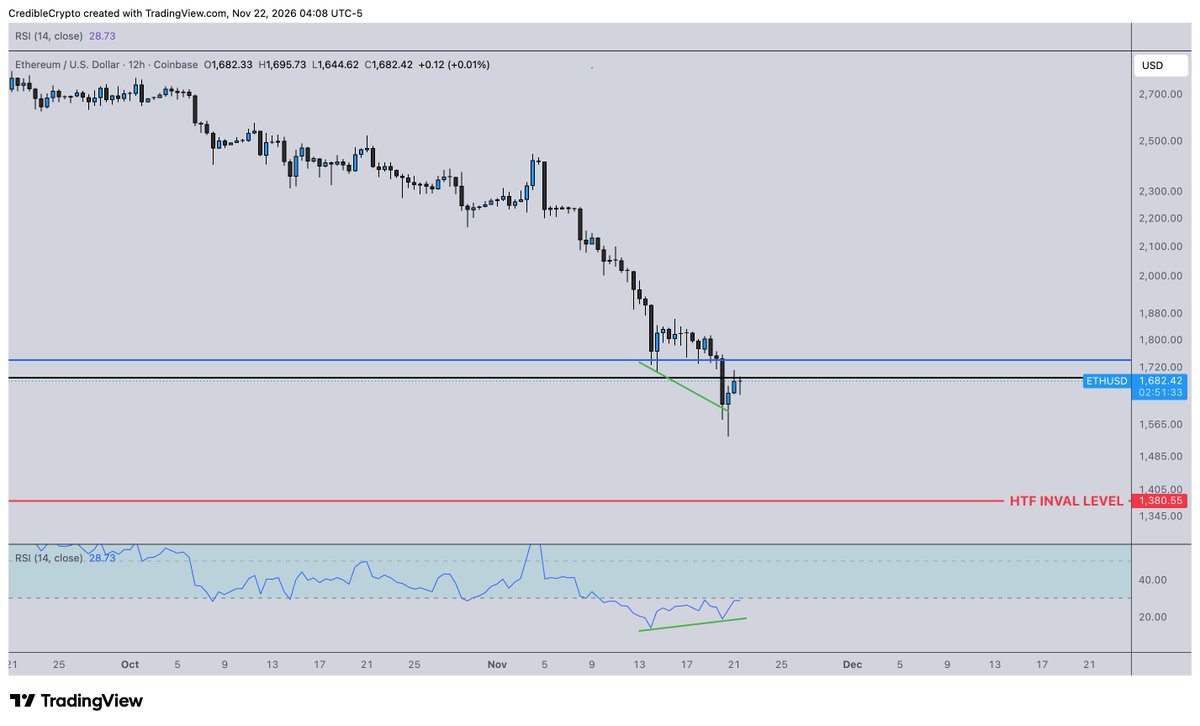
Meanwhile ETH/BTC looks nearly the same as before- holding up well here and really looks poised for some outperformance, but we NEED a reversal across the board to get it imo.
ETH/USD sitting above a key macro/HTF structural level, while ETH/BTC is just itching to pump, but $BTC dragging the entire market down.
If BTC can just find it's footing, ETH/USD may avoid the HTF inval level, and in that case ETH/BTC is signaling that ETH will likely rebound much harder to the upside than BTC.
On the other hand if our macro level on ETH/USD IS breached, I would expect ETH/BTC takes a hit as well and not hold it's structure either.
@CryptoAgent_ That's not what I said at all- of course there are external factors that affect the markets- hundreds of them, all effecting the market in different ways at the same time.
I don't proclaim to know the "why" about Bitcoin price movements.
Even if I get a move right, you won't hear me say "well Bitcoin price pumped because of so and so event".
Because the reality is, there is no way to definitively prove which combination of a hundred different factors influenced the buyers and sellers that actually move price to buy/sell the way that they did.
Telling you "Bitcoin price dropped or pumped because of X, Y and Z" as if I have some secret power that can look into the minds of every buyer and seller in this trillion dollar market is silly.
So instead, you will almost never see me focus on a "narrative" or "macro" to try and justify why Bitcoin price behaved the way it did.
I don't care to try and identify the cause behind the movement because it is almost impossible to do so, and even if I am able to come to a conclusion that seems to make sense- it's almost impossible to verify.
Correlations may exist, but correlation is not causation. Acting as if I somehow KNOW that a correlation I've identified is also actually the driving force behind PA itself might make me sound like a genius, and many would eat it up, but it is disingenuous.
So instead, I just focus on the chart (which is literally a visual depiction of factual buy/sell data) and don't rack my brain trying to solve an unsolvable puzzle.
The average Joe hates this. They want an explanation- why did price do what it did? What caused this?
Since technical analysis is a complex and often misunderstood "science", most can't wrap their minds around it just want a simple answer (which no one can really give).
But hey- if you can't prove causation, it also means nobody can debunk your claims about causation either. So for those that don't do technical analysis and/or don't understand it, creating a narrative around why price is moving the way it is is an easily digestible approach for the masses, and they will eat it right up while calling technical analysis "crazy lines on a chart".
Had some questions from people asking me why I think crypto could be bottoming while I am still looking for another 10% lower on the SPX.
I explained I don't believe that Bitcoin MUST fall along with the SPX as I specifically recalled times where this didn't happen and everyone on here was super surprised.
Did a little digging because the question popped up again- here are two great examples of $BTC forming a bottom and holding up better than trad equities during corrective phases.
First blue circle- BTC bottomed, SPX took another 2 months to find a bottom of its own.
Second blue circle, BTC swept its local lows for a final bottom while the SPX fell another 12% in that same window.
Here is that "larger pullback" we were due for on trad equities.
Looking for another ~10% lower to hit our blue zone on the $SPX at which point we may see a more drawn out multi-month correction/consolidation before we are ready for the next and FINAL leg (blow off top) of our cycle that began in 2009.
Chart was not drawn to scale initially, but a 10,000+ target for the SPX as a blow off top target would make a lot of sense. Those big round numbers are significant psychological take profit levels (like BTC 20k, 100k, etc).
The entire altcoin market is down and has been since 2021 with the exception of a few newer alts that have performed well. Most everything created in (or shortly after) 2021 has been down only since then due to broader market conditions.
Of all the alts created since then, maybe 95+% have literally gone to zero or are now literally defunct/abandoned.
And so accounts on this platform that have mentioned hundreds of tickers over the years can probably only list less than 5% that still exist while the other 95% have been wiped from this space.
Meanwhile, I am getting grief from people for talking about the same 2-3 tokens during this same period of time- tokens for projects which still exist today, function, and in some cases generate millions in annual revenues and in ALL cases still remain absolutely relevant/productive even in today's environment.
Somehow this is being painted as a bad thing, despite the fact that these few tokens sit in the basket of the 5% that are actually still relevant, while thousands of others sit in the basket of the other 95% which are dead and gone.
Its actually insane.
Here is that "larger pullback" we were due for on trad equities.
Looking for another ~10% lower to hit our blue zone on the $SPX at which point we may see a more drawn out multi-month correction/consolidation before we are ready for the next and FINAL leg (blow off top) of our cycle that began in 2009.
Chart was not drawn to scale initially, but a 10,000+ target for the SPX as a blow off top target would make a lot of sense. Those big round numbers are significant psychological take profit levels (like BTC 20k, 100k, etc).
Still have not tested the blue zone on the $SPX which is still a valid pullback zone.
Still missing:
1. A larger correction (4th subwave)
2. A blow off top (5th subwave)
And now seeing potential bearish divergences (not confirmed yet) piling up on higher TF's like the 3W and monthly.
Would not surprise me if we got a larger/more aggressive multi-month pullback on traditional equities- to a point where many are convinced that our top is in- before actually getting our final leg/blow off top to end our 5-wave cycle that began in 2009.
If we do see a correction in the coming weeks/months, watch that BLUE zone, as it holds the key and may present the last major buying opp before our blow off top and the conclusion of a full 16-20 year cycle.
@zakarianagii We shoudn't hit subwave 1 territory which coincidetally (and conveniently) lines up with the bottom of our blue zone- so basically inval is if the blue zone doesn't hold.
I could choose not to post lower timeframe TA/analysis and actual trade setups that have clear invalidation and guess what- I'd be "right" a hell of a lot more times than I'd be wrong because I'd stick to broad, overarching and general statements instead of actually focusing on trading education which involves frequent invalidations and pivots especially on lower timeframes. Trading isn't about being "right" its about identifying key levels where there is defined risk, measuring probability of success, and attempting a trade if its +EV even if the chance of success may be 5%. Again, the average joe, like you "chad blake" can't understand this, so its a bit pointless trying to explain it to you.
Yea I mean there is def concrete data that I think can be referenced as a factor that may for sure be in play/contributing to a move. The issue I was more referring to is people finding correlations and then pointing at those correlations and saying "I told you this would happen to Bitcoin because X/Y/Z correlation exists so it was obvious" when there is no actual data to show HOW this correlation may have contributed to causation (if at all).
@rebaisaspy@SouhailIbnMurra Hmm not sure about the measurements and all- to me a three drives is just repeated SFP's of key swing lows to form a series of lower lows.
Had some questions from people asking me why I think crypto could be bottoming while I am still looking for another 10% lower on the SPX.
I explained I don't believe that Bitcoin MUST fall along with the SPX as I specifically recalled times where this didn't happen and everyone on here was super surprised.
Did a little digging because the question popped up again- here are two great examples of $BTC forming a bottom and holding up better than trad equities during corrective phases.
First blue circle- BTC bottomed, SPX took another 2 months to find a bottom of its own.
Second blue circle, BTC swept its local lows for a final bottom while the SPX fell another 12% in that same window.
Early days still, but this would make for one hell of a HTF close.
A weekly + close at or above these levels would leave us with what is essentially a liq grab of the lows while still holding the larger demand cluster from 50-75k that we spent 8 months consolidating at before breaking 100k+ $BTC.