The fed hikes rates, but gold rebounds sharply??
Here's the breakdown!
#ad 🤝 Sponsored by Maven
Disclaimer: Trading involves risk. This is not financial advice.
Always do your own due diligence and research before trading with any firm.
Ahead of tomorrow's release of US CPI inflation, expectations point toward a moderation in January’s monthly headline inflation but a pickup in core inflation (WSJ table below).
What is virtually guaranteed is that these first 2026 inflation numbers will be part of a bigger set of data confirming that the US is in its sixth consecutive year of inflation running above the Federal Reserve’s target.
That’s the bad news. The silver lining so far? This persistent "inflation slippage" has not unanchored long-term inflation expectations.
#economy #markets #inflation @wsj
How To Use The Relative Strength Index (RSI)
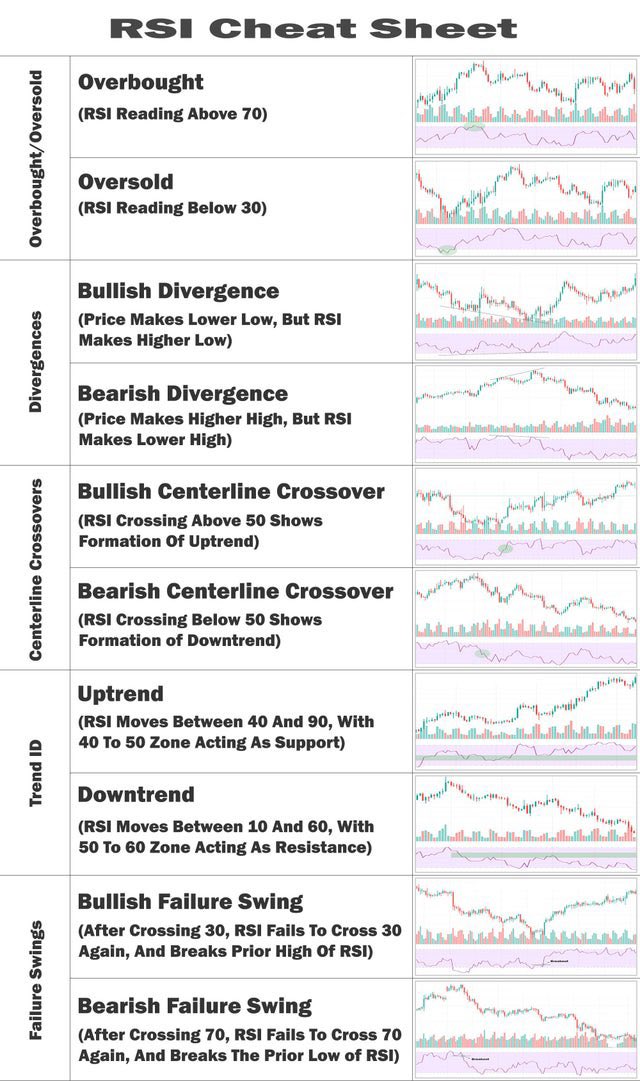
The RSI technical indicator buy and sell signals are based on oversold and overbought conditions on a price chart. The RSI is a measurement of price moving too far and too fast in one direction, and as the RSI gets extended farther from the 50 RSI middle line, the probability of a reversion to that mean increases.
The RSI moves in a bounded range between zero and 100. I use the RSI on the (14) setting on the daily chart. The RSI is generally overbought when its reading is above 70 and oversold when it reads below 30. Signals can also be generated by looking for divergences between RSI and price action, as one makes a higher high or lower low and the other doesn’t.
I look at the RSI chart as an oscillator that measures the risk/reward ratio. As it nears 30, the reward favors the buyer as a stock or index has moved too far down too fast and could be due for a bounce. At the 70 RSI, the reward for long positions has started to diminish in most cases as a stock or index becomes overbought after going up too fast.
If a chart has an RSI divergence, then the chart’s relative strength index (RSI) has lower highs when the price is at a higher high, or the RSI makes higher lows when the price makes new lower lows. It’s an RSI divergence when RSI stops breaking out to higher highs during an uptrend in price or breaks down to lower lows during an uptrend.
A divergence signals that the current trend in the time frame on the chart has lost momentum. This is a possible signal and setup to bet on a reversal in the direction of the market price action. An RSI divergence indicates that the indicator does not agree with the price action.
Bullish Divergence RSI
A bullish RSI divergence pattern is defined on a chart when the price makes new lower lows, but the RSI technical indicator doesn’t make a new low simultaneously. This signals that bearish sentiment is losing momentum with the high probability that buyers are stepping in, and the market may be near the bottom of the chart’s time frame. In many instances, a bullish divergence can be the key indicator on a chart that signals the end of a downtrend and that the risk/reward ratio has shifted in the favor of the bulls.
Strong Bullish Divergence
Price makes a lower low, but the RSI indicator makes a higher low.
Medium Bullish Divergence
Price makes an equal low, but the RSI indicator makes a higher low.
Weak Bullish Divergence
Price makes a lower low, but the RSI indicator makes an equal low.
Hidden Bullish Divergence
Price makes a higher low, but the RSI indicator makes a lower low.
Bearish Divergence RSI
A bearish RSI divergence pattern is defined on a chart when prices make new higher highs, but the RSI technical indicator doesn’t make a new high simultaneously. This signals that bullish sentiment is losing momentum with the high probability that sellers are stepping in, and the market may be near the top of the chart’s time frame. In many instances, a bearish divergence can be the key indicator on a chart that signals the end of an uptrend and that the risk/reward ratio has shifted in the favor of the bears.
Strong Bearish Divergence
Price makes a higher high, but the RSI indicator makes a lower low.
Medium Bearish Divergence
Price makes an equal high, but the RSI indicator makes a lower high.
Weak Bearish Divergence
Price makes a higher high, but the RSI indicator makes an equal high.
Hidden Bearish Divergence
Price makes a lower high, but the RSI indicator makes a higher high.
RSI Divergence Strategy
The RSI divergence strategy is to buy the dip during a bullish RSI divergence or sell short near the end of an uptrend during a bearish RSI divergence. This can create one of the best risk/reward ratios when a long-term trend is losing momentum and about to reverse in the opposite direction. Of course, stop losses, and trailing stops must be used to manage the trade outcome to maximize the gain or minimize the loss.