Discretionary Fund Manager or DFM (di - ef - em)
We specialise in Managed Personal Share or ETF Portfolios (PSP), creating Low Cost, Globally available products
AI taking over SAAS / Software players...is it an over reaction, should we be piling into Defensives and dumping Software names?
What if they both traded on a Fwd PE of ~23x...which one would you prefer?
Missed our webinar this week? View it now for the insights of @ginsglobal, @jc_louw and Camissa Asset Management. 2026 Investment Outlook https://t.co/cVEkqMdKiF via @YouTube#investing
Will 2025’s strong returns continue in 2026? Join the Brenthurst Wealth webinar on 21 Jan at 16:00 for our 2026 #InvestmentOutlook with Magnus Heystek (Investment Strategist) and three fund managers:
• Anthony Ginsberg (HAN-Gins Global Megatech)
• Colin Adams (Camissa Alpha Equity)
• JC Louw (Custodian Global Equity & Balanced)
Don’t miss it. https://t.co/1ORWMau3Jt @BrenthurstSA@jc_louw@ginsglobal
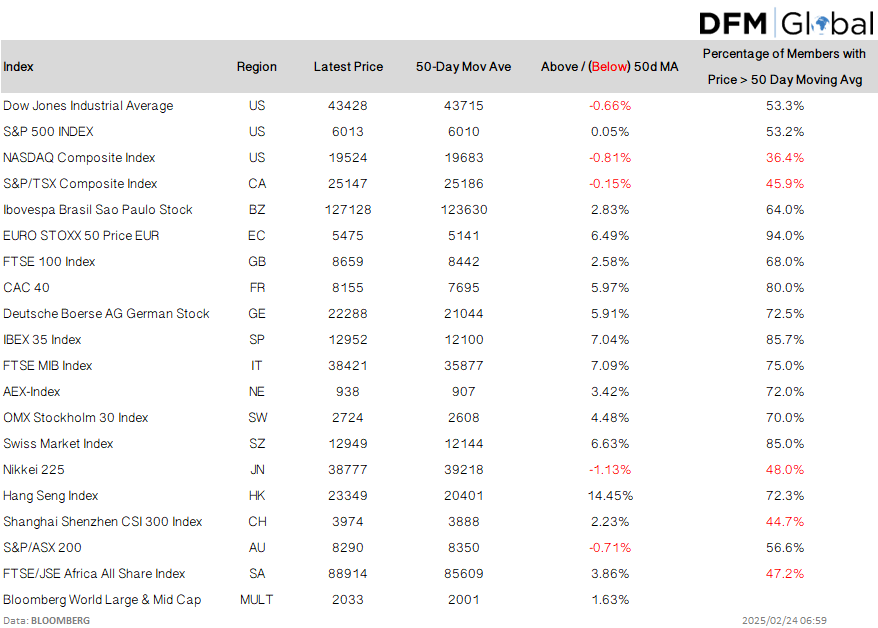
Major Equity Indices versus its own 50 Day Moving Averages (& Constituent Analysis)
50 Day Moving Average (DMA) Explanation:
If the index is above the 50DMA, it suggests an upward trend; momentum is strong, and investors may feel optimistic.
If the index is below the 50DMA, it signals a potential downtrend; investors may be more cautious.
If the index crosses above or below the 50DMA, it can indicate a shift in trend, signaling potential buying or selling opportunities.
How to read the "Percentage of Members with Price > 50 Day Moving Avg"
A high percentage of stocks above their 50DMA signals broad market strength and a healthy rally, while a low percentage indicates market weakness and potential trouble.
Data: BLOOMBERG & @DFMGlobal
Explanations: ChatGPT
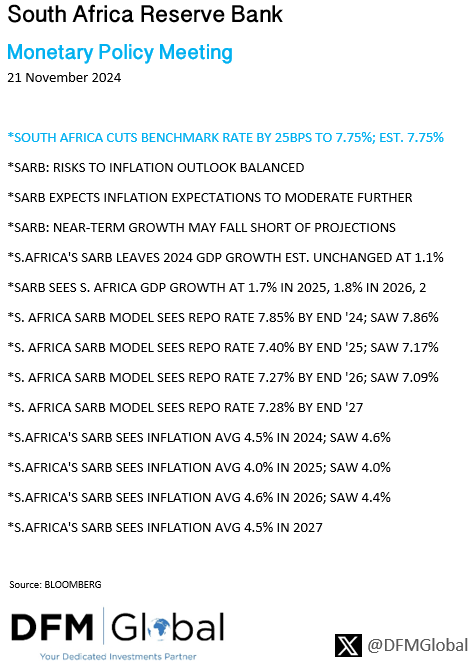
SARB MPC Meeting - Interest Rate Announcement
- REPO Rate CUT by 0.25% from 8.00% to 7.75%
- PRIME Overdraft Rate to change by 0.25% from 11.50% to 11.25%
This is IN LINE with expectations.
(Summary of the MPC meeting to follow below)
Using @ETFSA data, new Global #ETF adds of 279, FOR THE MONTH alone, is around 3-times the TOTAL number of #ETFs we have in SA!
Investing in ETFs is constantly improving with more options and lower costs every month, thanks to increased choice and competition!
#JSE#Investing
Globally Listed ETF Update: 30 September 2024
A very big number of ETFs added in Sep24!
- Another 279 new Global #ETFs were added in Sep24 alone
- There were 3,913 new ETFs listed since Dec21
- That's an average of 119 new #ETF listings PER MONTH since Dec21
Data by: BLOOMBERG
Globally Listed ETF Update: 30 August 2024
- Another 144 new Global #ETFs were added in Aug24
- Average of 114 new #ETF listings PER MONTH since Dec21
- There were 3,634 new ETFs listed since Dec21
Investment Product Alternatives continue to grow rapidly.
Data by: BLOOMBERG
Globally Listed ETF Update: 30 July 2024
- Another 188 new Global #ETFs were added in Jul2024
- Average of 113 new #ETF listings per month since Dec2021
- There were 3,490 new ETFs listed since Dec2021
Investment Product Alternatives continue to grow rapidly.
Data by:BLOOMBERG
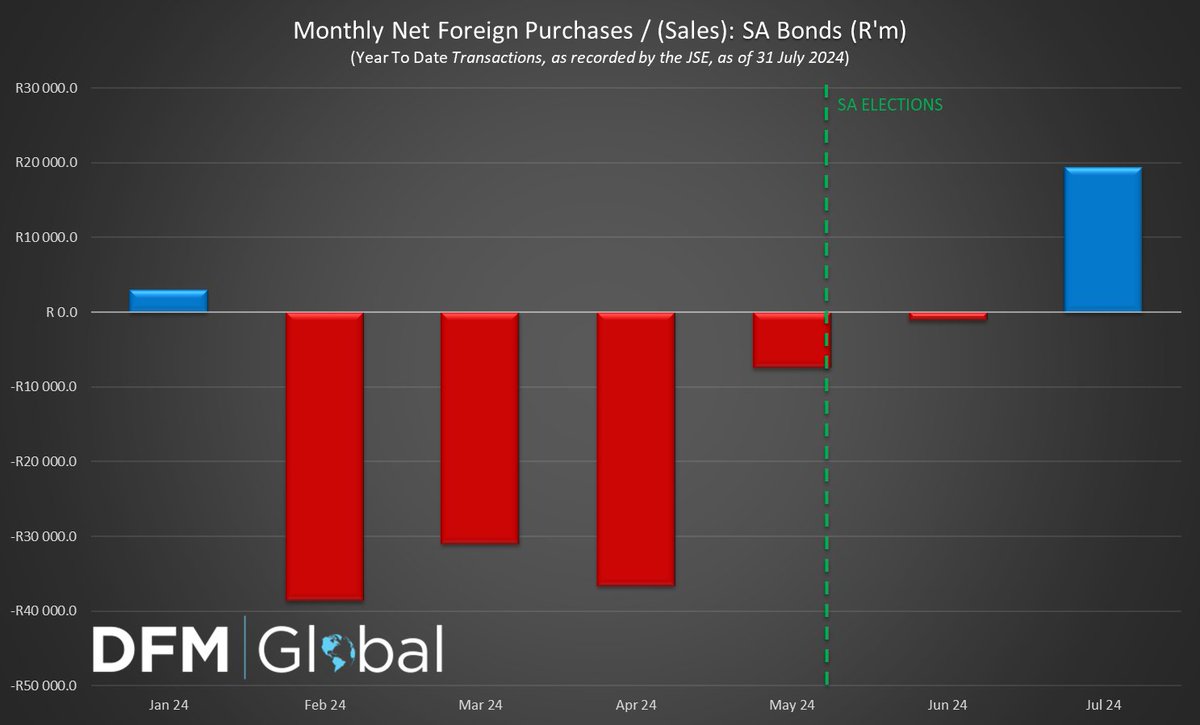
Updated SA Bond NET Foreign Purchases/(Sales) for 2024, as recorded by the JSE and reported by Bloomberg.
Strong change in trend since the Elections.
(BLOOMBERG & @DFMGlobal )
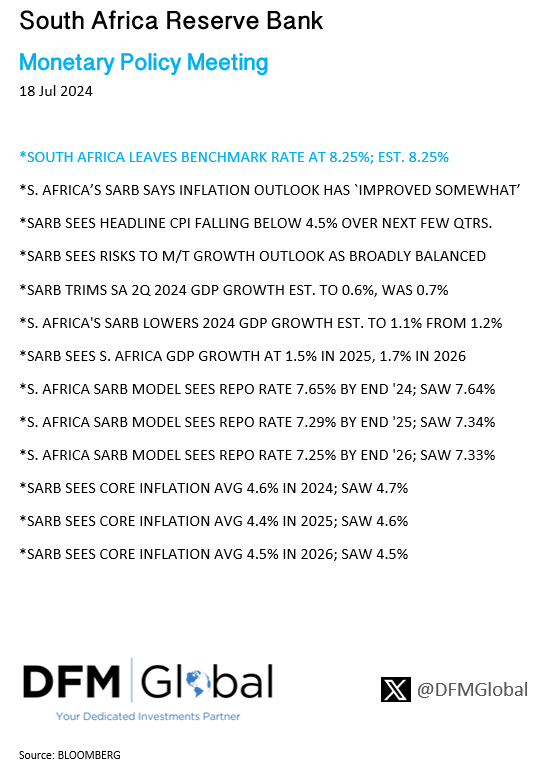
SARB MPC Meeting - Interest Rate Announcement
- REPO Rate was kept UNCHANGED at 8.25%
- PRIME Overdraft Rate to remain UNCHANGED at 11.75%
This is IN LINE with expectations.
(REPO and Meeting Summary Enclosed)
Since the SA Elections, the total Cumulative Foreign Transactions, using Net Purchase/(Sales) by Foreigners (BLUE Line), is still lower (meaning more sales) by around R1bn.
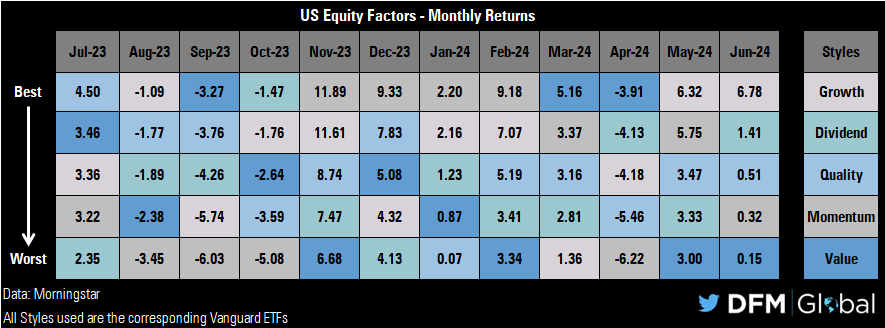
US FACTOR Return Monthly Analysis - 30Jun24
(using Vanguard #ETFs as Proxy)
Growth 2nd consecutive month in the lead. Unfortunately the same "consistency" (lagging) by the Value Style #ETF.
#Investing#PersonalSharePortfolio#PSP
#Boutique CEO: Consistently delivering average ‘transforms into #excellence’. ‘Leave your ego by the door. No one’s bigger than the market. If you think you’ll outperform the market, you’ll fail. Keep it #simple. Know your strengths.’ @jc_louw#fixedincome https://t.co/dKmI3LnrL7
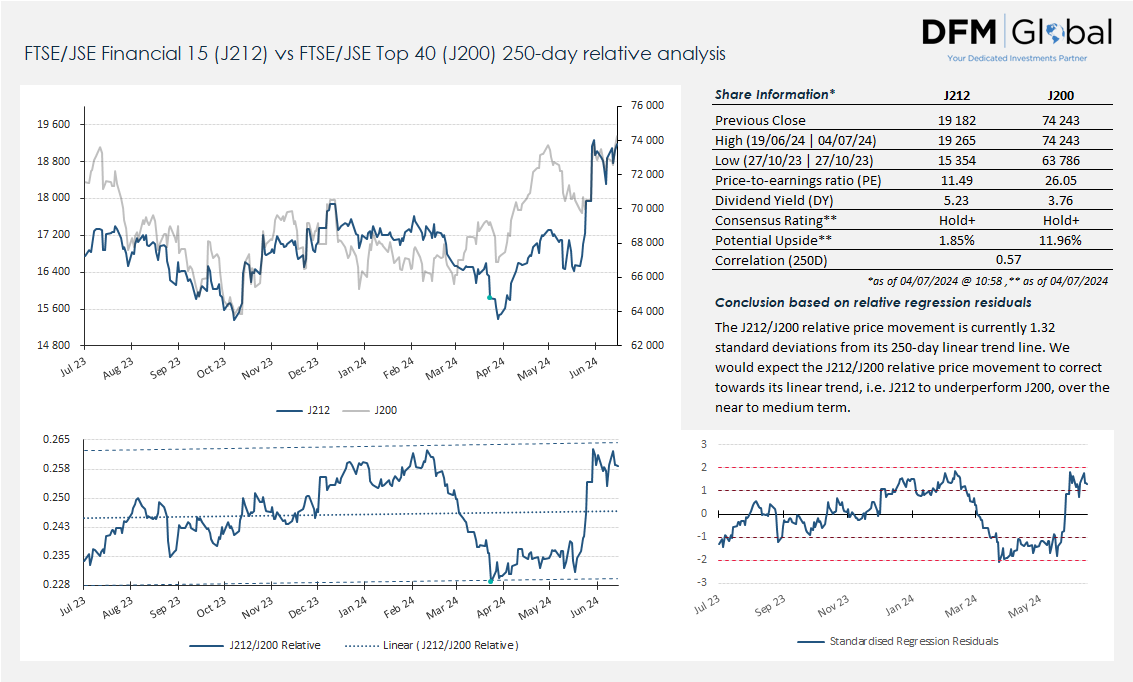
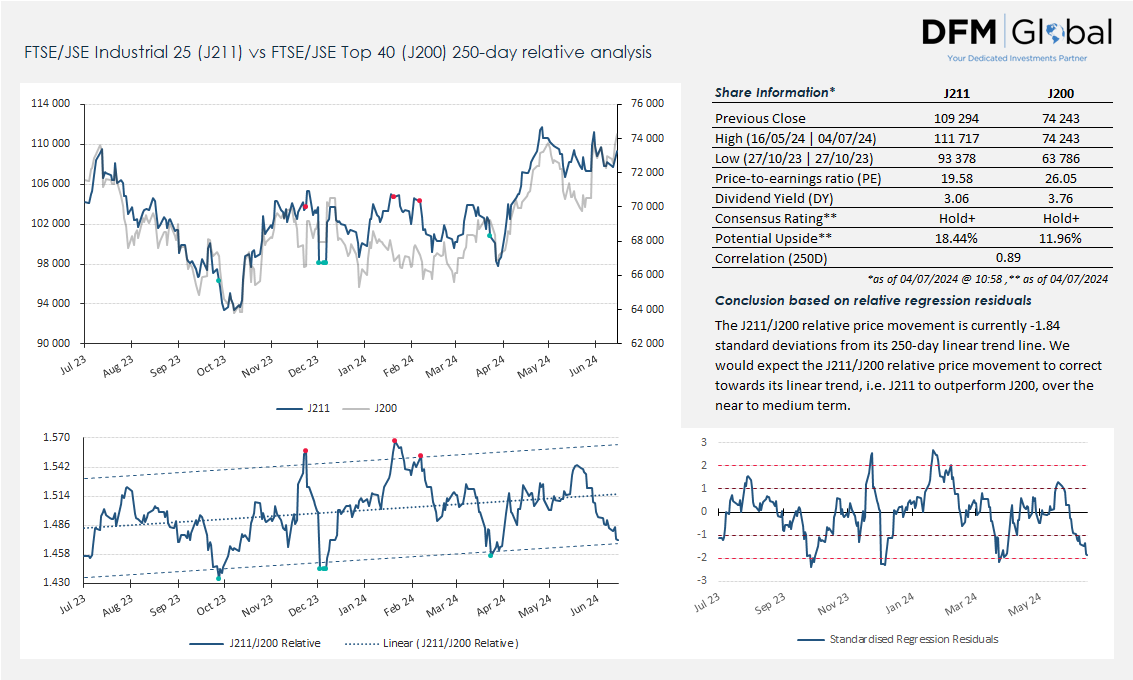
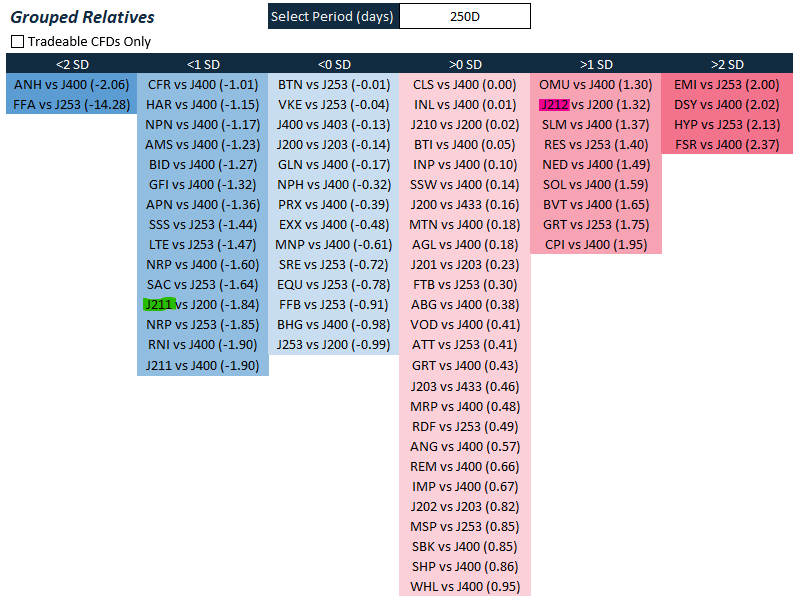
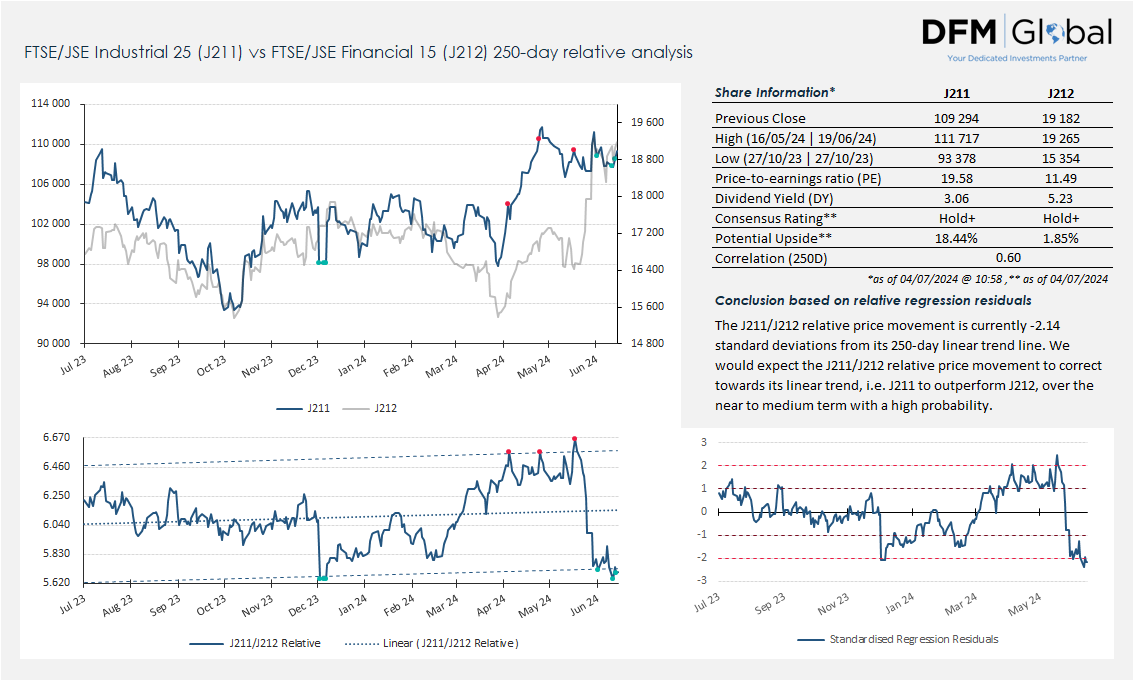
Looking at the few SA Equity RELATIVES:
1) Summary (showing overbought in mostly SA Inc names and oversold in mostly Dual/ZAR Hedge names)
2) Indi25 (J211) vs Top40 (J200)
3) Fini15 (J212) vs Top40 (J200)
4) Indi25 vs Fini15
Data: @DFMGlobal & Bloomberg


![CustodianDFM's tweet photo. #MSCI Emerging Market Region #ETFs
Year To Date [YTD] US$'m Flows as at 30June24
(Bloomberg) https://t.co/1OXooCvAUx](https://pbs.twimg.com/media/GRs7e5OWcAAVR7j.png)