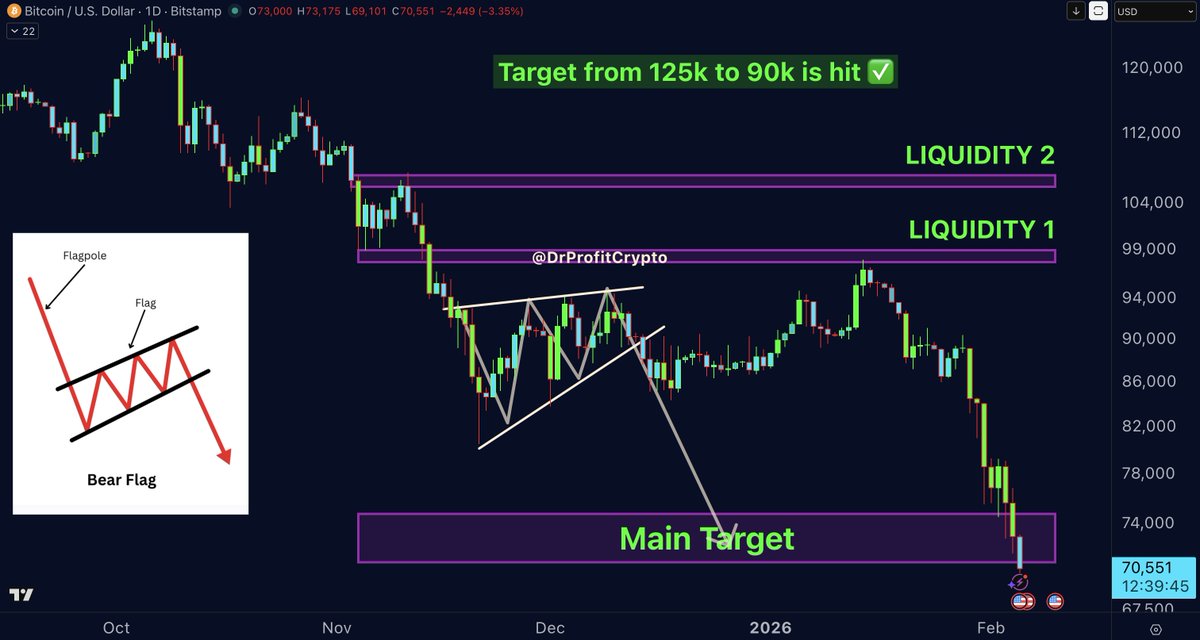
Not a single bottom in the history of #Bitcoin actually looked like a bottom but more like a fully broken structure like in 2015, or 2018.
Buying very big for the long term, I dont care for short term price movements. Iam ready to hold two or three years.
See you in 2024
People calling the #BTC bottom way too quick
Don’t be surprised by a sharp bullish trap
The sheep need another strong downside
I see ~200 more days of bear market ahead
Dont repeat the same mistake as in 2022!
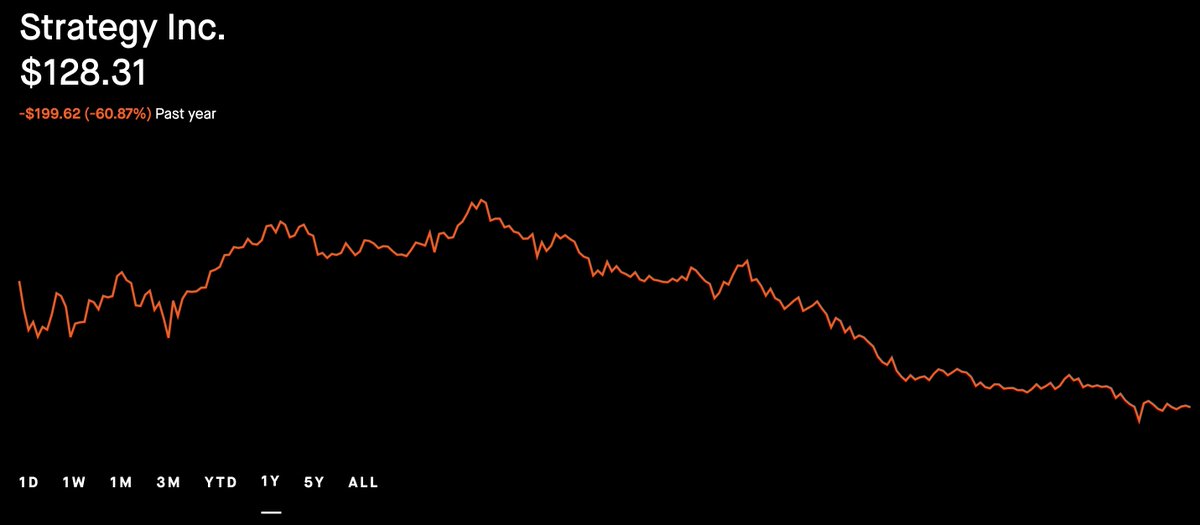
I warned @saylor many times that constantly buying Bitcoin nonstop and backing it with his own company shares is playing with fire. I tried to be a helpful friend, tried to help him see the risk, he decided to ignore and backfire on my warnings by calling my warnings nothing but crap, which is something I want to recall now:
Since those warnings, Strategy is down around 75% from its highs and Bitcoin dropped about 52% from its peak. His reported average BTC entry is around $76k and with BTC currently near $66k that puts the position roughly 13% below cost. Since they started buying in 2020, they never realized meaningful profits, never made serious strategic selling decisions, and since 2020 they are overall -13% in loss. Meanwhile their stock is in a non stop continued downside move and reached -75% so far. MSTR investors are suffering the volatility. Saylor was already one of the biggest losers of the dot-com bubble in 2000. I even told him that with the current AI bubble he risks repeating history in 2026. Instead of reducing exposure, he doubled down and kept buying more BTC while ignoring warning signs. I truly wish MSTR and Saylor the best, but I cannot understand how reckless this trading approach is in such a late-cycle environment. Markets reward discipline, not blind believe in Bitcoin. There is always time to buy and time to sell. I hope he will listen next time instead of mocking my warnings.
Best regards, DrProfit.
#Bitcoin – Special Weekly Report:
The Big Sunday Report: All We Need to Know
🚩 TA / LCA / Psychological Breakdown: Bitcoin is currently in Stage 4 out of 6 in the current bear market: These six stages are my own framework, developed through direct observation of every major Bitcoin bull and bear market so far. The structure repeats because the underlying drivers repeat: liquidity mechanics, leverage positioning, and predictable human behavior under stress and current panic.
Stage 1: Euphoric market and insane buying appetite:
This is what happened between 115k and 125k. The first stage mainly ends with extended sideways movement at euphoric levels, often biased in one direction, or with sudden spikes to the upside after a long consolidation despite extreme bullish sentiment. On the surface, everything looks strong, but in reality the market is overloaded and overleveraged, with late entrants who believe risk has disappeared. Insane price predictions happen here, and people reach the highest level of greed.
Stage 2: Breakdown of a highly important psychological level:
This stage begins once we drop below an important psychological mark, which in this cycle was 100k. The psychological level is extremely important because its loss stresses short-term investors and flushes out leverage traders, giving them the first warning signs that their euphoric dream from Stage 1 is over. The speed of the second move is noticeable and intentional. It happens very quickly and does not allow investors to rethink, recalculate, or properly manage their positions. The market acts before they can react. It front-runs them, and many lose control here. The best example was the fast crash on the 10th of October, which caused the largest liquidation event in crypto history. It happened within a few hours.
Stage 3: The fastest and most brutal move + bear market confirmation:
After Stage 2, the market needs to move even faster. Market makers cannot allow retail to realize what is happening; the speed needs to be maintained, so an even more brutal downside move follows. Stage 3 is the fastest of all phases and fully confirms the bear market with an extreme and rapid downside move, typically exceeding a 50% drawdown from the all-time high, which has been the case. In this scenario, investors are in deep depression and strong panic. They had no time to recalculate, hedge correctly, or reduce leverage. They are sitting on losses they never prepared for. I consider Stage 3 the most brutal phase of a bear market. It happens very fast and removes reaction time. The move from 97k in January to 60k in February, a crash of 50% within only 30 days, reflects that brutality. Many have not realized that nearly 50% of BTC’s market cap was wiped out within 30 days. The most violent mechanical repricing is likely behind us, and we have now entered Stage 4, which brings retail into psychological torture.
Stage 4: Dehydration, depression, and perfect liquidity creation:
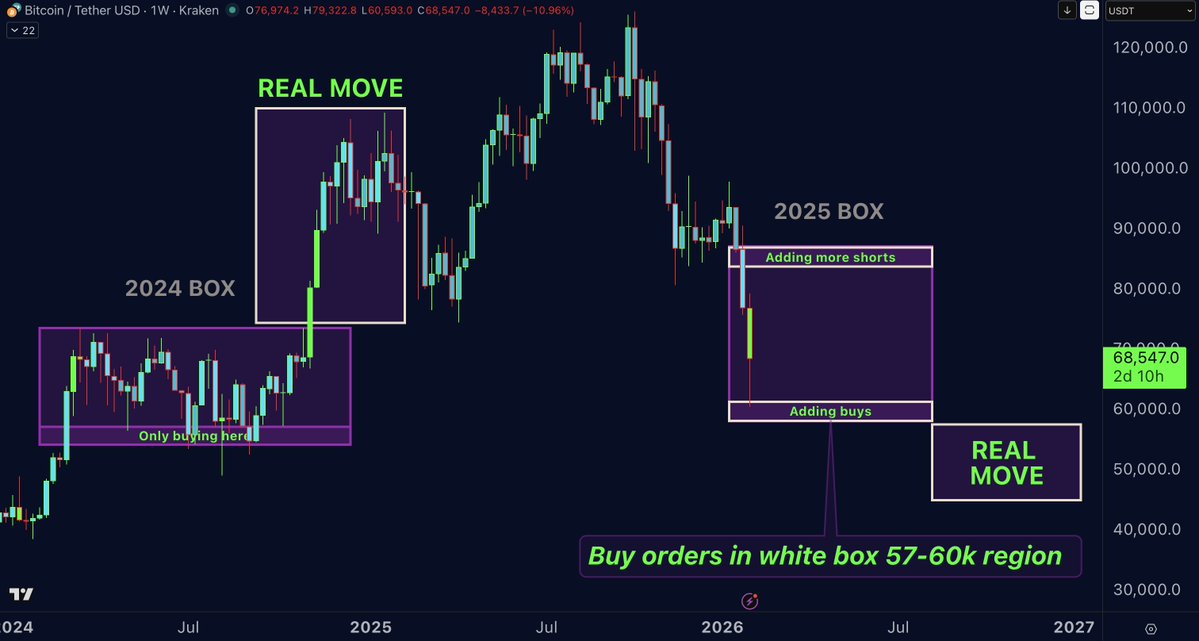
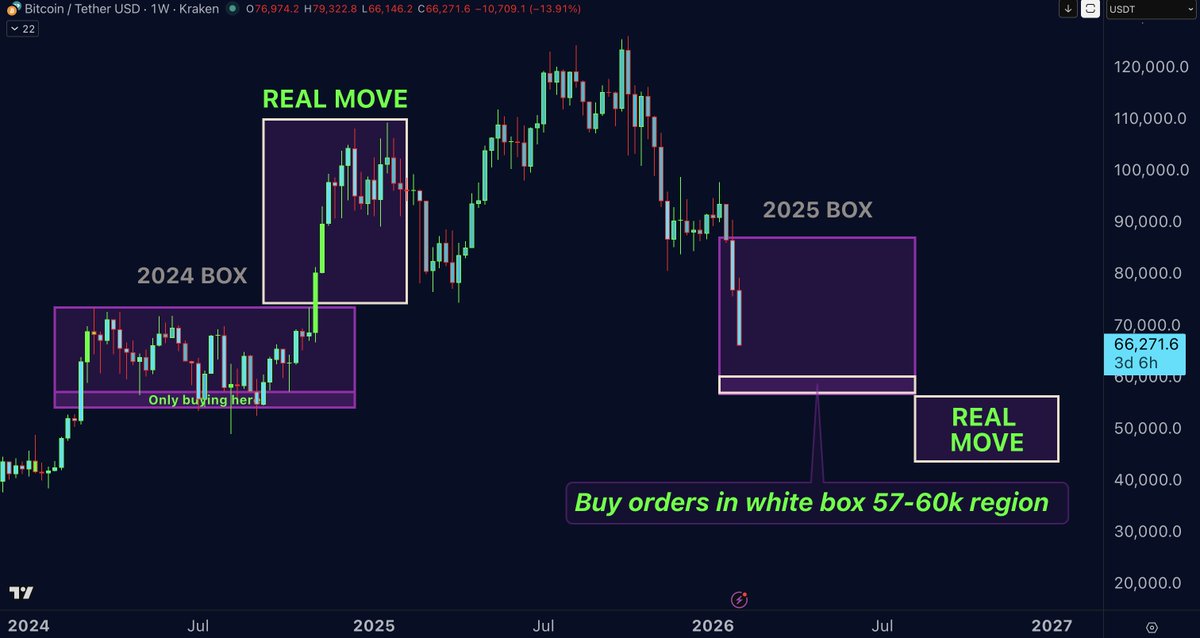
This is where we are now. Stage 4 is not very violent or volatile, but it is extremely exhausting. The price moves sideways for a long period, often several months, within its own defined region. This is why I defined the current sideways structure and drew the “box,” showing clear upside and downside boundaries. You could also describe this as a weak-hands selling zone. A sideways move allows market makers to generate liquidity on both the upside and downside by trapping breakout traders and breakdown sellers. Sideways does not mean nothing is happening in the market, that is what retail sees when markets move sideways for a long time, but the message is much bigger. It means the market is preparing to exhaust participants fully while creating a large cluster of liquidity below the current zone, an area defined as the future capitulation region. This phase creates dehydration, frustration, regret, and anxiety. Retail traders start saying, “Bitcoin will drop another 30–40%; it’s better to sell here.” Many think the same way. Most short-term holder capitulation happens in Stage 4. Retail traders exit here because they missed selling in Stage 1, failed to sell in Stage 2, and had no time to react in Stage 3. Now they sell at a loss, as on-chain data confirms. Based on the data I see, the breakdown below the box that will bring us into Stage 5 is more likely to happen in a few months, not in the coming weeks. For the short term, I have placed buy orders between 57–60k within the current sideways structure and expect a bounce in the short to mid term. This does not change my broader outlook of lower targets.
Stage 5: Total fear, drama, and capitulation:
This is the true capitulation phase. It is not always the fastest move, but it is the most emotional one. Fear turns into panic, and panic turns into forced selling, even among experienced long-term holders. This stage is often connected with the collapse of a large player, an exchange failure, or a black swan event. It is remarkable to see panic selling after an asset is already down 50–70% from its all-time high, yet this phenomenon repeats every cycle. Originally, I projected the bottom between 50–60k when BTC was trading at 120k. In January, I adjusted this to 40–50k. With current macro data and visible stress in global markets, including the REPO and liquidity markets, I now consider 35–45k as the ultimate bottom scenario. That implies another significant downside from current levels, where the final capitulation is likely to play out.
Stage 6: Stabilization and structural reversal:
This final stage is a mix of total fear, volatility, and continued sideways movement. Selling pressure gradually disappears, and the market begins building the foundation for the next bullish cycle. Structurally, market makers prepare for recovery. This is the moment when large players begin accumulating heavily during capitulation, while retail investors scream for lower and lower prices, calling for extreme targets such as 10k or below. Retail becomes greedy again for lower prices and ultimately misses the bottom, a perfect repeat of every cycle in which retail investors buy high and sell low.
Right now, we are in Stage 4. The worst in terms of high-speed mechanical downside is likely behind us, but the real psychological damage phase has just begun. Regret increases. People rethink their decisions. They calculate exit plans that come too late. This is the reason why we have seen the largest short-term holder capitulation in the last few days. The key lesson remains simple: never let the market trade you; you trade the market. When price moves fast, reaction time disappears. When price moves slowly, discipline disappears. Understanding these stages allows you to operate structurally rather than emotionally. My heavy accumulation will begin between Stage 5 and Stage 6, not before. This pattern has repeated across every Bitcoin cycle so far. Human behavior is an architecture repeating under different market conditions, but the architecture itself always remains the same.
Join Premium: https://t.co/oSzGvO03RF
Join Free TG channel: https://t.co/zkdgaR6H3c
THIS IS NO FINANCIAL ADVICE AND EDUCATIONAL CONTENT ONLY
People are losing money in #Bitcoin, down 50% from its ATH against the inflationary USD. It’s bad to lose money, but it’s even worse to lose it in terms of USD. At the same time, GOLD is 10% away from ATH. This is why 2026 is the year of metals
The bottom for #Bitcoin is not in, and we will see lower and lower prices in the coming months! For now, we are sitting inside of the sideway box I explained in the Sunday report. My ultimate bottom target is somewhere in the region of the 40s, expect it to hit in Sept-Oct
#Bitcoin – What’s Next?
The Big Sunday Report: All We Need to Know
🚩 TA / LCA / Psychological Breakdown: Psychological Breakdown
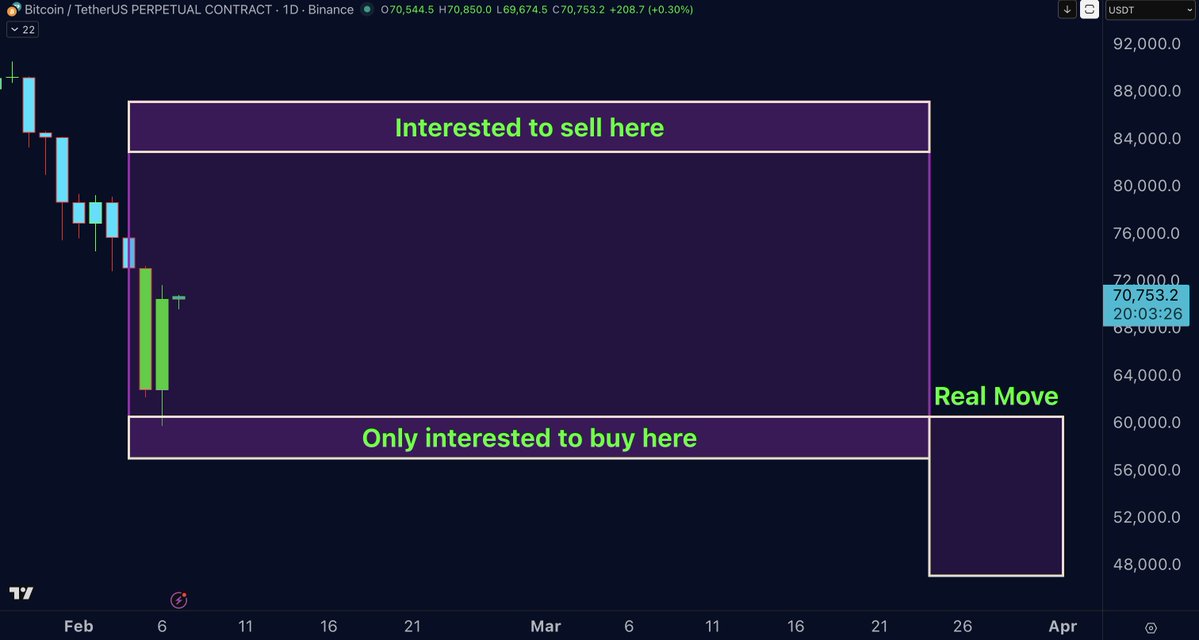
In last week’s Sunday report at 78k, I made it very clear that a new box is forming. I expect Bitcoin to move sideways between 57k and 87k, a 33% range, as already stated. This sideways phase is not bullish, it is the preparation for whats coming in the next months. I expect a leg down after this phase, with a breakdown from the box toward lower targets in the coming weeks or months of 44-50k region.
One year ago, in 2024, Bitcoin spent an entire year moving inside a box between 58k and 74k. At that time, I repeatedly explained that this box had three main purposes. The most important one was the drawing of future reference lines for the next bear market. I said many times that the 2024 box would play a key role again during the 2026 bear market, in the same price areas. That is exactly what is happening now. Bitcoin is currently trading in a zone where it previously consolidated for an entire year before breaking higher toward 100k. In a bear market context, this same zone is not support, it is structure, and structure eventually breaks. Once the sideways phase is complete, I expect a breakdown below the box.
Current Plan and Range Logic
I am expecting a large sideways movement between 57k and 87k. My clear intention is to buy between 57k and 60k, which is the bottom of the current box. It is critical to understand that the bottom of the box does not mean the final bottom for Bitcoin. It means the bottom of the current phase. I buy 57k–60k for percentage gains, not for the long term plan as I usually do. As an example, Bitcoin is already up roughly 16% from the 60k buy entry I shared a few days ago.
Does this mean 87k is a guaranteed target? No. It means two simple things. First, Bitcoin between 57k and 60k is in a recovery and bounce phase, which usually includes sideways action. Second, the highest level I expect Bitcoin could reach during this phase is around 87k, depending on the strength and duration of the sideways market. If the market allows a visit to the 87k area, I am open to adding more to my existing shorts that were opened between 115k and 125k and are still fully held.
Positioning and Execution
Some people like to complicate things. From my perspective, it is very simple. I am holding shorts from 115k–125k. At the same time, I placed multiple spot buy orders between 57k and 60k. Some of these orders were triggered around 60k and are already up around 16%. I plan to hold these gains because I expect continued sideways action and no immediate further downside in the coming weeks. I consider 57k–60k the local bottom, not the macro bottom, and I expect this area to be tested multiple times. That is exactly why buying there makes sense to me. There is no reason to sell while upside potential remains. When the moment to sell comes, I will metion once I sold or planning to sell. Bitcoin will move sideways until it no longer does. The largest and most aggressive long-term bets will be placed much lower, between the 50k level and into the low 40s. That is where I will re-enter with serious size for the next cycle, while taking profits from the 115k–125k short, and thats the area I believe Bitcoin will be finally bottomed out. This area is expected to be hit in September-October as my calculations show, in the meantime? A long and boring sideway as mentioned above.
Why I am Buying Now in a Bear Market
Some ask why I am buying now if I expect Bitcoin to eventually bottom around 54k–44k. The answer is simple: markets do not move in straight lines. Even in bear markets, there are powerful counter-trend rallies. In 2022, Bitcoin dropped from 68k to 33k almost without pause. Then, within two months, it rallied from 33k to 48.5k, a 50% move, before continuing down to the final bottom at 16k. This is how markets work.
We are in a bear market. The bounces are temporary and exist to build liquidity for further downside. My ultimate bear market target remains below 50k, in the 40s area. That is where my largest positions will be built. Until then, my short from 115k–125k remains fully open. I am not longing with leverage. I am buying spot between 57k and 60k while keeping the short open.
Join premium here: https://t.co/TvHxOtKhHj
THIS IS NO FINANCIAL ADVICE AND EDUCATIONAL CONTENT ONLY
#Bitcoin: Triggers the buy order I have placed yesterday at $60,000 with perfection and is up +15% since then. Remained buy orders remain active at the bottom of the box. I expect a sideway move before continue lower, more than happy to grab the percentage gain here
Message for 99% of analysts on X
Please apologize for your Followers
You called for altseason and strong Q4
You led them straight into slaughter
Dont act as if you saw this coming
Apologize and you will earn my respect
In 2021 I called the top at $68,000
In 2021 I called for 18k at $68,000
At 18k I called for 100-120k in 2022
In 2025 I called for the top at 120k
At 120k I called for the target of 60k
Say something my friends..
#Bitcoin - Preparing buy orders
Already in 2024, I said that the box plays a central role during bull market phases. At the same time the box is created, it is designed and drawn forward-looking by the market makers, with a clear view toward 2026. The purpose of the box is the creation of renewable liquidity, which is needed for every cycle, whether bull or bear. The new box spans 33%, from 87k down to 57k. For some, this may sound large, but in 2024 Bitcoin moved for an entire year within a 27% range. It’s not important to understand the range but to understand its borders and move at the outskirts of the trades, not within.
The direction of the lines is irrelevant. These support zones are purely imaginary, designed to trigger breakouts above and below renewable liquidity, allowing both major clusters to be hit over the cycle.
In other words:
Placing buy orders between: 57–60k: BIG BUY, planning to hold for 2–3 months if market allows to visit, not interested to buy higher than that! I consider 57-60k as great entry to make money for the short term and gain some serious % before we continue going down. Because of this, I keep my Bitcoin short from 115-125k fully open! The markets remain very bearish and we are in front of the great financial crisis I have spoken about in September 2025! Keeping the trade short term only as its playing with fire, but risk reward looks worth it from my perspective. My orders are set!
The great financial crisis is right in front of us, everything I warned about in September last year is happening right now! The great financial system is being replaced with the 5th Industrial Revolution. Adapt or stay poor!
THE BIG SHORT – OVERVIEW
This overview shows ALL Big Short trades taken so far. Nothing is hidden. The list includes every single position, whether it is still open or already closed via stop loss, whether shared in public or in the premium membership only. In total, the Big Short consists of 14 trades. Out of those, 9 trades are currently in profit, while 5 trades are in small to medium drawdown.
Overall performance is very strong. Some positions delivered exceptional returns, such as +240% on the MicroStrategy short, +215% on Coinbase, +150% on Palantir, and +170% on Bitcoin.
The losing trades are limited and well controlled, especially when compared to the size of the winning trades. This is exactly how a strong short strategy is supposed to work: small losses, big wins. Keeping the shorts on stock open!
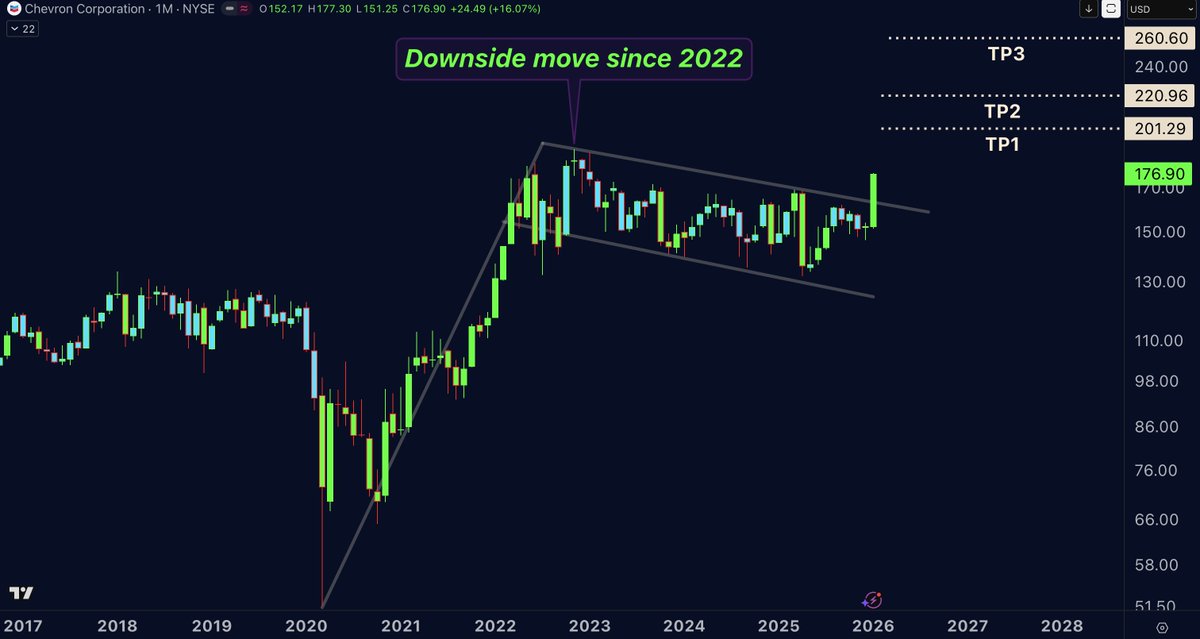
$CVX (Chevron Corporation Stock):
Since 2022, this stock has been trading in a sideways accumulation range, not a normal range, but one forming a gigantic bull flag. This bull flag broke out this week. All eyes are now on this stock. I have bought some. High potential to turn into a golden stock in the coming weeks. Let’s see where the party goes. Mid-risk trade, no financial advice. Despite my very bearish stance, there are still some stocks that can perform for many reasons this is one of them. I bought it.
This signal was shared in Premium a week ago at $166. It is already up 7% since I bought and shared it with Premium members. Whoever is not in premium is and will always regret!
#Bitcoin is dumping hard again, total down 38% from ATH, following the exact pattern of my prediction and the perfect call to big short the exact top by calling it by definition the END of the bull market in September. I was ahead of time, now you understand
#SILVER - WHAT HAPPENED TODAY?
The reason for the sharp fall was nothing more than extreme sized short positions that entered the futures market, pressuring the price down sharply. Coming to this conclusion is pretty simple by watching the futures volume, but to verify further its important to watch, and I noticed some very interesting pattern, the pattern that confirms my thesis that some shorts needed an exit. And it was given to them today in both markets, Shanghai and COMEX:
What exactly happened today? As per Shanghai, I did not see large physical silver withdrawals worth mentioning, meaning no physical silver changed hands during today’s downside move. So what happened?
First, the silver price was heavily pressured down by empty paper shorts. Even in Shanghai, the futures market is backed by paper rather than physical, something many tend to miss. SGE1!, however, is 100% backed by physical silver bars. However, NON PHYSICAL silver did change hands today: (531 tonnes) of silver contracts were traded in Shanghai. This reflects short positions being closed and transferred to new long holders, with buyers stepping in as sellers exited their shorts at lower prices 10-15% below daily open. No physical silver left vaults today, this is not a bearish sign at all. This was a paper / spot-deferred position transfer, not a physical delivery many would fear.
Again, this is active movement in the derivative market. So the structure of what happened was: first, heavy paper pressure, second, shorts used the drop to exit, third, buyers absorbed everything, and fourth very important: no confirmed physical liquidation. In my opinion, what happened today was a paper-driven shakeout with continued accumulation. The COMEX data is always published one business day later, so expect the data on Monday, while we have Shanghai report already and it speaks a clear language.
Also, it is very interesting timing to see the same manipulation repeatedly happening at month-end, just like last month on December 31, when silver dropped around 15% in one day before continuing its run. Guess what happened on that same day as well: the Standing Repo handed out record amounts of USD to banks. Again, guess what those banks are actively involved in heavy silver shorts. The data is public for everyone to see on FRED and CME. There is a strong relationship between end-of-month lending for balance-sheet purposes and the ability to enter large-sized price suppressions at month-end. This pattern is very obvious and aligns with my theory that banks are in extreme and serious trouble, not only because of tight liquidity, but because the next risk is coming from Silver. One of the major reasons for the expected financial crisis and stock market crash I am predicting and shorting since several months with great profits on several trades posted such as PLTR, NFLX, MSFT, COIN, MSTR and many more, open since several months already.. (Only posted in premium: https://t.co/TvHxOtJJRL)
Nothing changes the fact that physical silver remains very bullish and highly demanded. I am not willing to sell at $85, and I don’t know anyone who is willing to sell their rare metal at such a price. Monday will be a very interesting day for many reasons. The U.S. market closed at $84, while Shanghai closed near $122. We are talking about a historic gap of 44%. On Monday, dealers around the world will need to decide at what price they are willing to sell physical ounces. Let me remind you that physical silver was sold at $120–$130 in recent weeks, reaching $150 in Tokyo as well, and it is sold out at most dealers, so why should the dealers lower their prices if demand remains same or even higher?
Shanghai and COMEX needed a safe exit from their short positions and thats what its all about, and I believe the coming weeks will show us why. This brings me to the conclusion: the purpose of this move was clear, the market understands that silver is in a strong bull run and shorts have started to capitulate. I remain very bullish, as I was at $20. We hit my target of $100, and I personally expect $130-150 in a matter of time.
Reference for above data provided by Shanghai market: https://t.co/BGUqL1o27Z)
THIS IS NO FINANCIAL ADVICE AND EDUCATIONAL CONTENT ONLY
$SILVER: Strong manipulation today, caused by extreme sized short bids, same repeat as last monthly close! Save this! On Monday, the FED will reveal record Standing Repo usage for today!
Screenshot this!