The 2024 #bullrun has already started. The most retarded will earn the most.
In the last 1 month, I made over $1,50,000:
$POPCAT
$ANALOS
$SILLY
$PENG
$WIF
#Bitcoin
$RBT
$PONKE...
FOLLOW to get more chances.
Quiz. FTMO 1-Step, $100K.
Balance at midnight: $102,000. Max Daily Loss: 3% of the initial $100K. You're +$1,500 open right now.
How far can your equity fall from here before the breach?
$3,000, $4,500, or $1,500? Answer tomorrow in the replies.
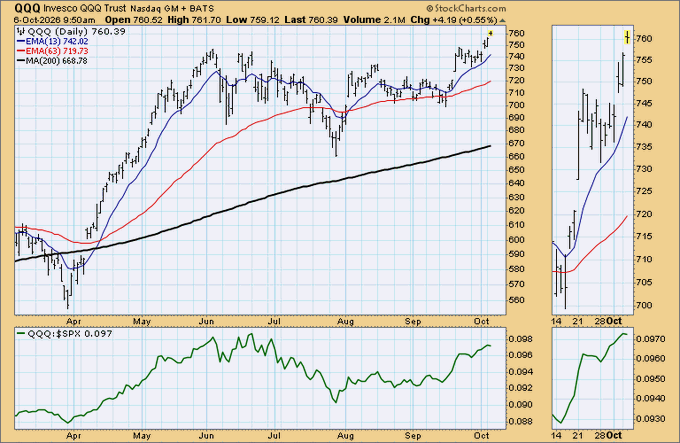
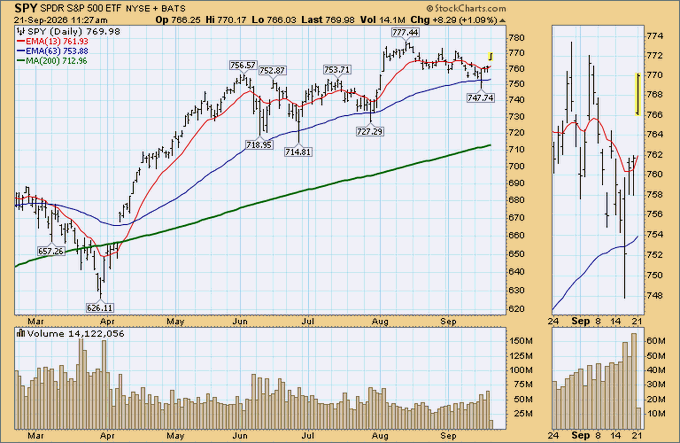
SPY would have to decline to 776.50 and QQQ to 756.92 to fill this morning’s gaps. Friday’s gaps, 765.65 in SPY and 744.67 in QQQ, remain open. Unfilled gaps at new highs are quite rare.
The cheaper FTMO is the expensive one.
1-Step $463: FTMO keeps all of it.
2-Step $499: you get all of it back with your first payout.
Pass both and the 1-Step cost you $463 more. Price tags lie about cost.
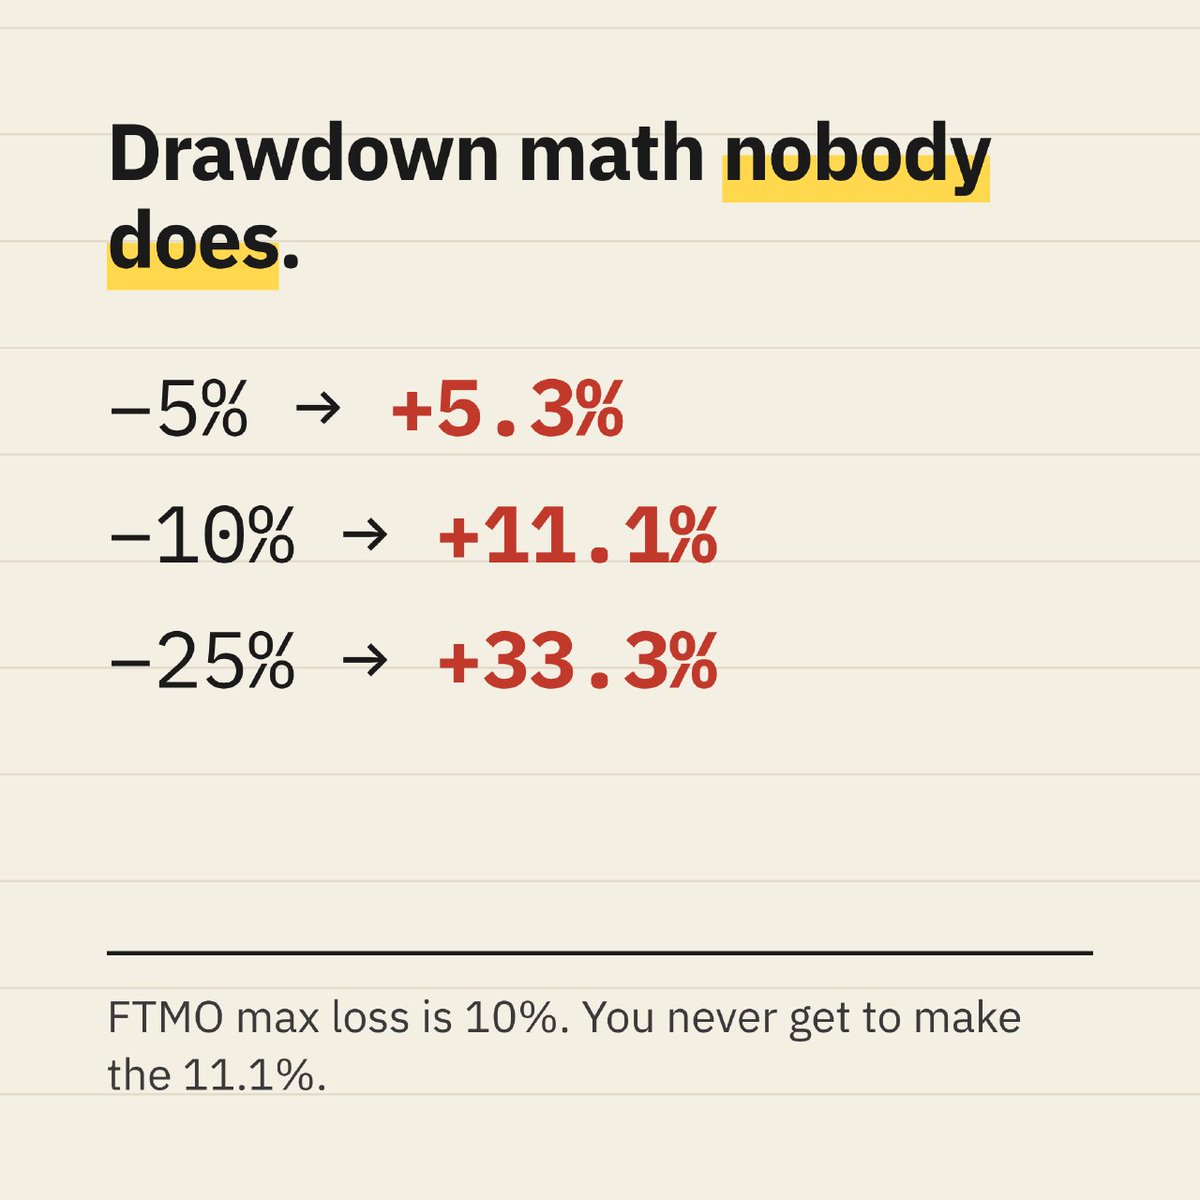
Down 5%, you need +5.3% to get back.
Down 10%, +11.1%.
Down 25%, +33.3%.
FTMO's max loss is 10%. The rule isn't about the 10% you can lose. It's about the 11.1% you never get to make, because the account is closed first.
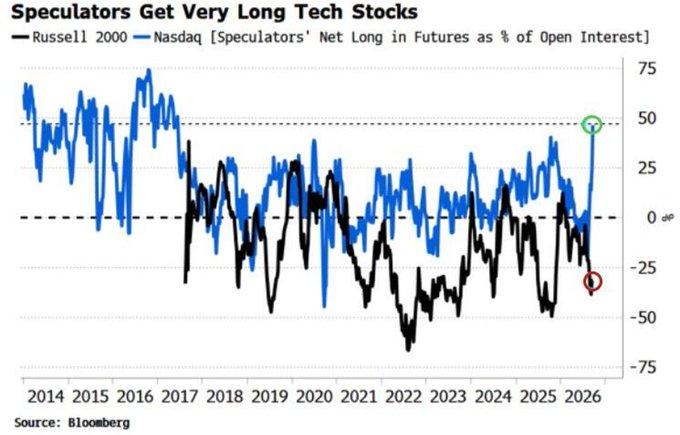
Nasdaq futures flipped from net short to nearly 50% speculative net long open interest, a roughly nine-year high, after staying below 25% for most of 2021–2025. This shows a positioning reversal, not a standalone trend signal. The risk is more volatility if crowded longs unwind.
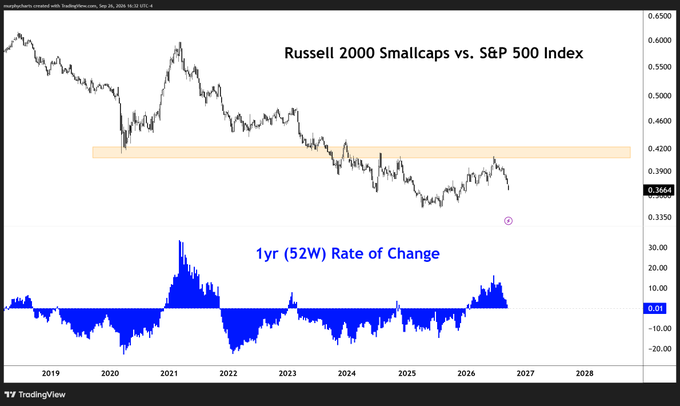
RUT vs SPX 52-week ROC is about to flip negative. MurphyCharts says that has not favored small-caps over large-caps over the next 12 months. It is a relative-performance warning, not an absolute Russell call. Watch the ROC print below zero.
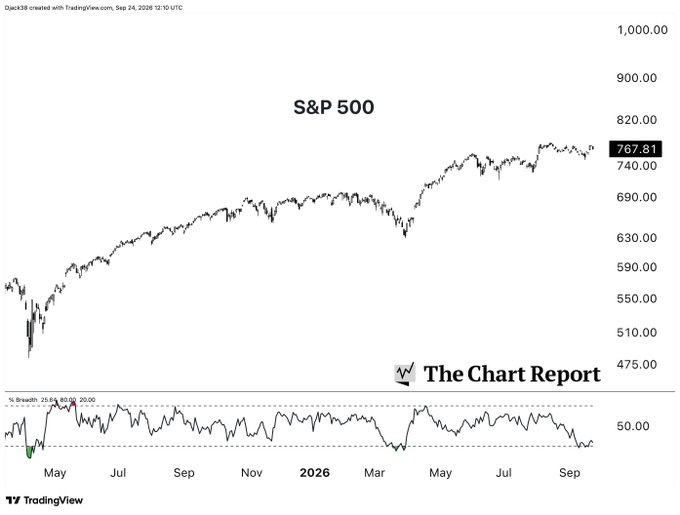
S&P 500 stocks above the 20-day MA fell below 30%, first since March pressure. That is internals: fewer names participate. Thin breadth is how support thins. Watch if that share stays this low, not a one-print timing signal.
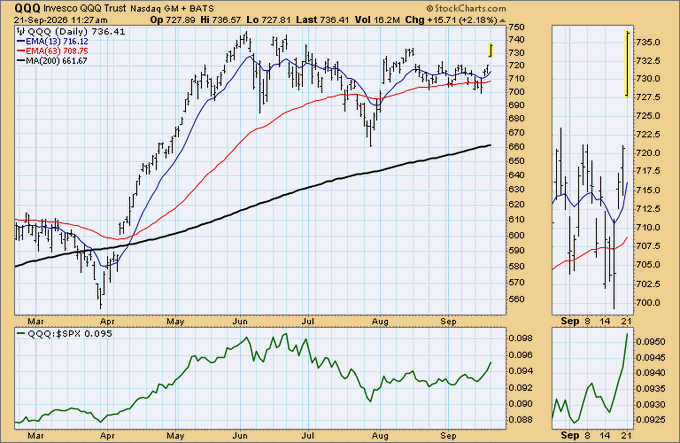
QQQ opened large gaps this morning. Filling them requires a decline to 762.00 and 720.98, and QQQ left a huge island. The tell is how fast those gaps fill, if at all. Until those levels print, the island stays untested structure.
Bitcoin’s Bollinger Band width is 4.81%, showing renewed compression after August’s short squeeze. The range is tighter, but neither side has a clear edge. Execution should hinge on defined breakout confirmation and key levels, not a directional guess.
The 10-year Treasury yield nearing 5% is a warning sign for stocks, but not a standalone sell signal. It last touched that level in October 2023; the more important question is what is driving yields higher.
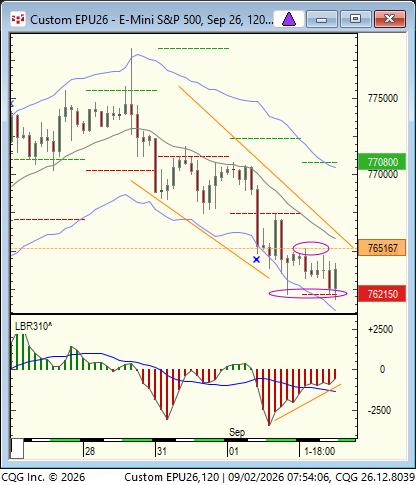
Linda Raschke’s SP setup is conditional, not a forecast: the short idea needs a rally above 7651.50 that fails back below it. An early drop is only a scalp; treating it as a trend trade changes the risk.
https://t.co/PiyQ37fQnA
SP structure: Down-trending channel intact, Short term support on text of previous day's low after three days high to low. A morning rally above 7651.50 will setup a short sale. (Any morning down is a Buy for a scalp only)
Costco $COST has dipped below its 100-week EMA only five times in eight years. That rarity makes this a structural stress test, not routine noise. The key test is whether Costco reclaims the 100-week EMA or keeps closing below it weekly.
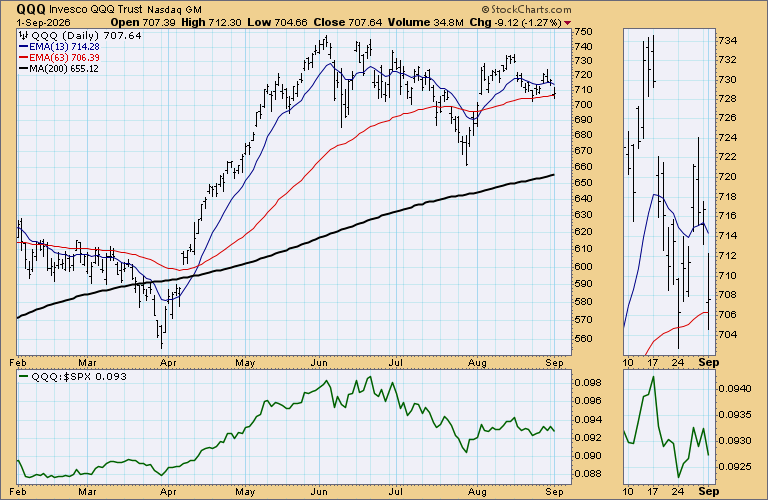
SPY needs 760.94 and QQQ 714.62 to fill this morning’s gaps. The key signal is the pace—or failure—of the fill, not the levels alone. QQQ’s failure to print 729.27 last month shows gaps can persist, so trend strength is tested by follow-through.
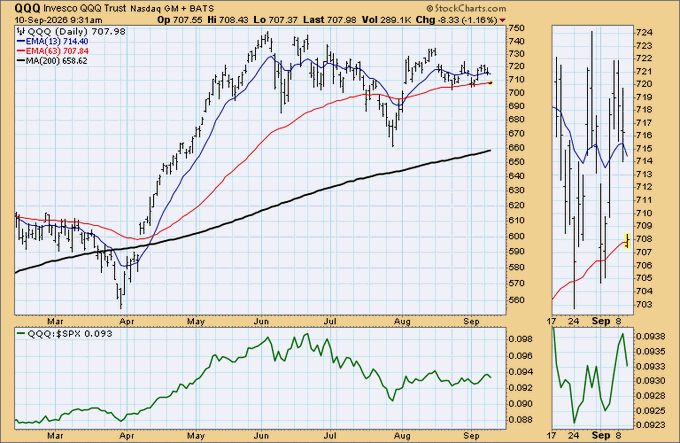
Phil D. Gapp is tracking three unfilled $QQQ gaps at 713.16, 729.27 and 701.59. For traders watching market structure, the speed or failure of these fills remains a concrete clue on whether the recent move has conviction or is likely to reverse.
https://t.co/GX3dXFIpxs
Famed market analyst Phil D. Gapp is keeping an eye on three as-yet unfilled $QQQ gaps : Yesterday's downside gap at 713.16, the August 18th downside gap at 729.27, and the month-ago upside gap at 701.59. As always, how quickly the gaps get filled -- if at all – gives us an idea of how strong the underlying trend is.