NYC isn't just about Broadway and the Big Apple—it's also home to the largest observability and AI event. At #DASH2026, we introduced new product innovations to help teams scale, stay ahead, and conquer cloud complexity with autonomous operations.
Watch the full video: https://t.co/jMXfQ7VymK
#DASH2026 showcased what's next for observability, security, and AI, including more than 170 new Datadog products and features. Catch up on the keynote announcements, AI innovations, customer stories, and special sessions that shaped this year's event: https://t.co/IQMUGNGi8Z
In his latest walkthrough, @OliverKorzen, from @ThisWeeknAI, calls Lapdog one of his favorite @datadoghq features (and it's free).
Watch your coding agent in real time, track prompts, tool calls, file changes, and costs across every session.
Catch the full Agent Observability walkthrough on YouTube 👉 https://t.co/eP6ZNZVBOv
What were attendees talking about at #DASH2026?
We hit the expo floor and asked what they're bringing back to their organizations, and let's just say AI and observability made more than a few appearances. 😉
"AI agents don't just get better, they get better at some things - and worse at others. That's why we built experiment visualization" - Sr. Staff Engineer, Michael Bevilacqua-Linn
Instead of digging through charts, this new Agent Observability view makes it obvious what's changing across experiment runs, helping you quickly decide whether your latest version is actually an improvement.
Did user satisfaction improve?
Did accuracy regress?
Did brand voice get better?
@datadoghq
NYC MEET-UP: Building on @supabase? Come hang with us August 4th.
See @datadoghq's Database Monitoring (DBM) for Supabase in action, built to catch and explain performance issues so you don't need a database expert to fix them.
We'll cover:
⚡ Query performance and optimization
🔍 End-to-end tracing from app to database
🤖 AI-powered recommendations
🚀 Running production Postgres without needing a DBA
Save your spot: https://t.co/SAFKJlcMpa
LAUNCHED: Stale Flag Cleanup - you ship with feature flags, but do you remove them?
If your team uses feature flags, you probably have a bunch of old ones sitting around that nobody has touched in months.
@datadoghq now automatically detects stale feature flags, shows you why they're stale, and can generate a removal PR with Bits AI when it's time to clean them up.
check the docs → https://t.co/QWxetCKtcK
With Bits Code automations, you can go from a monitor or error in @datadoghq to an investigated issue and a fix that's ready to review - without someone manually triaging every incident.
@ThisWeeknAI
see the full video: https://t.co/wUy8DAQn5K
⚽ 39 days of live infrastructure. Tested in front of billions. Comes down to this stretch.
Ready to see the entire delivery chain, end to end?
Read our solution brief on streaming observability: https://t.co/eRhVvweEFb
Bits Code is now generally available!
Detect high-impact errors, write the fix, open the PR—all grounded in your real observability data.
Start shipping fixes, not chasing them: https://t.co/bnuIumS7Jj
Bits Data Analysis is now in Preview! Get fast, reliable answers to business questions using trusted context from across your data and telemetry.
Learn more: https://t.co/1X17pbAIgI
When Stream Router hit the limits of its storage architecture, Datadog engineers rearchitected the service without disrupting live production traffic.
The result? Operations went from an estimated 45 minutes to ~1 second.
Read the full story: https://t.co/p5EMKwy74p
Delivering 100M+ parcels a year takes more than speed—it takes resilient systems.
Posten Bring AS reduced critical incidents by 75% with unified observability across 250+ systems and 30 parcel terminals.
Learn how they did it: https://t.co/8TVGPE3ulJ
AI adoption doesn't automatically mean higher developer productivity.
In one randomized trial, developers thought AI made them 20% faster. It actually made them 19% slower.
Learn about five common DevEx measurement pitfalls in the AI era—and how to avoid them: https://t.co/LnM0Xta5Q5
🎥 What's new at Datadog?
On the heels of #DASH2026, learn how you can resolve reliability issues faster, automate your release cycle, and gain deeper visibility into agent behavior and user journeys.
Plus, get a look at Patterns in Agent Observability, Bits Evals, and Datadog Journey Monitoring: https://t.co/NmgeDRKpme
➡️ 2,000+ services.
➡️ One platform.
➡️ Zero context-switching.
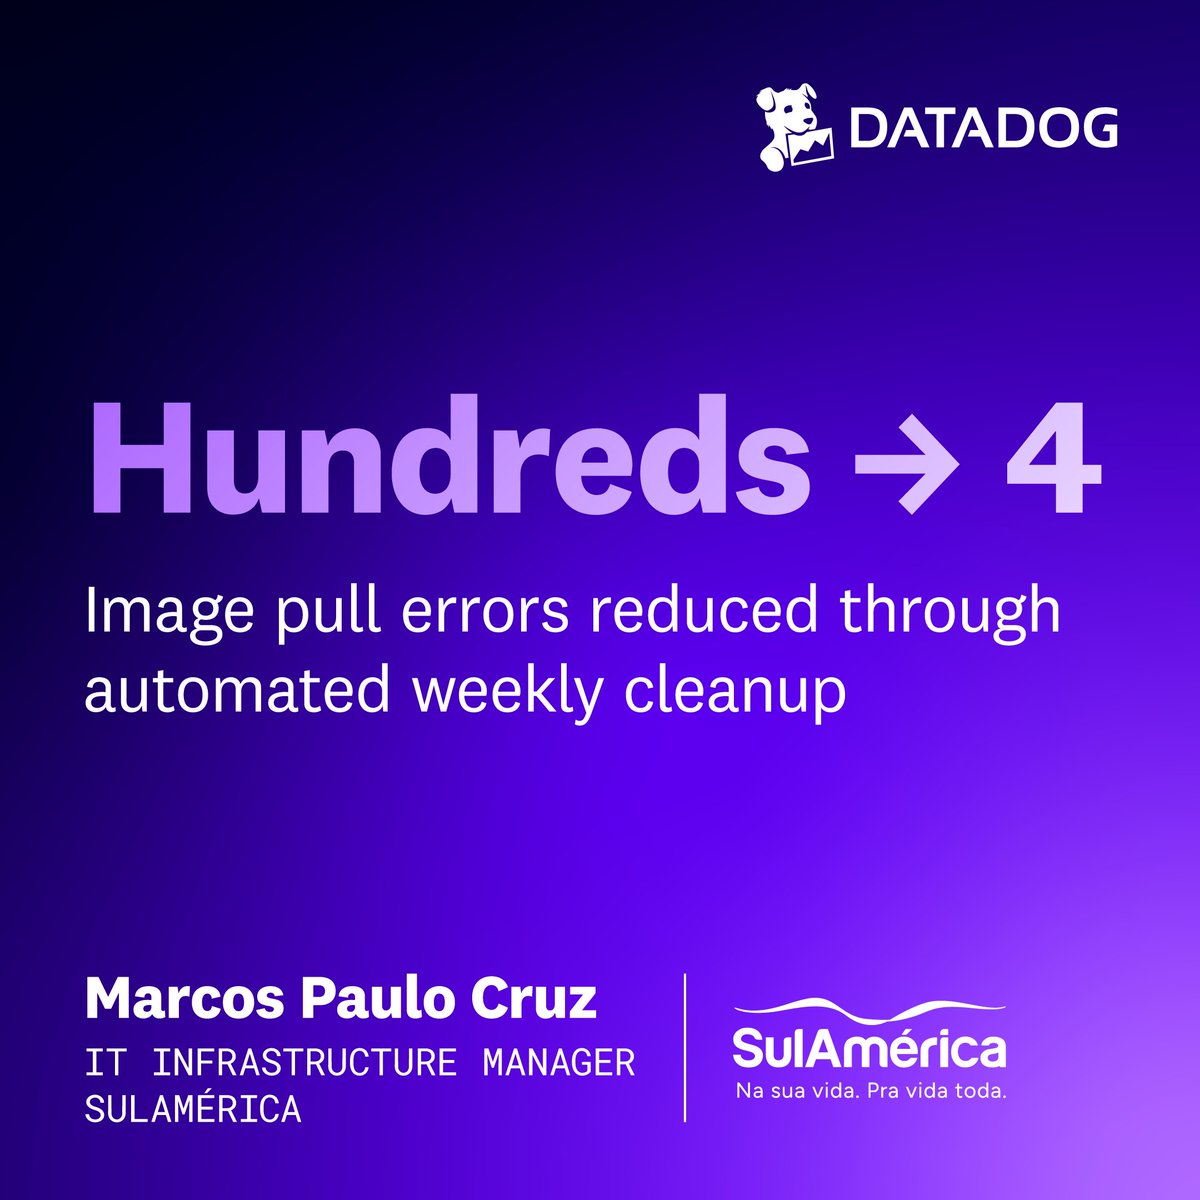
@Sulamerica moved from fragmented observability to Datadog and cut GKE costs by 9%, reduced memory usage by 40%, and dropped image pull errors from hundreds to just 4.
Read how: https://t.co/SrsWHQfXyU
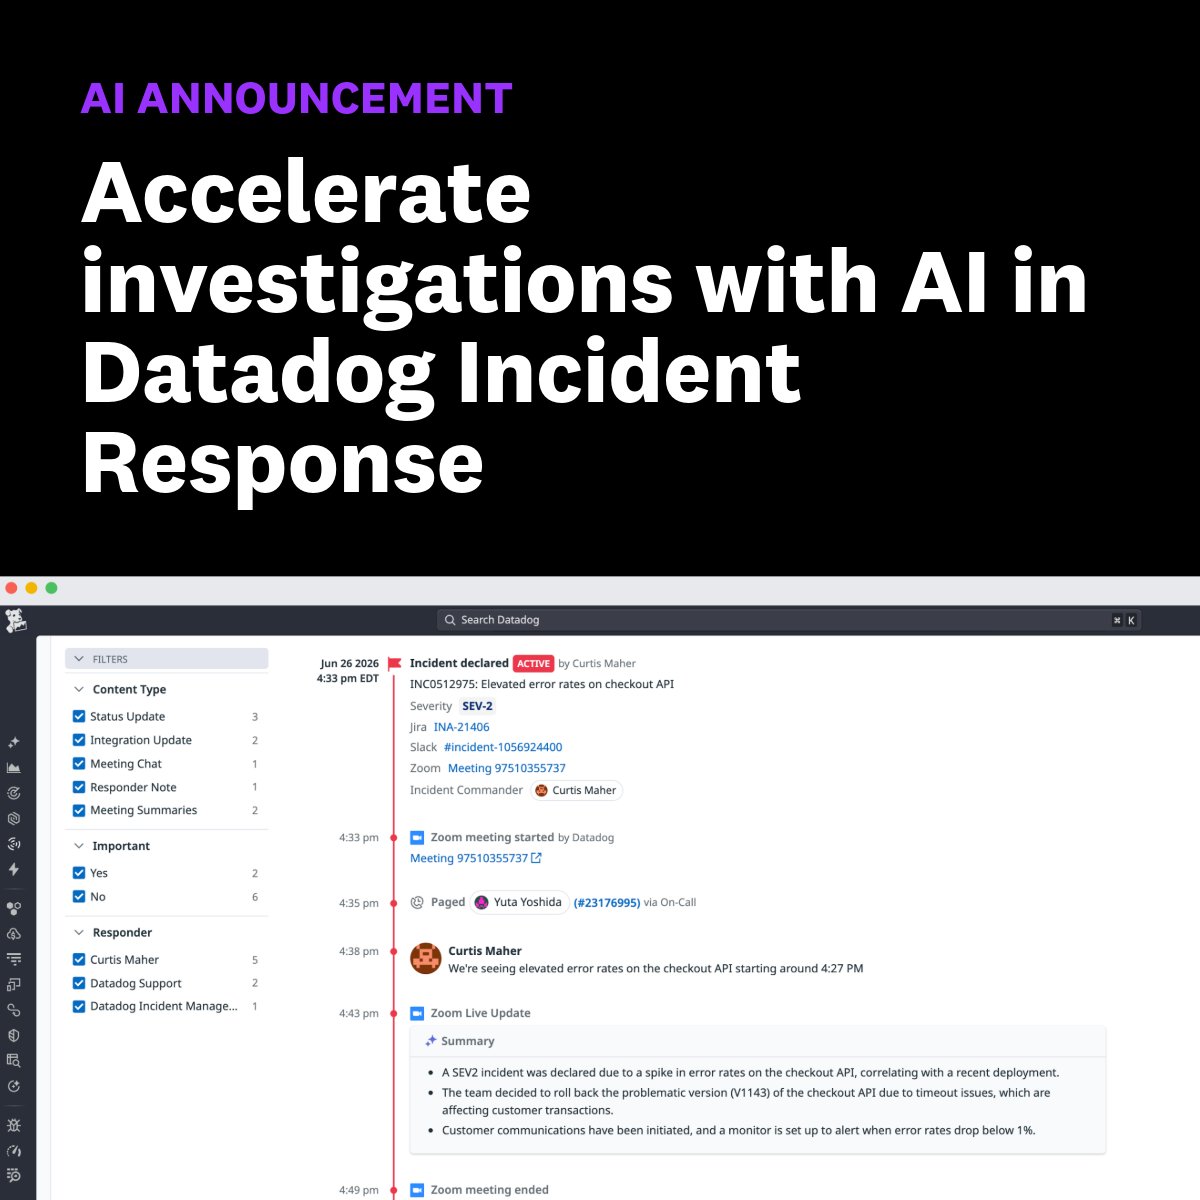
Every minute spent gathering context slows incident resolution.
New AI capabilities in Datadog Incident Response help responders diagnose root causes faster, get up to speed quickly, and automatically document bridge discussions.
Learn more: https://t.co/e5xtuyTrUD
What does it take to save $3M+ in idle compute costs?
We rightsized 30,000+ Kubernetes deployments across 1,800+ services and cut idle compute costs by more than 50% in our first data center rollout.
Learn how: https://t.co/RA9z1mWJzH
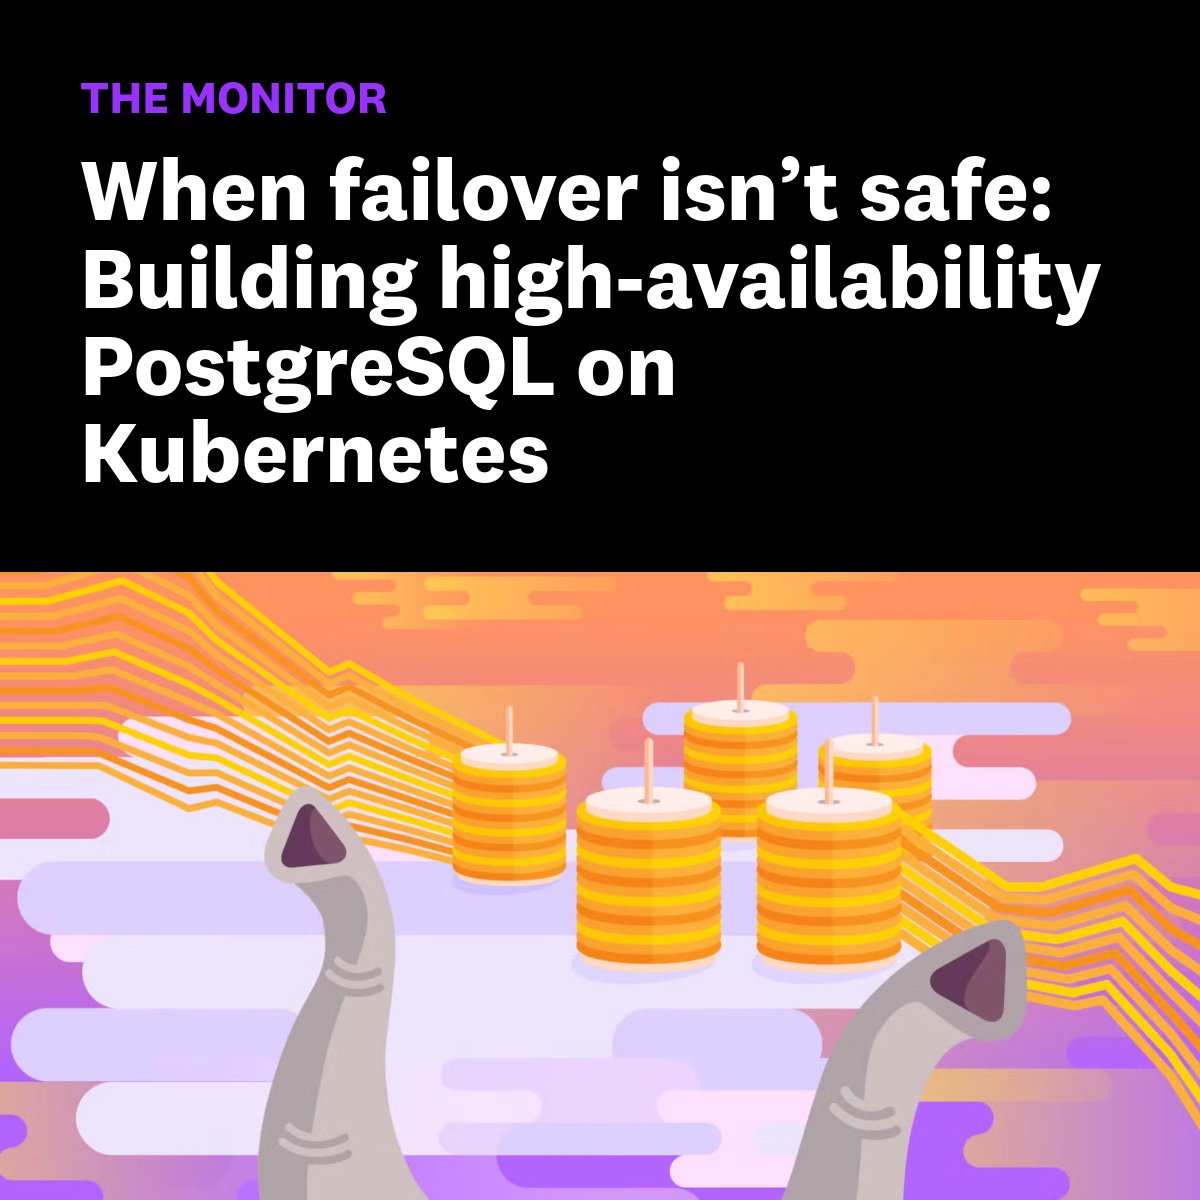
Gameday simulations exist to find problems before production does. Our exercises found that failover wasn't just risky—it was impossible.
Here's how we rearchitected PostgreSQL on Kubernetes with synchronous replication and Patroni to fix that: https://t.co/6JYHSOqHIC