What to watch: how the save was made.
36% of merchants saved with a fee discount left within the next 12 months, against 15% of those saved by fixing the problem.
How do you decide who gets the call?
A merchant acquirer processes card payments for 42,000 small businesses and keeps about €0.18 of every €100.
It loses 15% of them a year: about €2.1M of net revenue.
Three account managers, about 1,800 calls a quarter. Who should they call? A deep dive, in seven charts.
#Analytics #FinancialServices #Payments #CustomerRetention #ChurnModelling
The business case.
Calling every flagged merchant keeps €279K of revenue for €182K of manager time: €97K net.
Calling only where a call helps, 71% of the calls, keeps 96% of the revenue: €140K net.
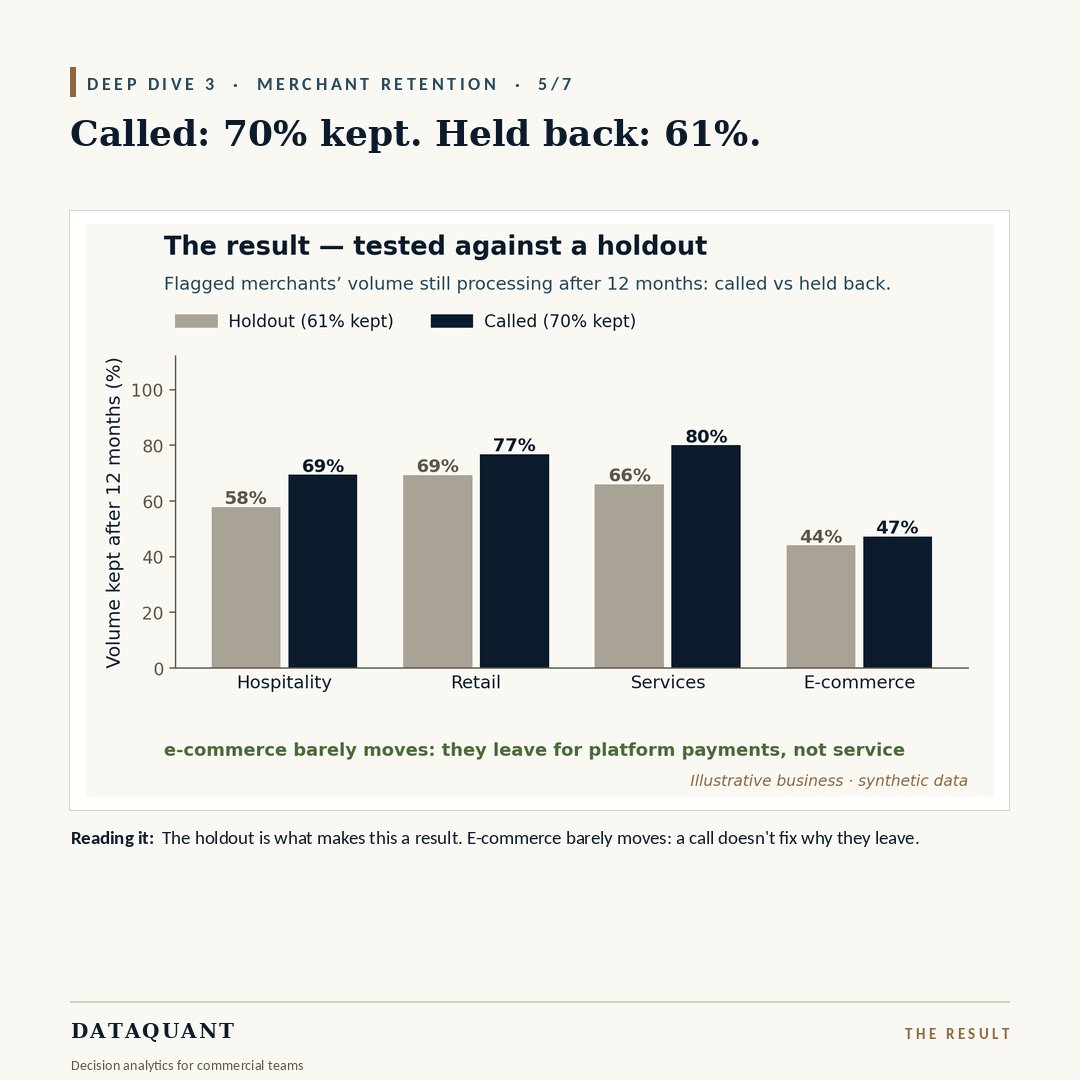
The result, against a random holdout:
called merchants kept 70% of their volume after 12 months;
those held back kept 61%.
E-commerce barely moves (47% vs 44%): they leave for platform payments, not service.
The method: take the season out before you score.
A raw month-on-month model flags hospitality in October, when most are having a quiet month.
Adjusted, false alarms fall from 2,570 to 1,210, at the same overall hit rate.
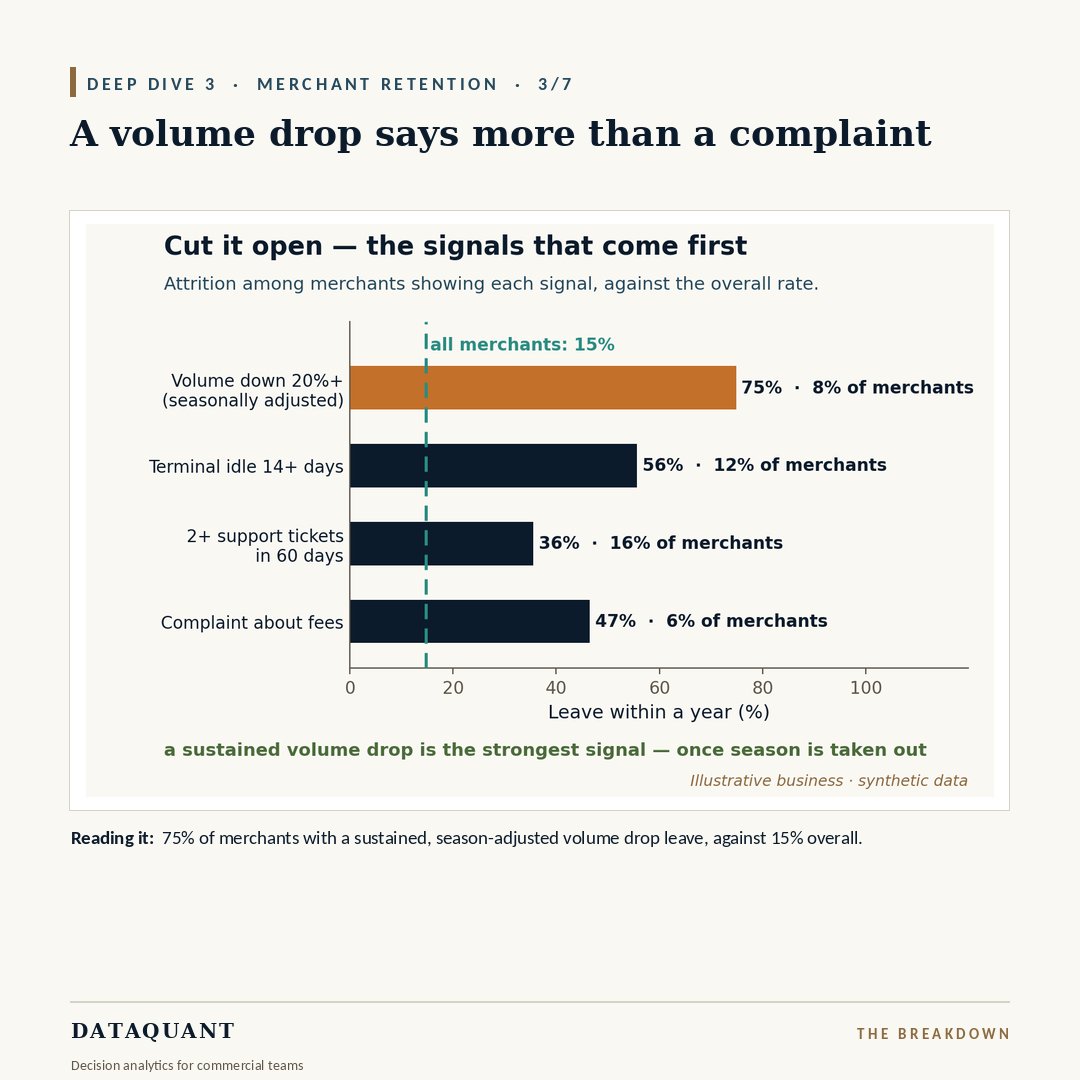
Which signals come first? Of merchants whose volume fell 20%+ (seasonally adjusted), 75% left within a year, against 15% overall.
A terminal idle 14+ days: 56%.
Repeated support tickets matter less than assumed: 36%.
Smaller merchants leave.
E-commerce loses 21% of its merchants a year; hospitality 17%.
But leavers are 21% smaller than stayers, so counting merchants overstates the loss. In volume it is 12% a year.
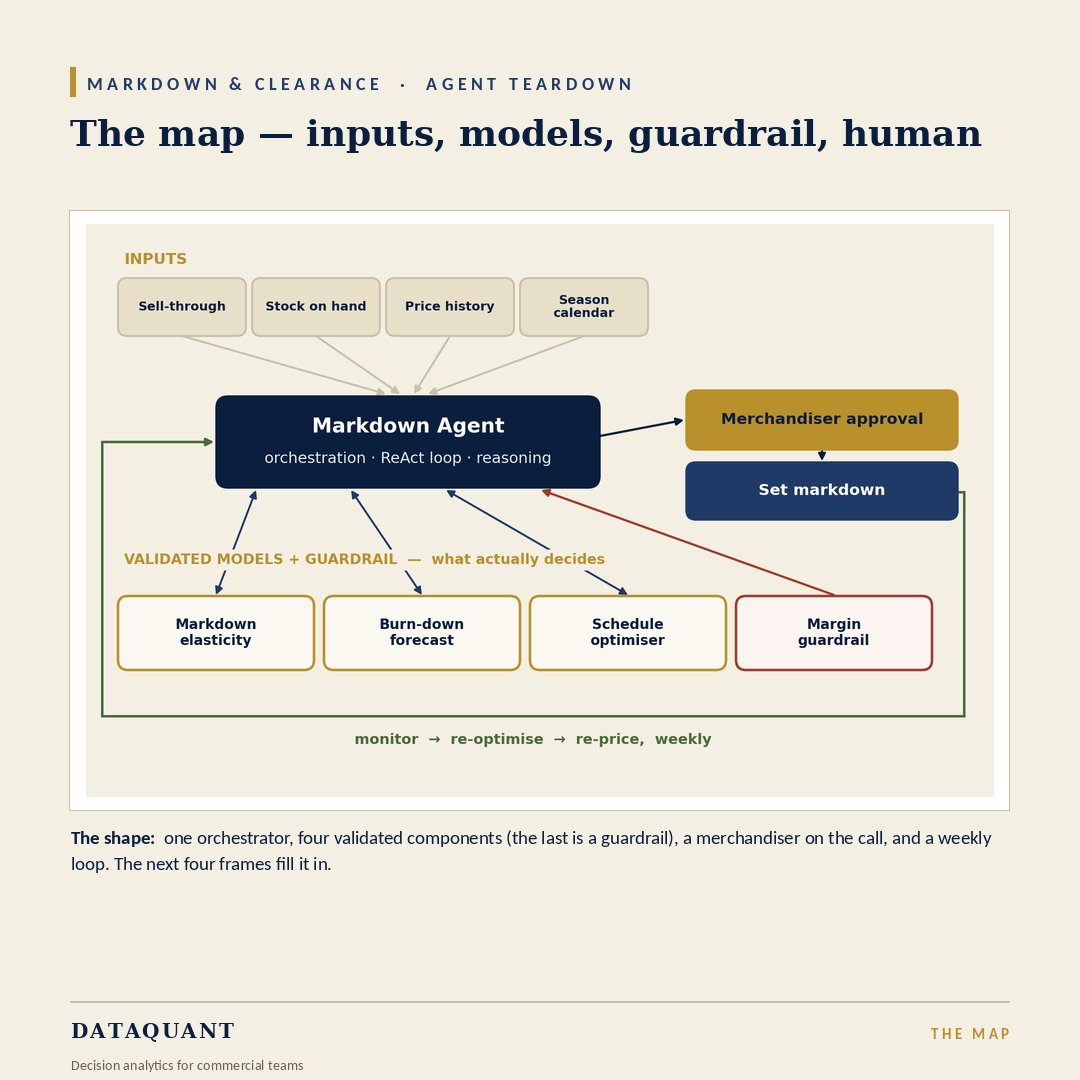
Read the burn-down, cut by this week’s elasticity, stage the depth, and never price below the floor without a human.
The models decide depth and timing; the agent re-plans weekly; the merchandiser owns the exceptions.
‘Validated models decide.’ Here’s what that means for clearance pricing.
The Markdown Agent, torn down: every signal it reads, every model it calls, one cut walked end to end, and the 40% markdown the guardrail stopped.
Teardown ↓
#Retail#Markdown#RevenueManagement#Pricing #AgenticAI
The one it caught: a 40% cut in week 3, below landed cost with eleven weeks to run.
The guardrail held it at the 20% cap and escalated. The merchandiser found the line was mis-ranged in two stores — and moved the stock.
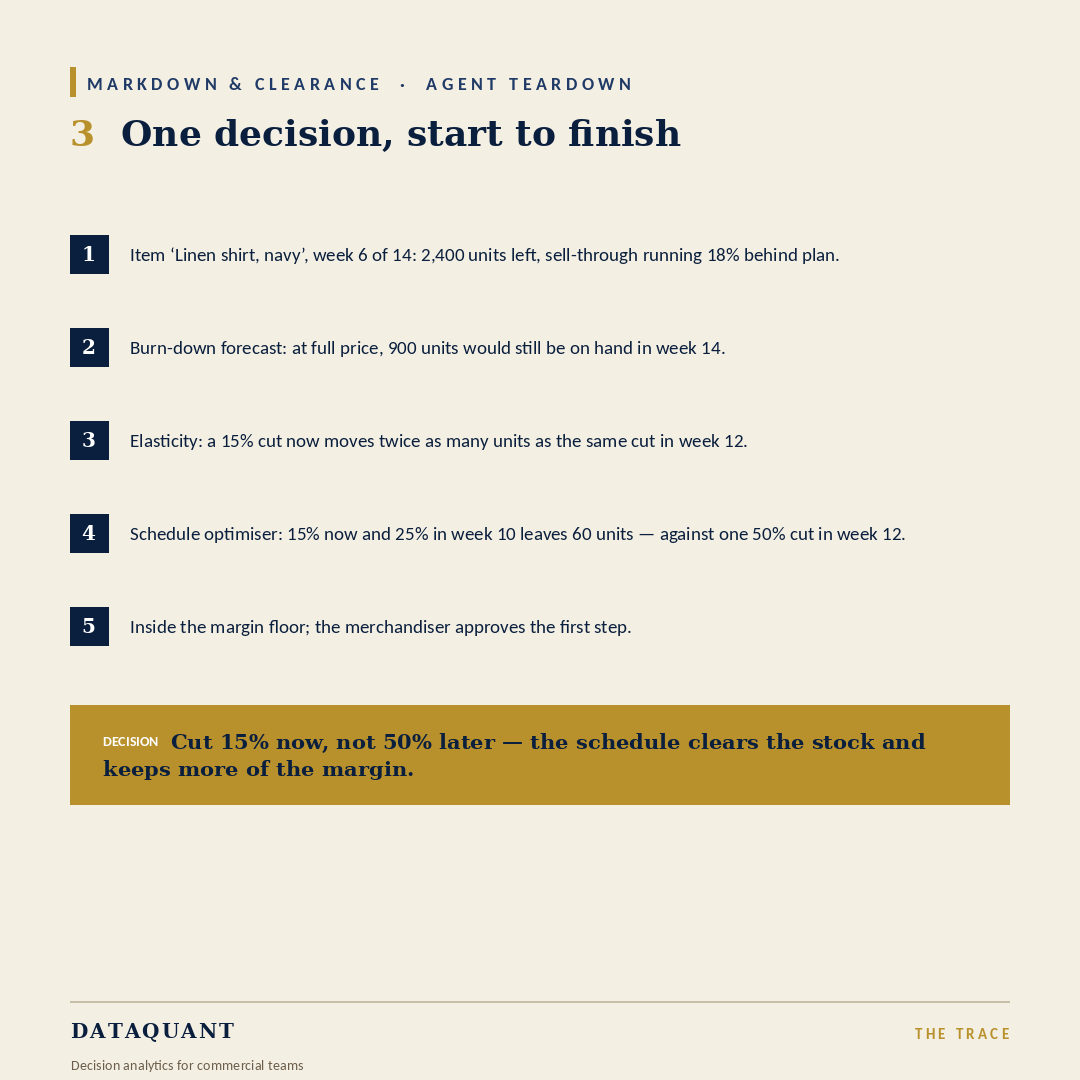
One cut: 2,400 shirts left in week 6,
900 still on hand at season end at full price.
A 15% cut now does twice the work of one in week 12, so the plan is 15% now and 25% in week 10 — 60 units left, not a 50% slash.
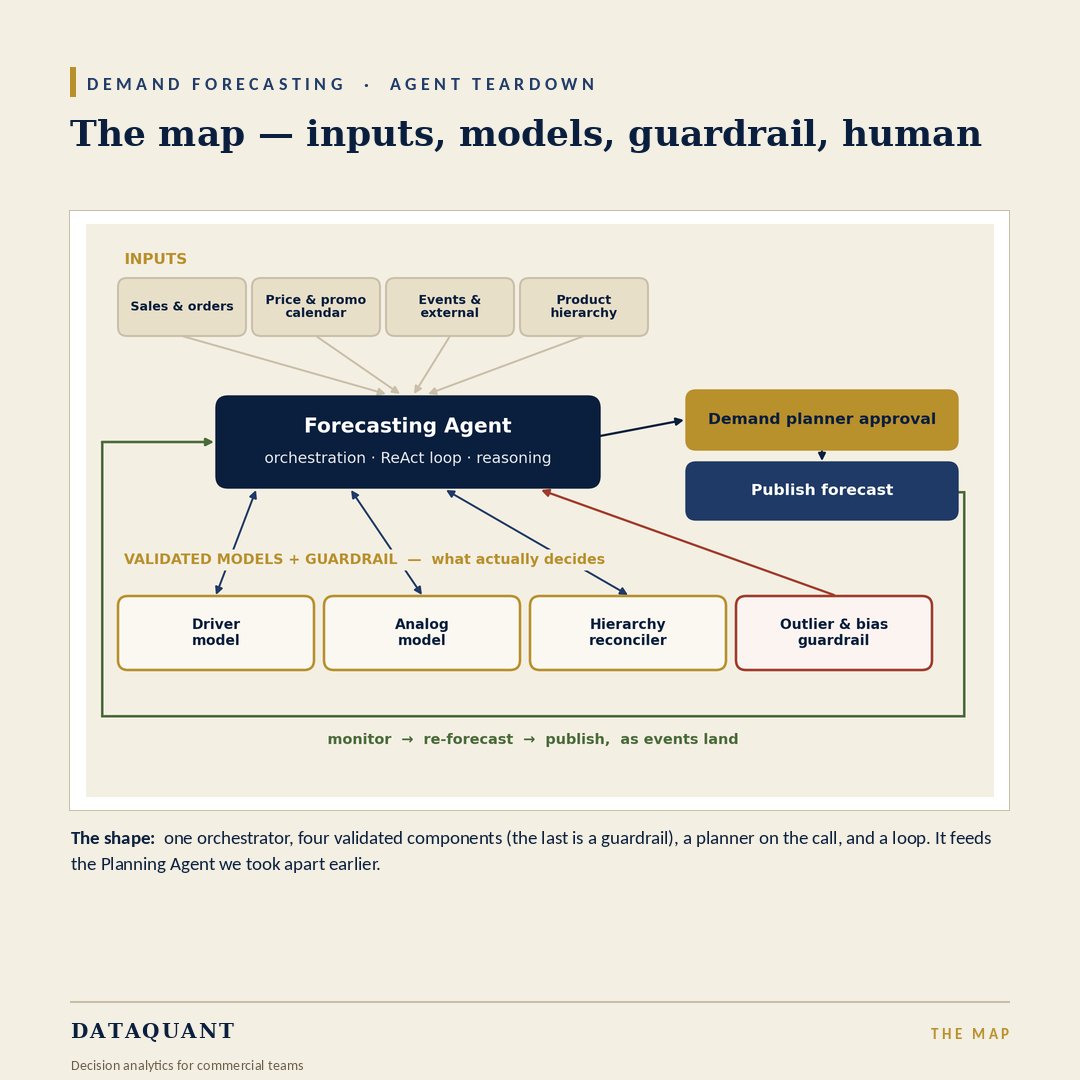
The models: an elasticity model that changes through the season, a burn-down forecast of what is left at the end, a schedule optimizer for depth and timing, and a margin guardrail setting the deepest cut allowed.
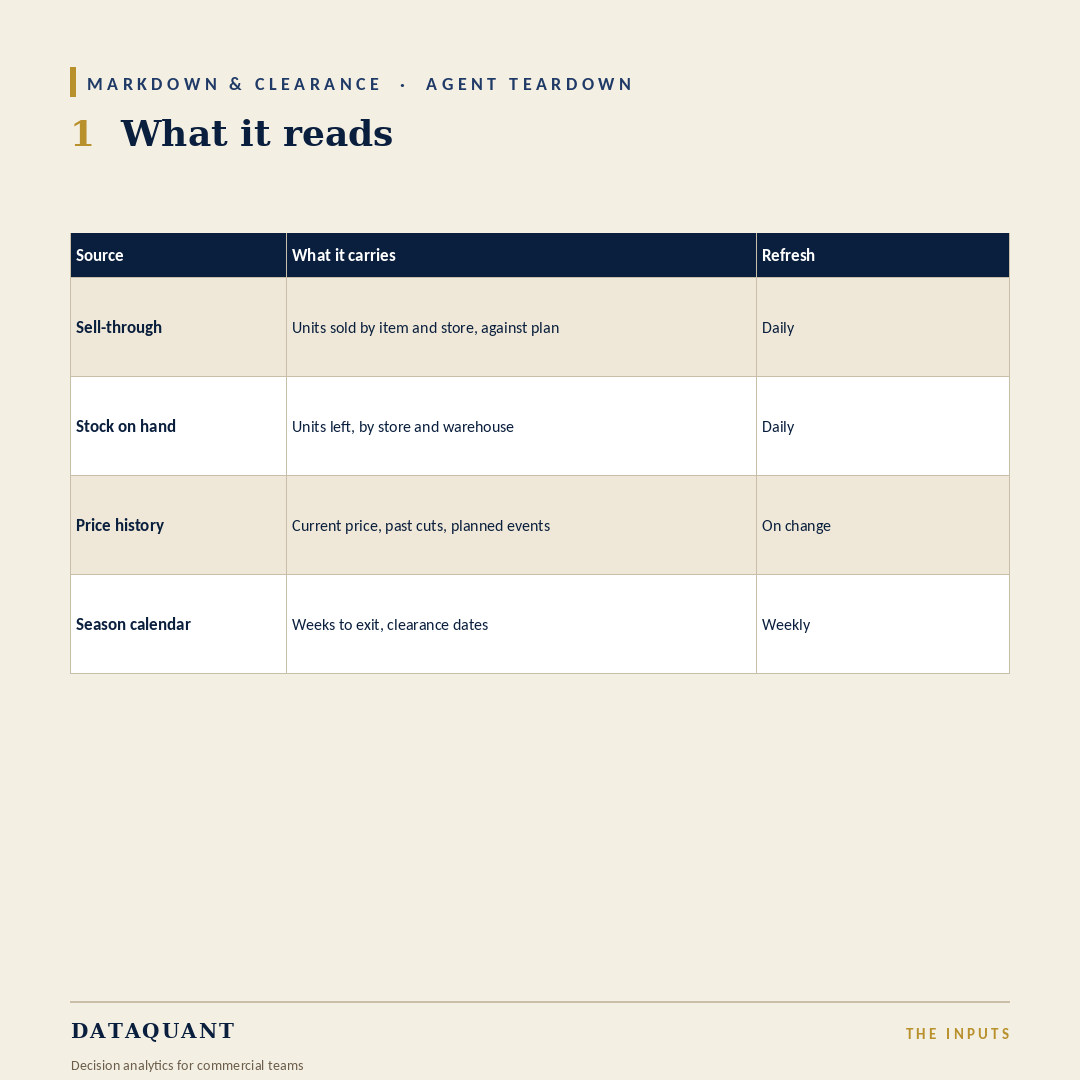
What it reads: sell-through, stock on hand, price history and the season calendar.
The decision is never ‘how much discount’ in isolation — it is how much stock, how many weeks, and how fast it is actually moving.
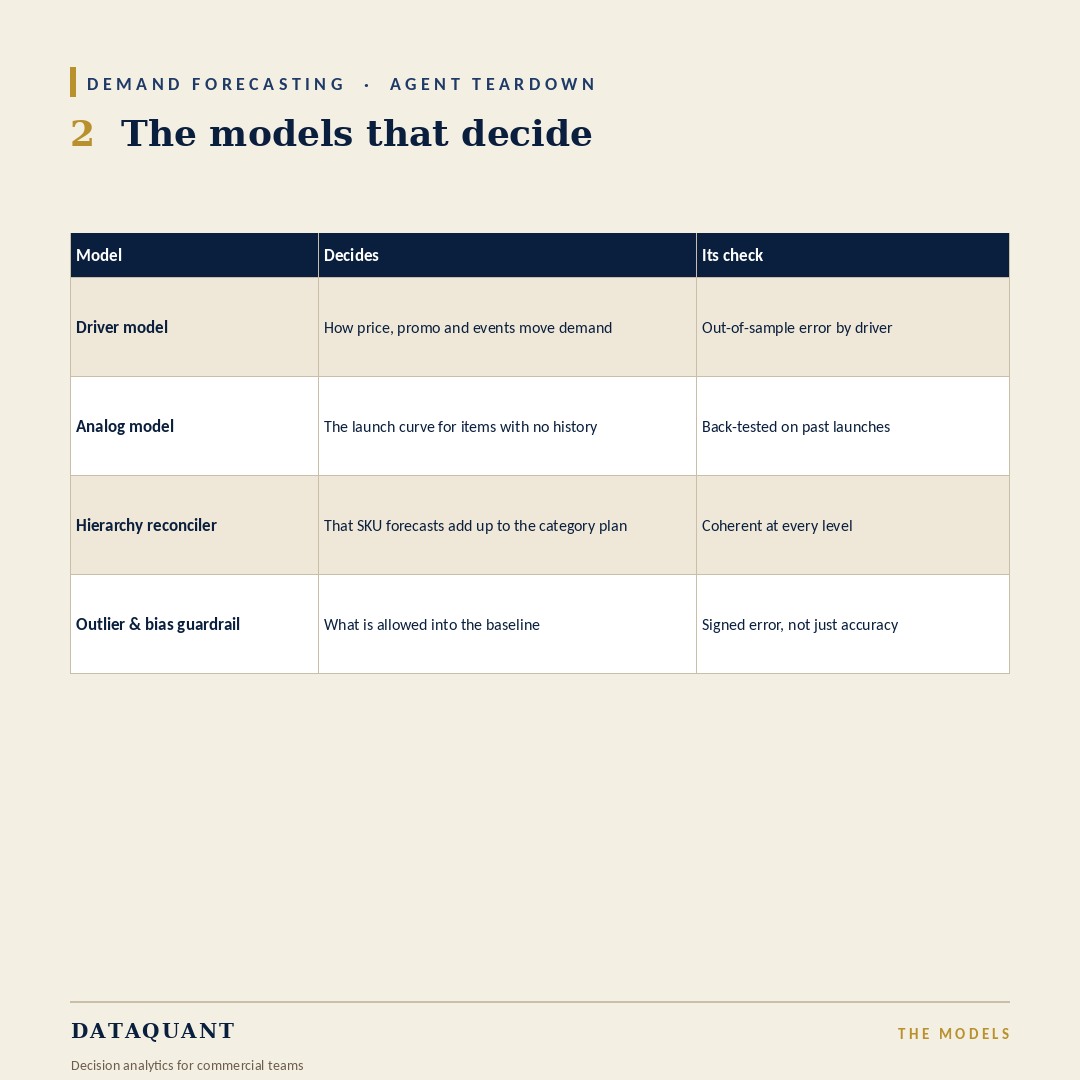
Model the drivers, borrow a shape for new items, make the levels add up, and keep one-offs out of the baseline.
The models decide the number; the agent re-forecasts as events land; the planner owns the exceptions.
‘Validated models decide the number.’ Here’s what that means for a demand forecast.
The Forecasting Agent, torn down: every input, every model, one promotion re-forecast end to end, and the bulk order it refused to learn from.
Teardown ↓
#DemandForecasting#DemandPlanning #SupplyChain #AgenticAI #B2B
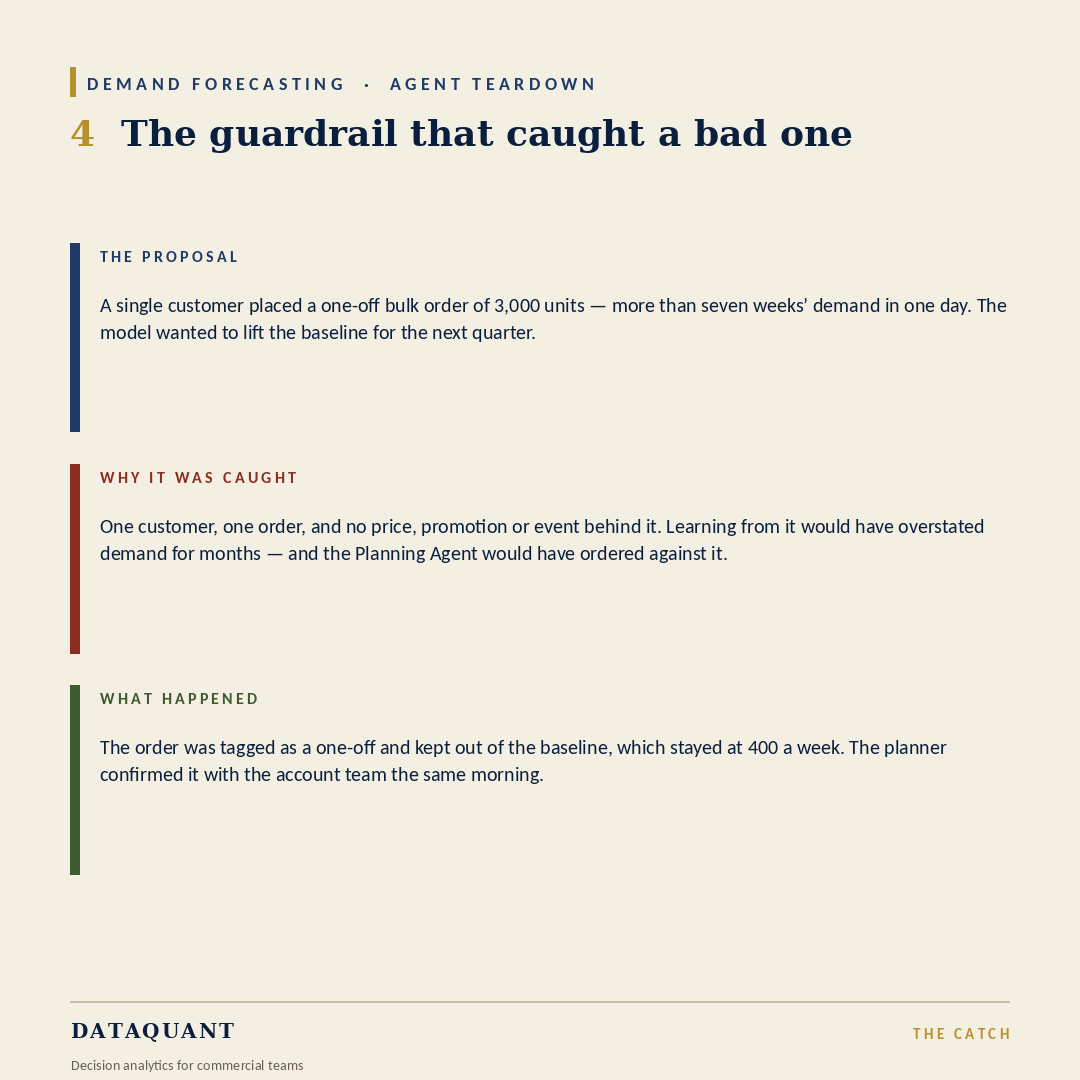
The one it caught: a one-off order of 3,000 units — over seven weeks’ demand in a day.
The model wanted to raise the baseline. The guardrail kept it out; learn from it and the Planning Agent orders against a ghost.
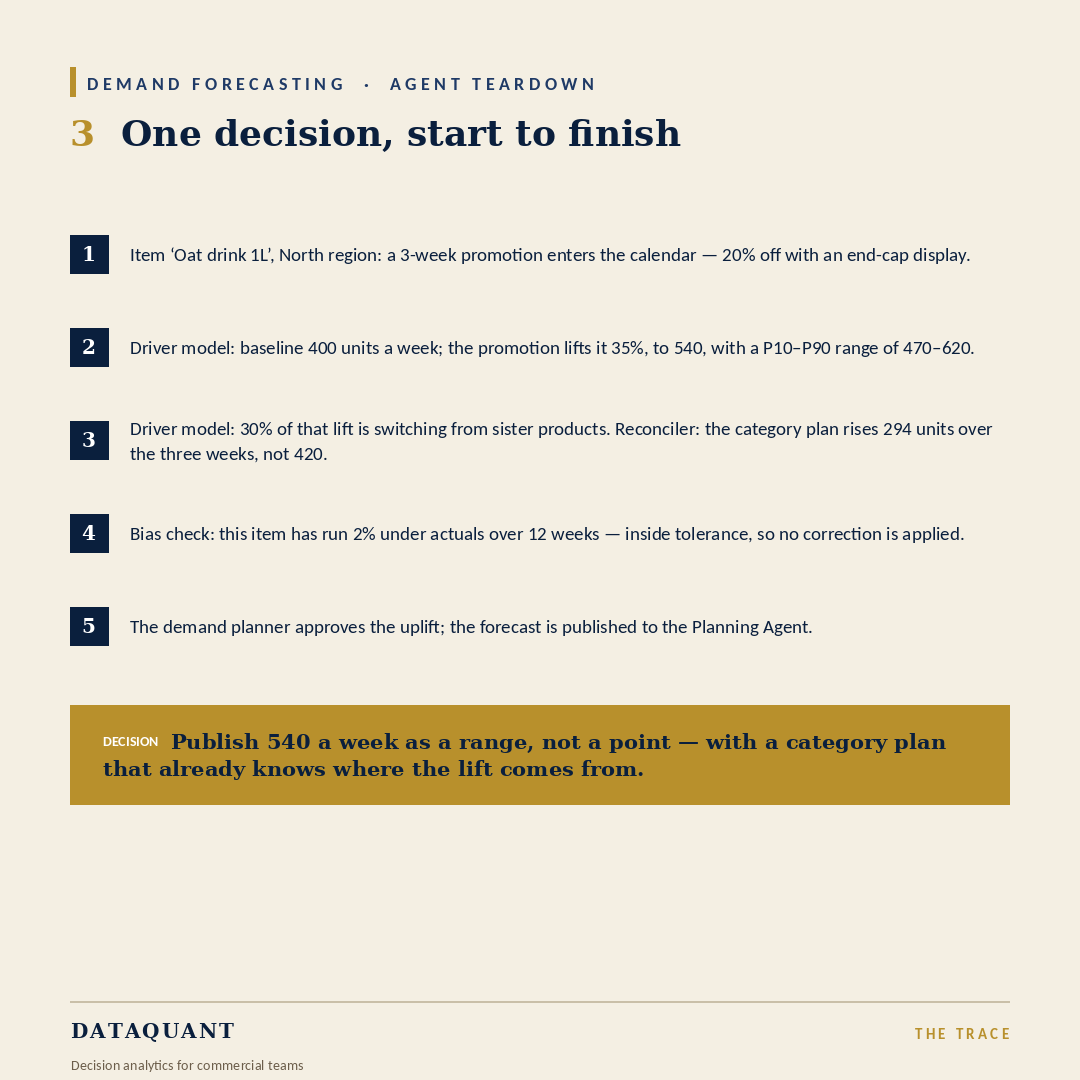
One re-forecast: a 400-a-week item goes on promotion; the driver model lifts it 35% to 540, and finds 30% of the lift is switching from sister products.
Over the three weeks the category rises 294, not 420. A planner approves.
The models: a driver model for what price, promotions and events do;
an analog model for items with no history;
a reconciler so SKUs add up to the category plan;
and a guardrail on what gets into the baseline.
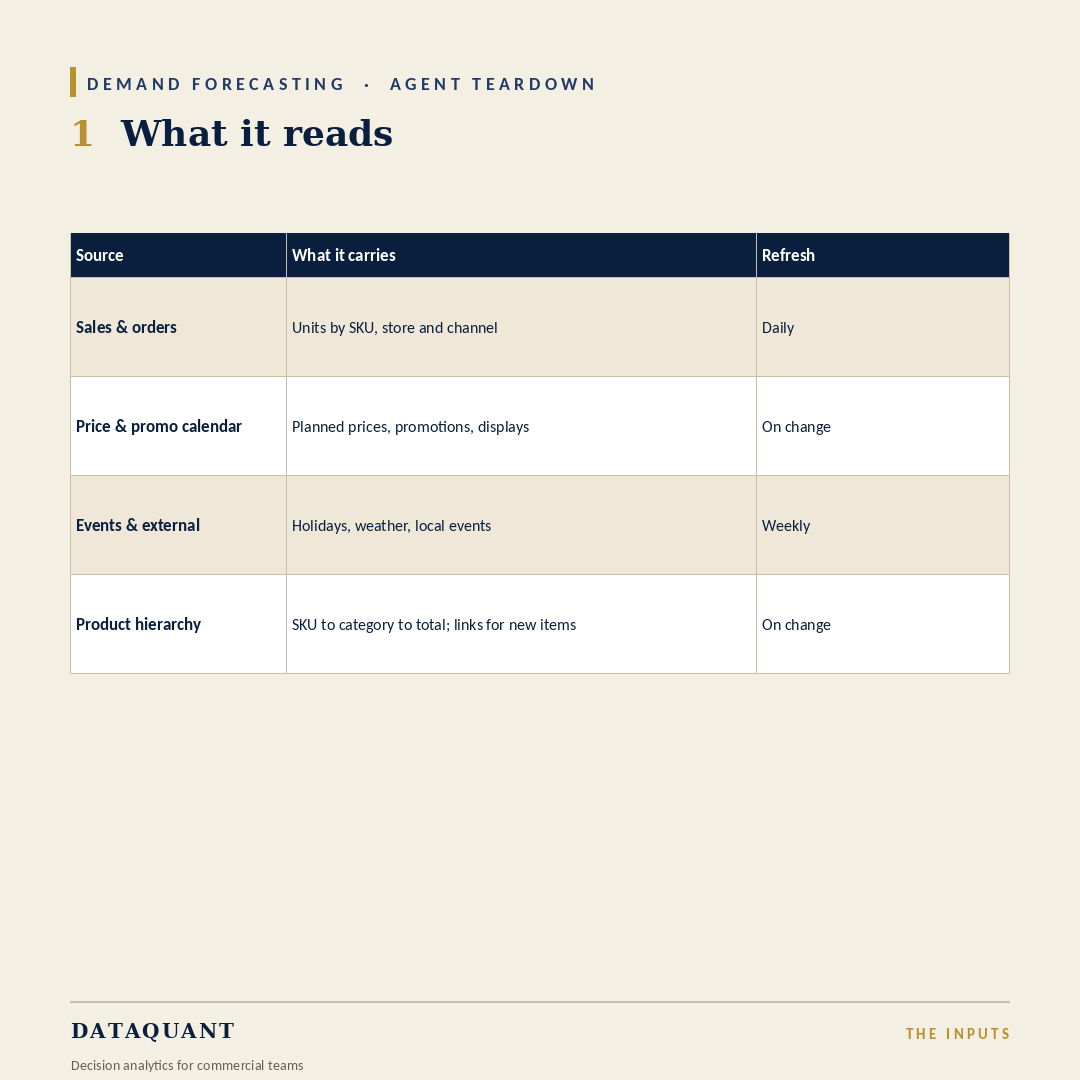
What it reads: sales, the price and promotion calendar, events, and the product hierarchy.
A forecast that only sees its own history misses every spike someone in the business planned on purpose.
Before reading any result, write down the smallest effect that would change the decision, then ask whether the interval rules it out.
And if a segment ‘works’ after the fact, it is a hypothesis for the next test, not a finding.
‘No significant difference’ is the most misread sentence in experimentation.
These three tests all earned it. One rules out anything worth having. One can’t tell. One is probably a win.
Reading a null, taken apart ↓
#Experimentation#ABTesting#Statistics#DecisionScience #CommercialExcellence