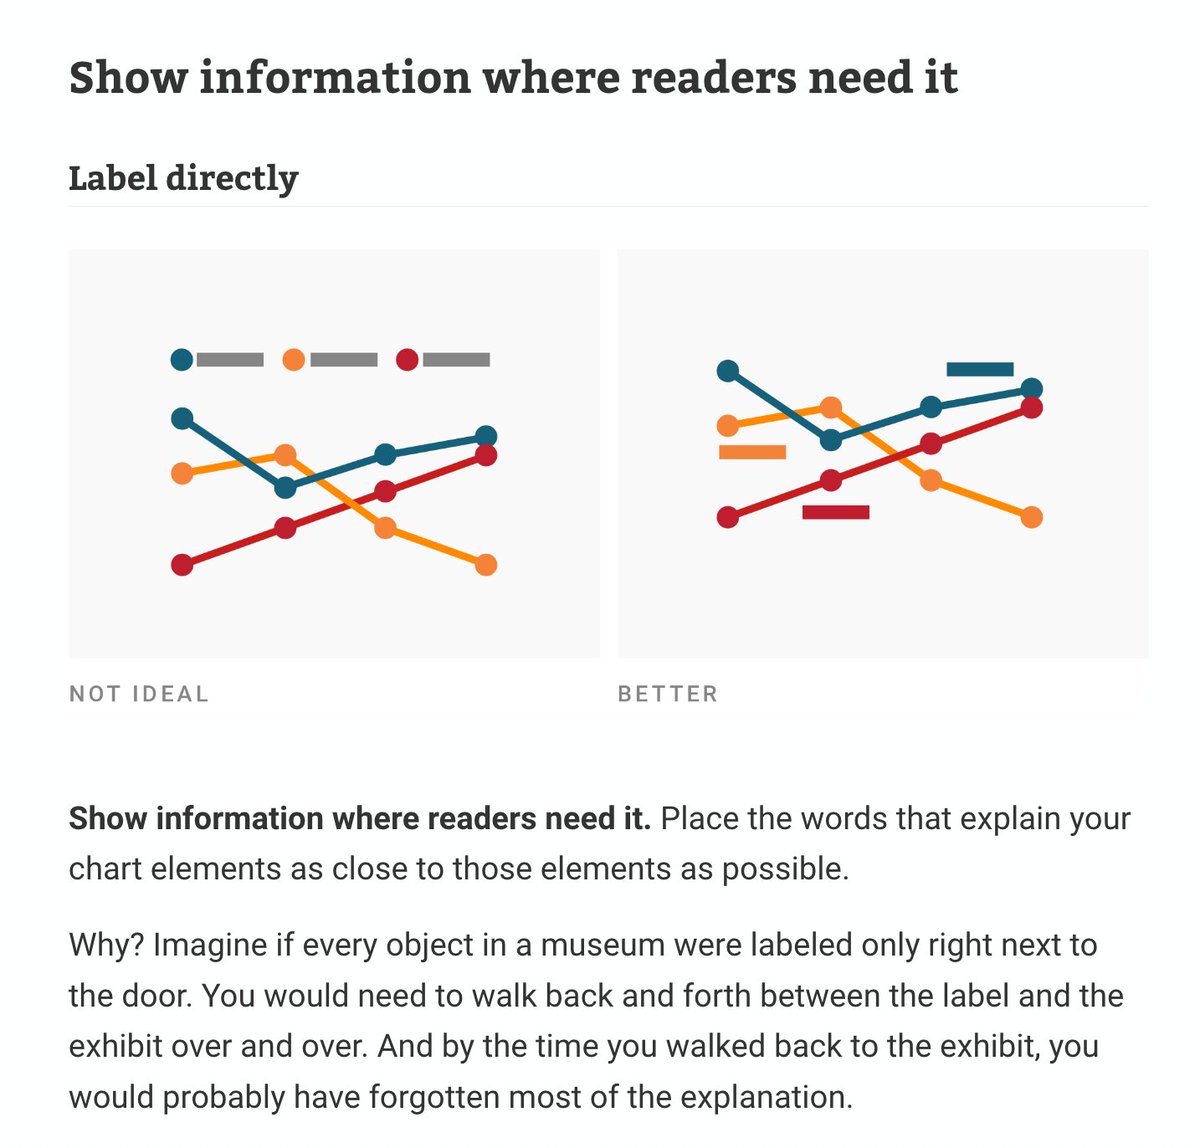
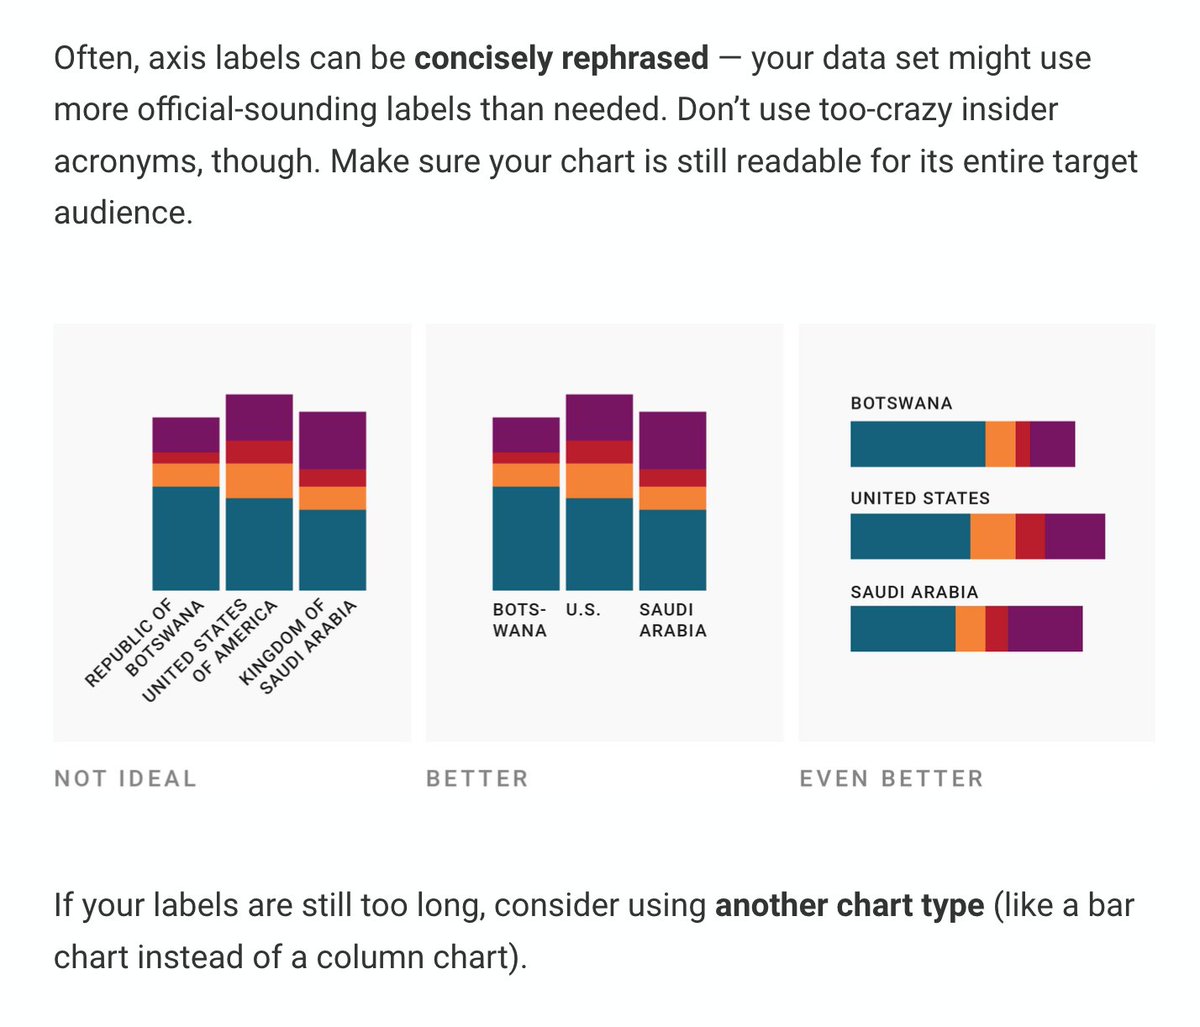
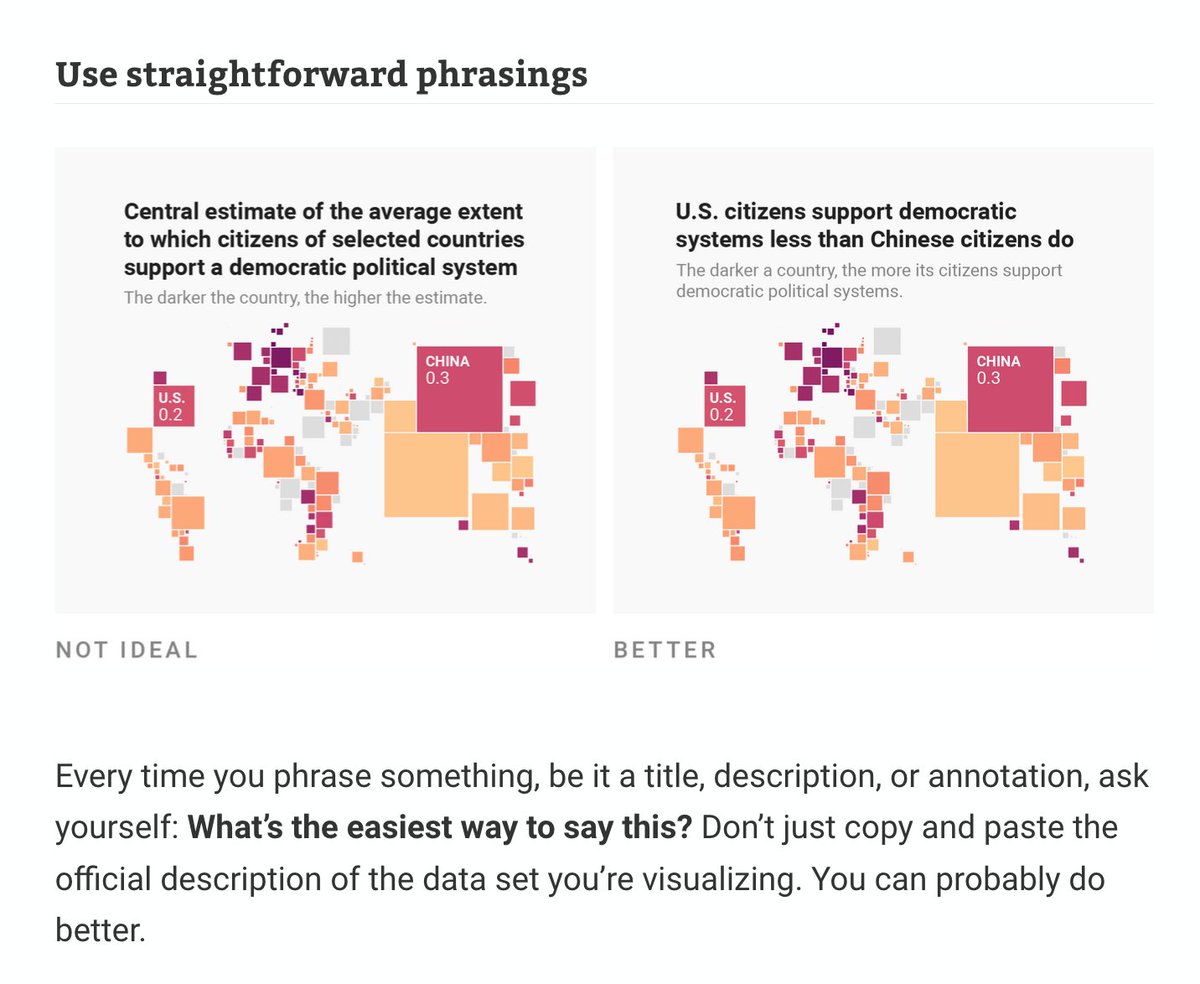
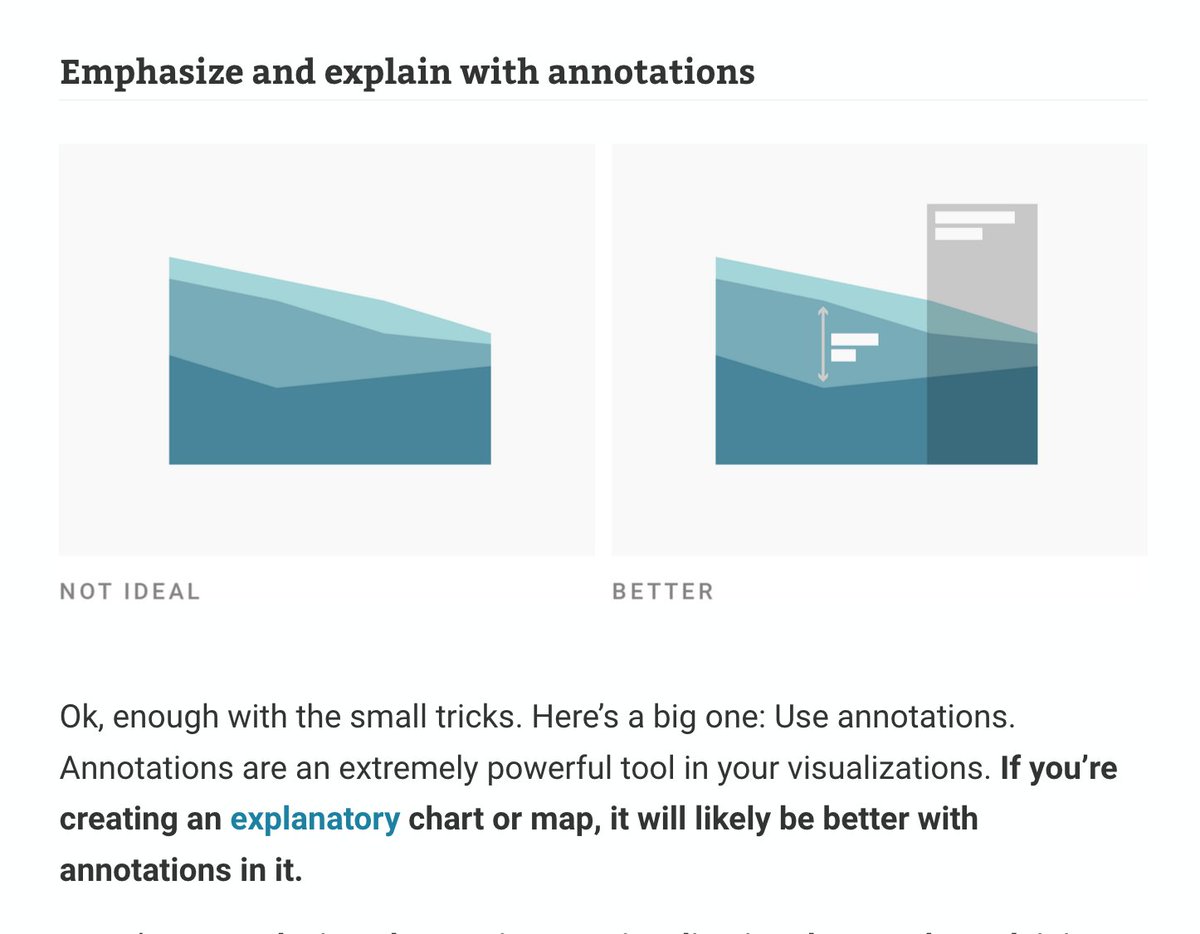
Text might be the most neglected part of #dataviz. We talk a lot about how the right chart type and colors can improve visualizations – but not enough about how to use words well.
So I wrote about that in my latest article: https://t.co/Ao1HhBNZ95
We just released an exploration I've been wanting to do for a while:
✨✨
Can we visualize a codebase?
✨✨
We always look at our code in a file/folder list - what would a bird's-eye-view look like, and how could that enhance our understanding of code?
https://t.co/dFpdoWtxyJ
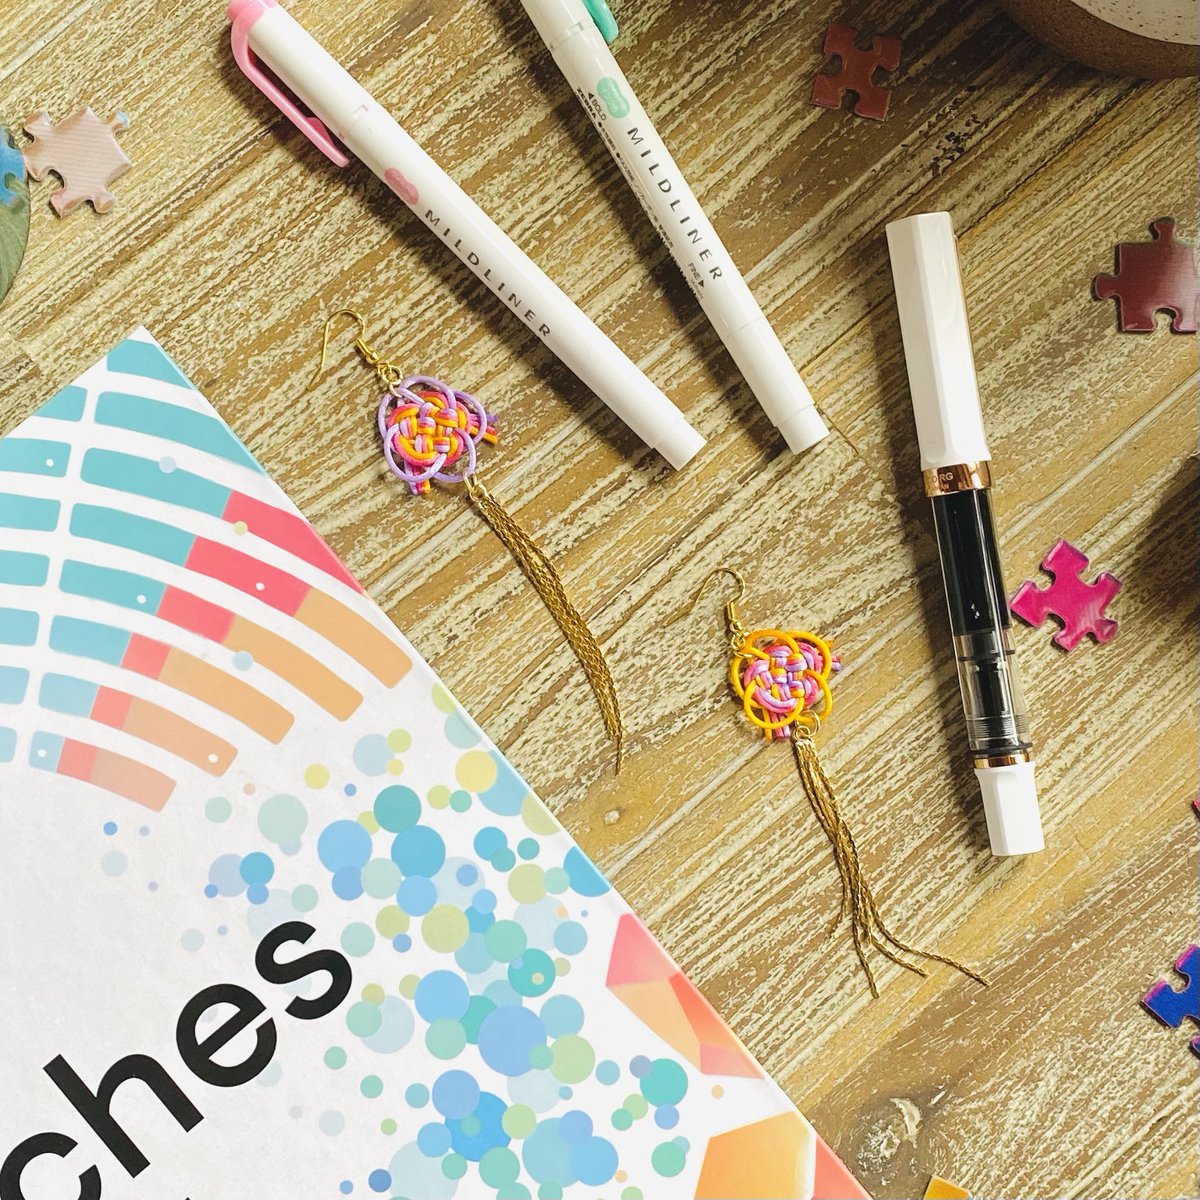
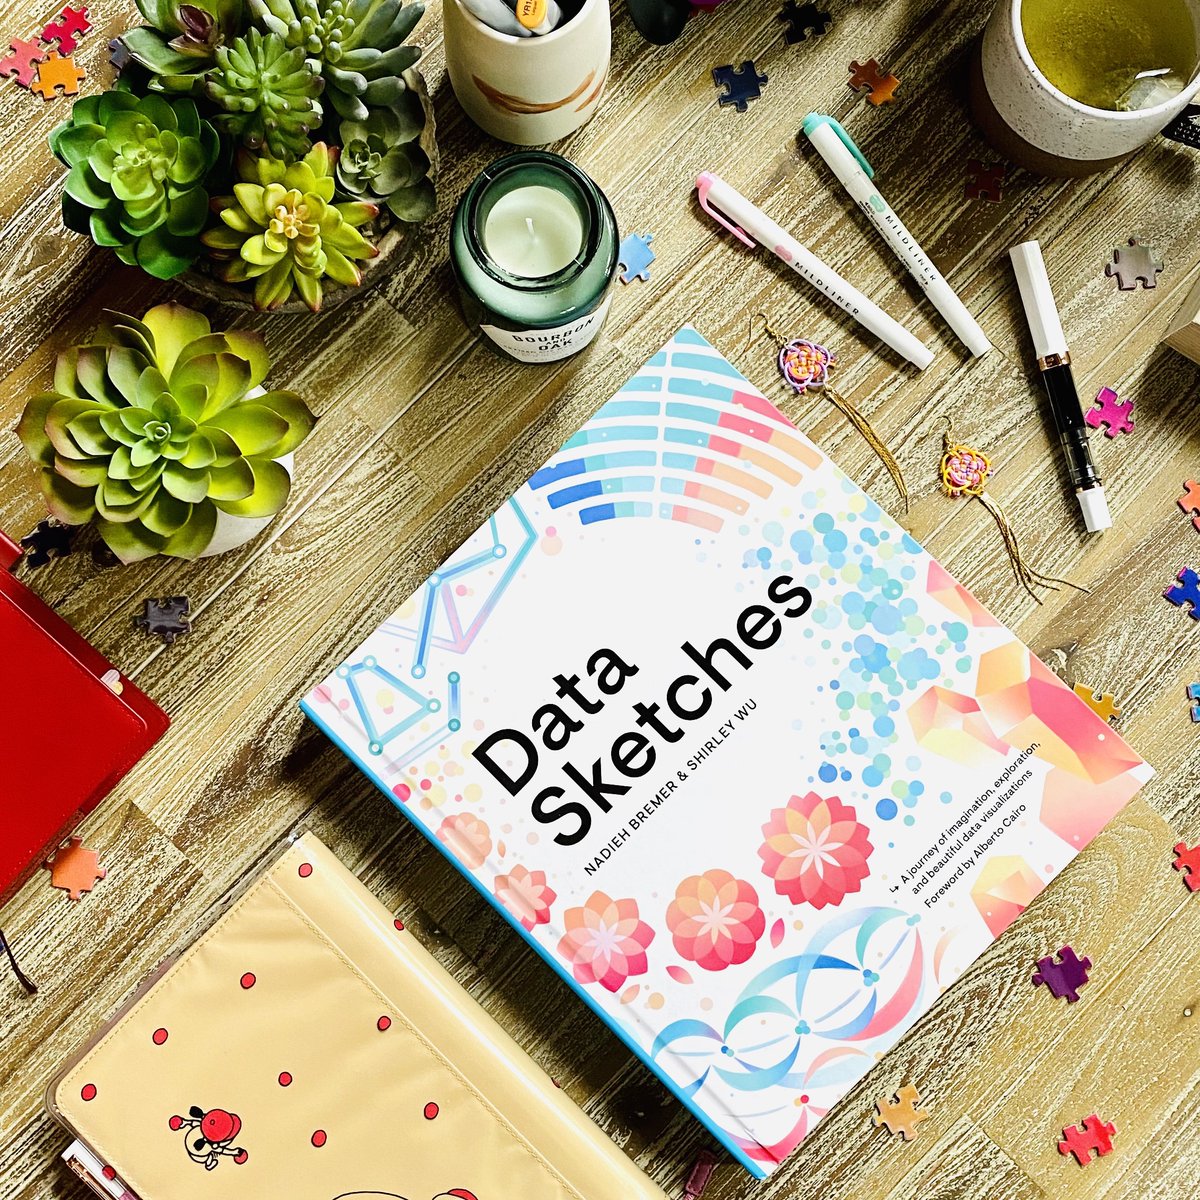
Thank you so much to everyone who joined our book launch yesterday 💖 and thank you @AlbertoCairo+@tamaramunzner for joining our celebration and @jlengstorf for managing our stream 🙏
ICYMI → https://t.co/RZX2Piva9E
P.S. I made flower earrings specially for the launch 😆🌸
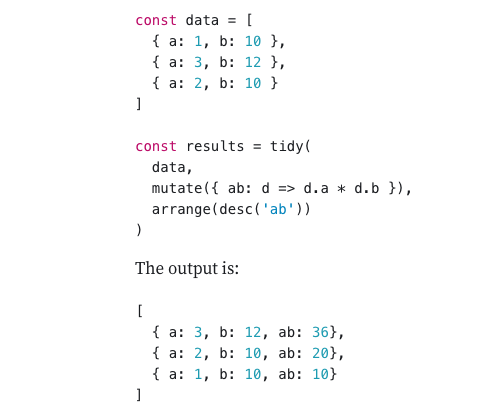
🚀 Happy to release tidy.js today on npm. Inspired by the tidyverse and dplyr, tidy.js aims to bring the ergonomics of data wrangling from #Rstats to the js (and typescript) community.
site: https://t.co/faolPmwy8v (+ playground)
repo: https://t.co/eOJnNGelnV
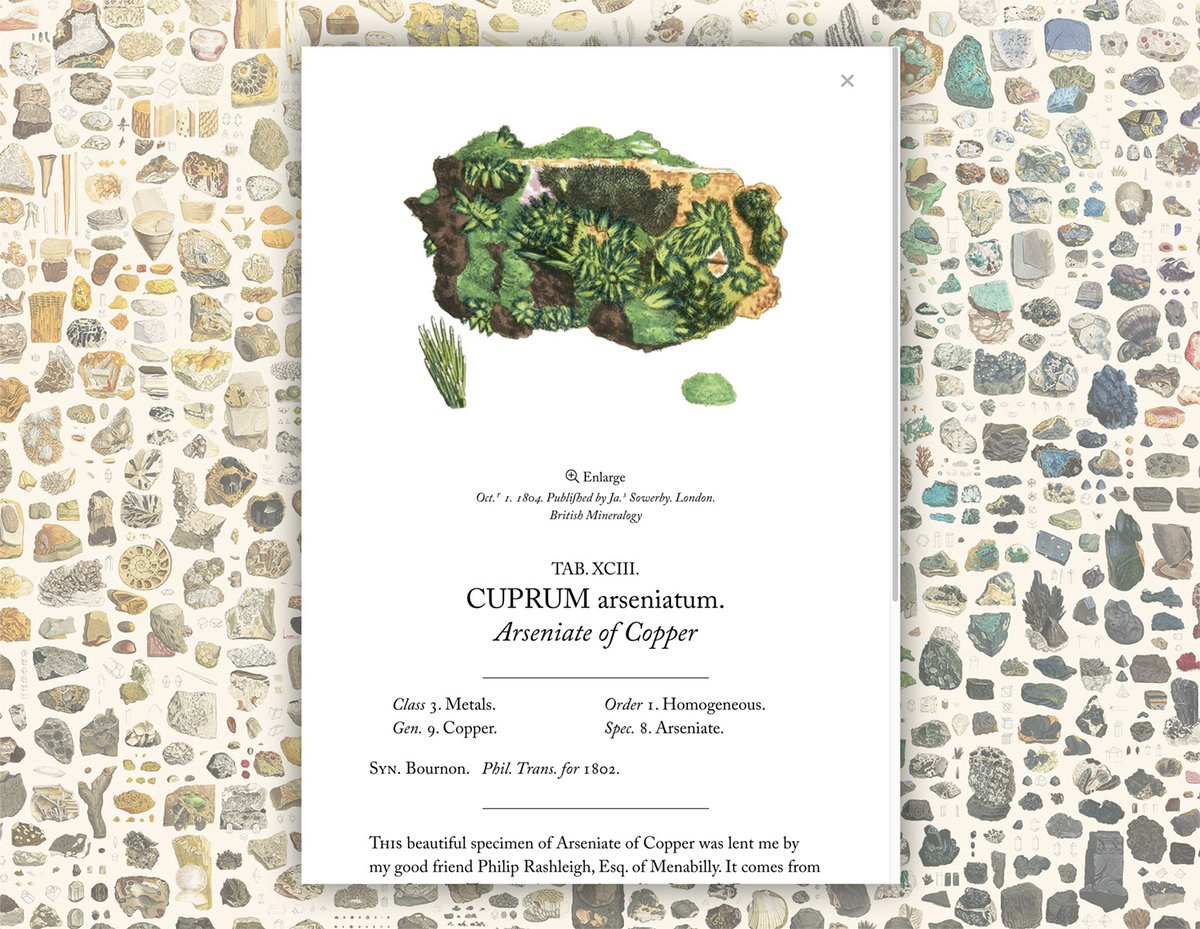
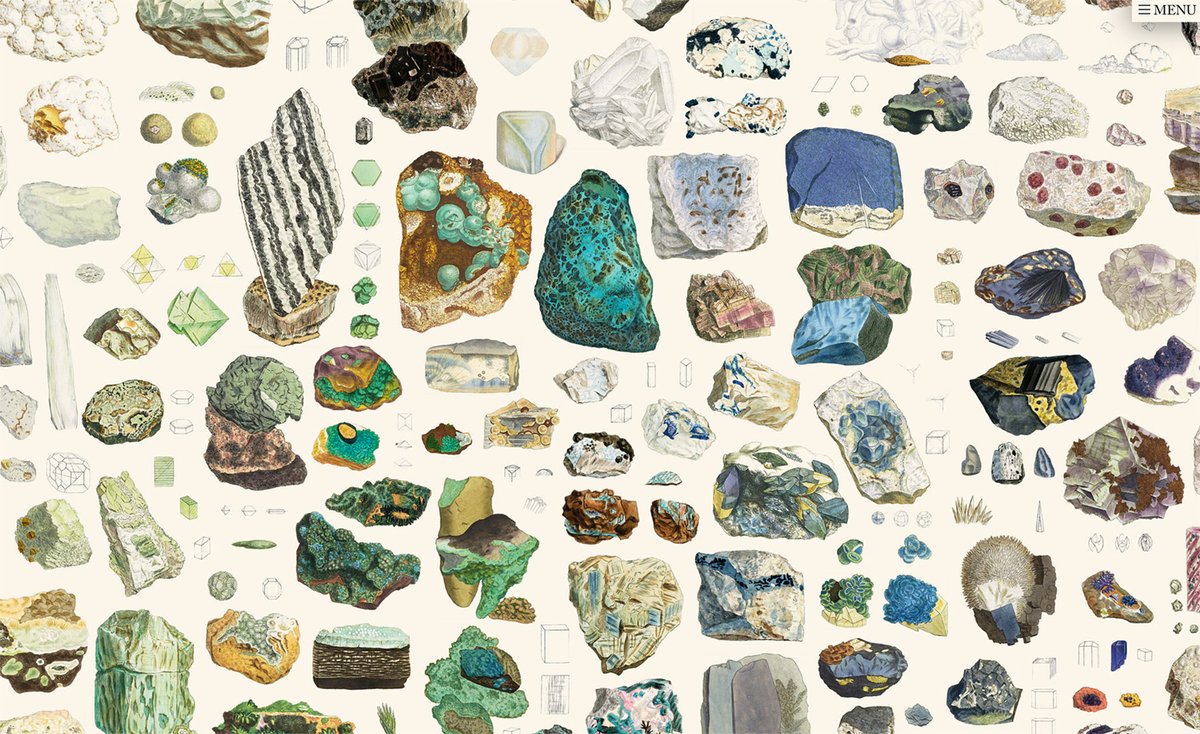
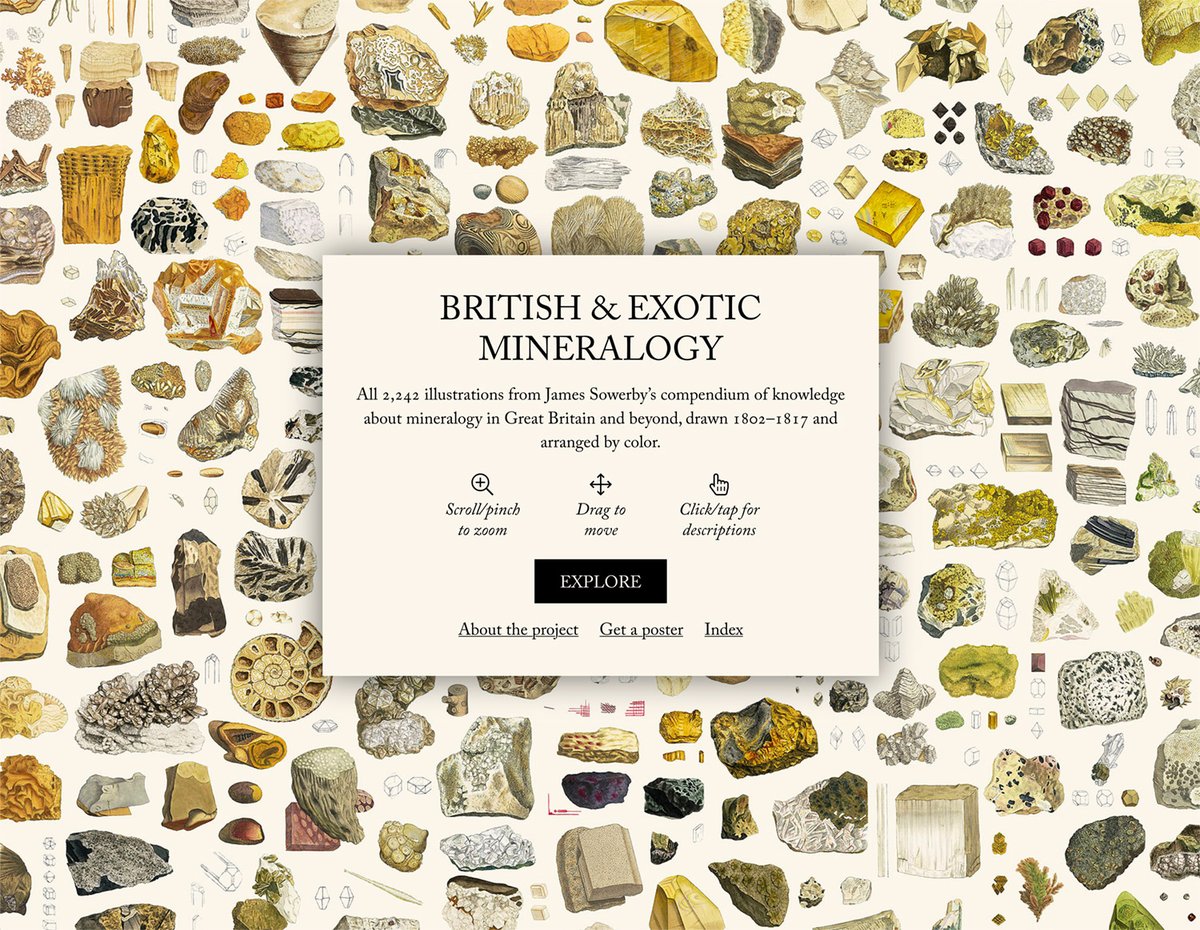
New: British & Exotic Mineralogy. A collage of all 2,242 of James Sowerby’s illustrations (1802–1817) from his compendium of knowledge about mineralogy in Great Britain and beyond arranged by color.
Explore: https://t.co/Hqw8PwSmu3
How it was made: https://t.co/prmNMklCU5
Every month we’ll be hosting a live Q&A with experienced dataviz practitioners answering questions from early career professionals. Here’s our first, focused on resumes and portfolios, featuring a panel of @DataToViz, @Jasonforrestftw & @Elijah_Meeks.
https://t.co/uVoY5zy8tl
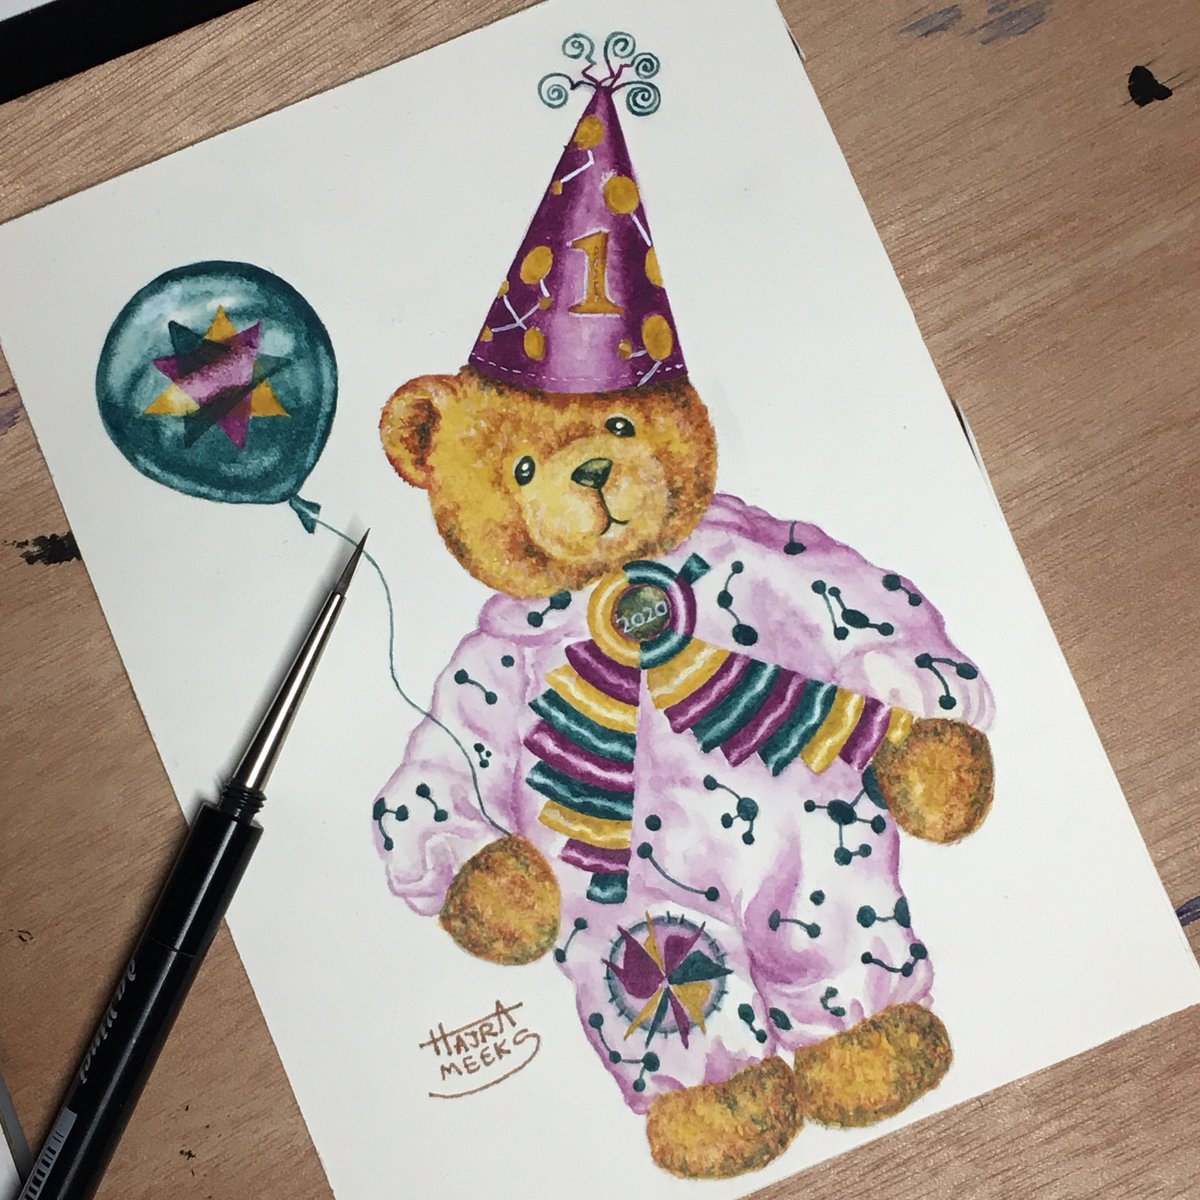
I don’t know if you heard but a year ago today we founded the @DataVizSociety and Hajra surprised me with this DVS birthday bear to wish DVS a happy bearthday.
You can see it on insta here: https://t.co/3FpzeLLbIt
#bearthday
I worked w/ @stinadacanay+@tomyumnoodz@ITP_NYU on a physical #dataviz of 16 incredible but often unknown women in computing, represented as orbs that glow brighter as they're read✨
It's our love letter to all the women & we hope you enjoy reading it 🥳
https://t.co/BISJQp3SIi
Put together a little #dataviz proof of concept during a hack week at work last week. It's a 3D faceted search UI using #reactjs, #threejs, and react-three-fiber. 50,000 objects at 60 FPS in the browser is pretty sweet!!