Conferences and workshops (online) for DataViz, Analytics, BI and UX professionals. Bringing together data designers, analysts & leaders from around the world.
How do you turn a graph into a compelling data story, and drive action? Cole Nussbaumer @storywithdata joins #PAWorldOD to show how
Last few free places available - sign up now: https://t.co/hwTtDULpV5
28 July 16:00 BST / 11:00 EDT
Online #peopleanalytics#datavisualization#HR
Thanks @Jordan_C_Morrow for an excellent final session at #DataVizLive, "Building a Data-Driven Culture and Organisation". A strong finish to a long day of outstanding #dataviz content. Catch up on everything on demand: https://t.co/og7GY2elEU
Coming up in 90mins: @SarahNRodriquez and @C_Harris07@salesforce discuss how to build a culture of #dataliteracy at your organisation. Sign up here: https://t.co/YyvsqR35uO
Read their interview with @AlDatavizguy: https://t.co/ai84VfRLQ7
Starting now - @enjalot shares advice on navigating the learning landscape in #d3js, and how to start implementing ideas you discover from other people in your own work. Sign up now and watch live: https://t.co/YyvsqR35uO
#datavizlive#datavisuialization#coding#dataviz
8pm GMT: Watch Alice Speranza @TheEconomist show how they connect offline marketing activity with digital KPIs, kicking off the final stretch of #DataVizLive. Still time to sign up + get on-demand access for 30 days.
https://t.co/2QaN5oA478
#dataviz#marketing#datavisualization
At 7pm GMT / 2pm ET today, join @MollzMP and @yuliakrolik for the @DataVizSociety Speed Networking hour at #DataVizLive. Open to all, max. 200 participants. Sign up here: https://t.co/yF8TfoR690
A hugely thought-provoking session from @jschwabish earlier, about how racial, gender and other groups are impacted by #DataViz conventions, and how to apply a more sensitive and ethical lens to your design decisions.
Watch the session here: https://t.co/qOIEksta7R #DataVizLive
Thanks @davidmpires for another great session on product design thinking for #DataViz. Now on stage: @LyndseyPereira, formerly of the Bank of England, showing how they created their highly effective animated visuals.
Catch up on (almost) everything here: https://t.co/X7Qmyvx2HE
Next up at #DataVizLive: @NadiehBremer at 12:00 GMT, showing how she created her award-winning Baby Spike visual in #d3js. Watch her live-code, learn the techniques that lead to beautiful, high-impact visuals.
Sign up to watch: https://t.co/YyvsqR35uO
https://t.co/vPXYIYbAnF
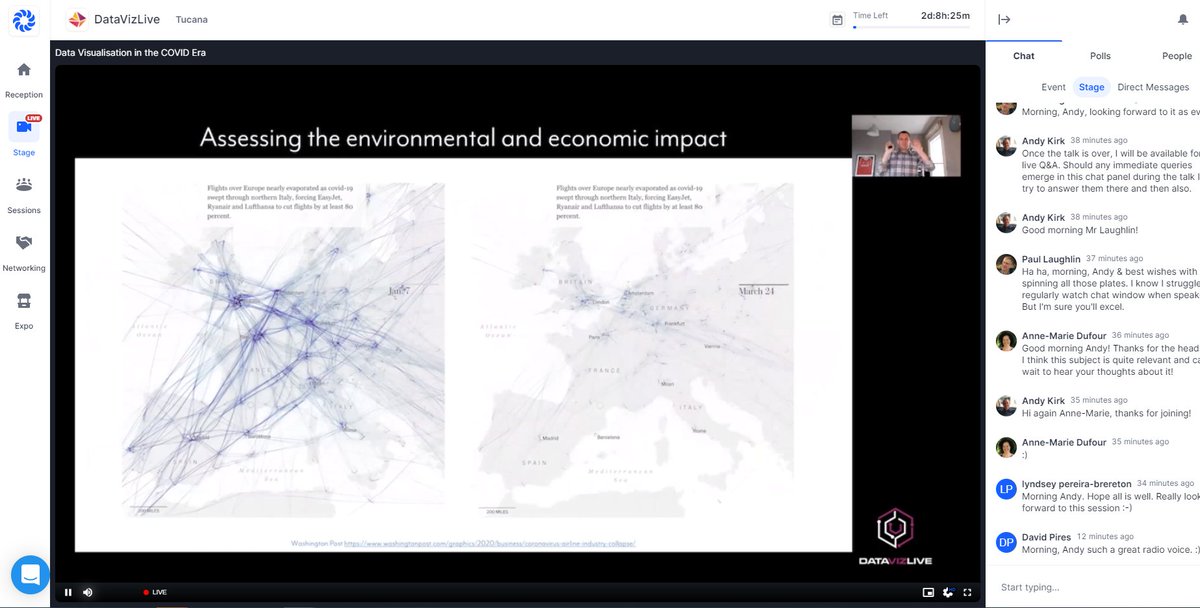
Andy Kirk made a great start at #DataVizLive, talking about how the #covid pandemic has changed how we consume data. Now on Q&A!
Next up: @stefpos and @miriamquick discussing new, art-inspired approaches you can try in #dataviz - 11:00 GMT.
Join here: https://t.co/YyvsqR35uO
30 minutes to go until Andy Kirk @visualisingdata kicks off #DataVizLive - the event is already open, looking forward to a huge day of excellent #DataViz ideas and projects. See you all there! #datafam
https://t.co/YyvsqR35uO
I’m excited to talk about learning #d3js and navigating the large online community & resources tomorrow (Nov 10) at @DataVizLive
https://t.co/KMYlNJyNx3
here is a preview of my talk where I touch on each of the 30 d3 modules
📣 We are partnering again with @DataVizLive! Their Virtual Conference event is on Nov 10 & 12, 2020!
👉 To get 25% off your registration click here: https://t.co/4LmcLQAOlz
💥 We will be hosting a DVS Speed Networking session on November 10th @ 2pm EDT.
#dataviz#conference
Learn the softer skills that analysts need to be effective in their roles and drive change in their organisation.
- Sign up for the Pro session with @LaughlinPaul at 10:00 GMT on 12 November, part of #DataVizLive
More details here: https://t.co/zxeWQbtYlk #dataviz#training
Learning #d3? How do you incorporate what you learn from others into your own work? Ian Johnson @observablehq shows the way forward, and how to find resources and communities that will help you grow. Join him at #DataVizLive on 10 Nov
https://t.co/BFNjU78uZO @enjalot#dataviz
Lyndsey Pereira-Brereton joins #DataVizLive to talk about how the Bank of England creates beautiful web-based and interactive visuals. Join the session live on 10 November - find out more and sign up here https://t.co/bWRqwQR3cX
@LyndseyPereira@f_l_o_u_r_i_s_h#dataviz