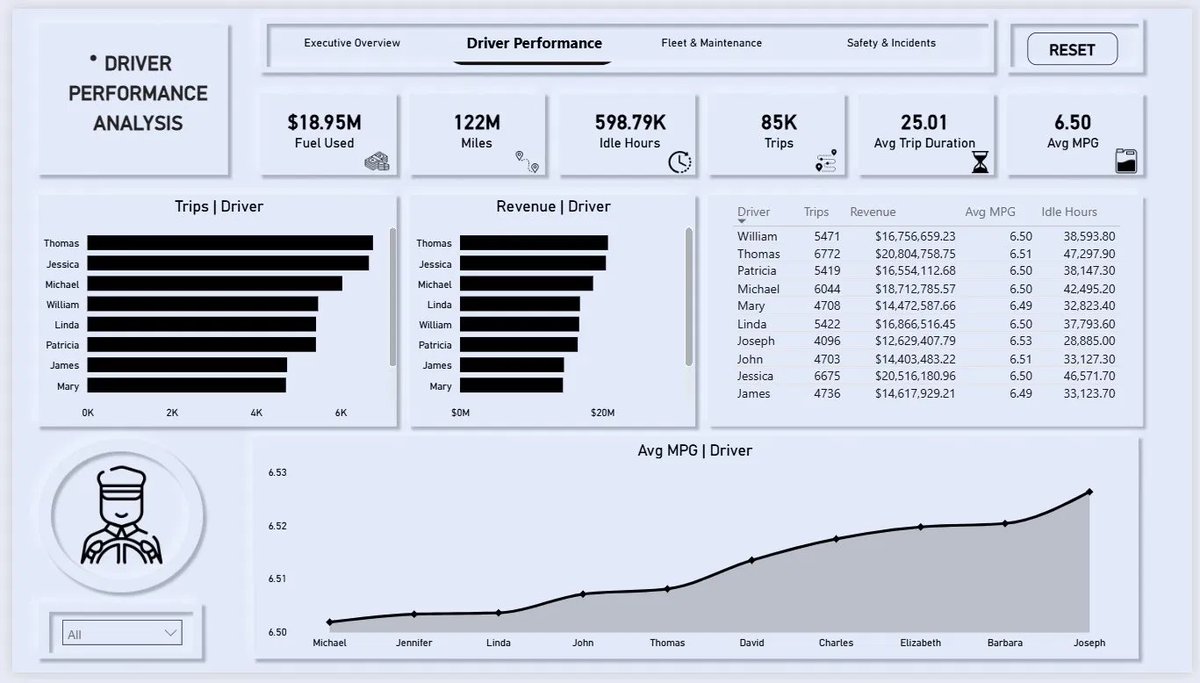
Just dropped Version 2 of my Logistics Operations Dashboard
Rebuilt from scratch with 4 fully interactive pages.
Same dataset, Completely different level.
The growth from my capstone submission to this in few weeks says everything
DataWithAkorede | Built with Power BI
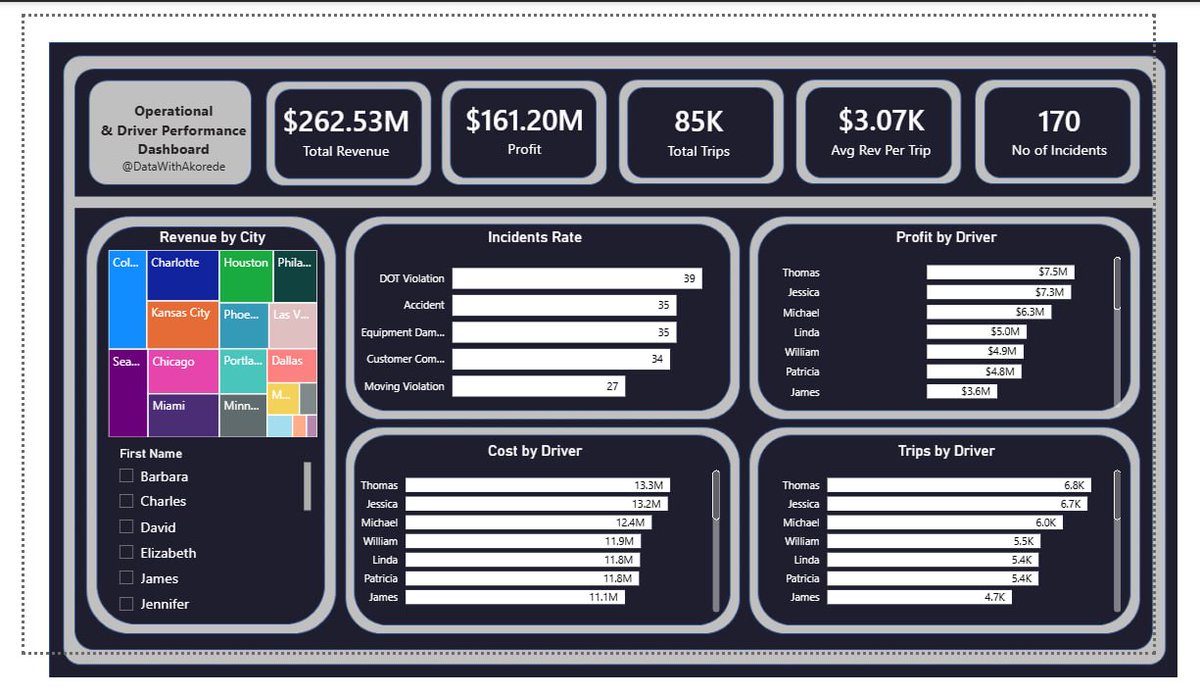
Submitted my Data Analytics Capstone at @TechSphereAcad
Built a Logistics Operational & Driver Performance Dashboard in Power BI tracking driver efficiency, operational costs, and safety metrics across a full trucking operation.
What's funny? By the time I submitted this
On the journey of recreating my old works, I made some changes here and there i reBuilt a Revenue Intelligence Report for Evergreen Store 🌿
5 visuals, 1 clear story.
DataWithAkorede | Built with Power BI
Just completed a Financial Performance Intelligence Report for Evergreen Store 📊
Built with Power BI — analyzing $2.5M in monthly gross sales, $757K profit, and a 30.32% profit margin.
Key finding: Discounts drive volume but don't consistently improve profitability 👀
Just dropped Version 2 of my Logistics Operations Dashboard
Rebuilt from scratch with 4 fully interactive pages.
Same dataset, Completely different level.
The growth from my capstone submission to this in few weeks says everything
DataWithAkorede | Built with Power BI
Submitted my Data Analytics Capstone at @TechSphereAcad
Built a Logistics Operational & Driver Performance Dashboard in Power BI tracking driver efficiency, operational costs, and safety metrics across a full trucking operation.
What's funny? By the time I submitted this