Data Analyst | Social Media Manager | Content Creator
Help businesses and organizations shine and thrive online. Let's connect grow your online presence✨
Please get your copy below instantly:
📌Retweet & share.
📌Like & reply "yes".
📌Follow.
Click the link below and sign up for a copy:
https://t.co/n2xGvJFsS1
But here's the thing - I'm still learning,I know my favorite tool will probably change as I grow and discover new ones such as SQL, SPSS, Tableau, Python and the list goes on
So, I want to hear from you what are your favorite data tools and resources?
Data_Duchess❤️
3/3
Another day as a data analyst ❤️
As a data analyst, I'm constantly learning and exploring new resources.
But for now, I'm obsessed with Power BI!
I know, I know, it's not the flashiest tool out there😂
But it's been a total game-changer for me. Here is my reasons:
1/3
If you haven't started, NOW is the time to start🔥🔥
✅Never relent
✅Never give up
✅Be focused
Who is on this table with me?⬆️
Share the lessons you have learnt within this week 👇
Yours Truly,
Data_Duchess❤️
#Learning#DataEnthusiast#DataAnalyst#Projects
Avoid falling into this trap👇
Learning is a Journey 💡
I mean the day you stop learning is the day you die!
Do you agree with me?🤷
As a Data Analyst and a social media manager, I learn everyday, work on projects, read books, take courses that would sharpen my skills✨
1/2
How I Went from being overwhelmed by Data to Data Clarity⬆️
Let's talk about data.
I used to feel like I was drowning in spreadsheets, trying to make sense of it all🤷
But then I realized something that data is just a story, waiting to be told.
#BusinessIntelligence
1/4
Focus on the story behind the numbers
✅ Use data to inform, not dictate, your decisions
This mindset change has really helped me in so many ways.
I'm no longer overwhelmed by data, and I'm able to make better decisions that drive growth and improve lives
#DataScience
3/4
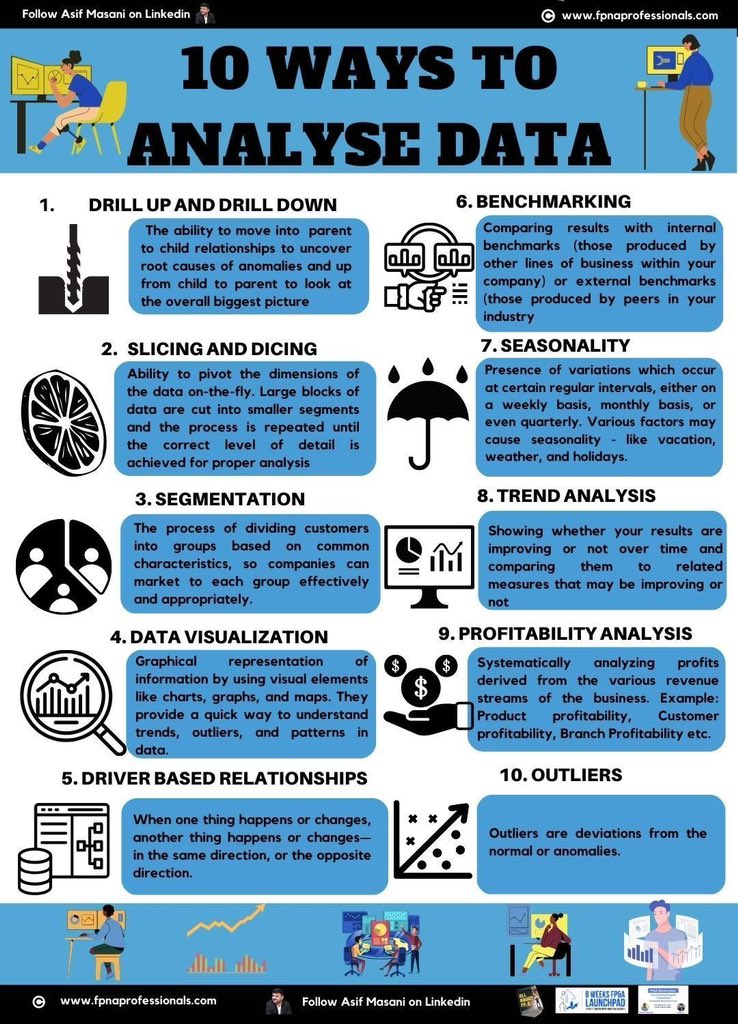
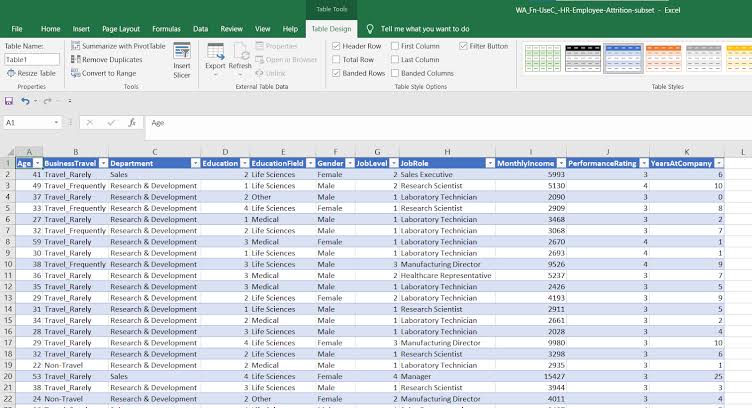
Detailed Roadmap to become a Data Analyst
1. Foundation Skills
Strengthen Mathematics:
- Focus on statistics relevant to data analysis such as descriptive statistics, probability distributions, hypothesis testing, regression, and correlation.
Resources:
Khan Academy Statistics and Probability
“Statistics for Business and Economics” by Paul Newbold, William L. Carlson, and Betty Thorne
- Excel Basics:
Master fundamental Excel functions and formulas including SUM, AVERAGE, VLOOKUP, INDEX, and MATCH.
Resources:
Microsoft Excel Documentation
Excel Skills for Business Specialization by Macquarie University on Coursera
2. SQL Proficiency
Learn SQL Basics:
Understand SELECT statements, JOINs, and filtering.
Resources:
W3Schools SQL Tutorial
“SQL for Data Analytics” by Upom Malik, Matt Goldwasser, and Benjamin Johnston
- Practice Database Queries:
Work with databases like MySQL or PostgreSQL to retrieve and manipulate data.
Resources:
Mode Analytics SQL Tutorial
SQLZoo
3. Excel Advanced Techniques
Data Cleaning in Excel:
- Learn to handle missing data and outliers using techniques such as conditional formatting, data validation, and text functions.
Resources:
Excel Data Cleaning Tutorials on YouTube
- PivotTables and PivotCharts:
Master these tools for data summarization and analysis.
Resources:
Microsoft’s PivotTable Tutorial
Excel Campus YouTube Channel
4. Data Visualization with Excel
Create Visualizations:
Learn to build charts and graphs such as bar charts, line charts, and scatter plots.
Resources:
Excel Easy Chart Tutorials
Dashboard Creation:
Understand how to design effective dashboards that communicate insights clearly.
Resources:
https://t.co/NqsaewXSBD Dashboard Course
5. Power BI Introduction
Install and Explore Power BI:
- Familiarize yourself with the interface and basic functionalities.
Resources:
Microsoft Power BI Guided Learning
Udemy Power BI A-Z: Hands-On Power BI Training
Import Data:
Learn to import and transform data using Power BI.
Resources:
Power BI Desktop Documentation
6. Power BI Data Modeling
Relationships:
Understand and establish relationships between tables in Power BI.
Resources:
Power BI Data Modeling Documentation
- DAX (Data Analysis Expressions):
Learn the basics of DAX for calculations and data manipulation.
Resources:
https://t.co/wt3KrOG1og DAX Guide
“The Definitive Guide to DAX” by Marco Russo and Alberto Ferrari
7. Advanced Power BI Features
Advanced Visualizations:
Explore complex visualizations in Power BI such as maps, funnel charts, and custom visuals.
Resources:
Microsoft Power BI Advanced Visualization Techniques Course
Custom Measures and Columns:
Utilize DAX for customized data calculations and creating new columns.
Resources:
Enterprise DNA’s YouTube Channel
8. Integration of Excel, SQL, and Power BI
Importing Data from SQL to Power BI:
Practice connecting and importing data from SQL databases.
Resources:
Microsoft Learn Power BI and SQL Integration
- Excel and Power BI Integration:
Learn how to use Excel data in Power BI and vice versa.
Resources:
Power BI Documentation on Excel Integration
9. Business Intelligence Best Practices
Data Storytelling:
Develop skills in presenting insights effectively through clear and compelling narratives.
Resources:
“Storytelling with Data” by Cole Nussbaumer Knaflic
DataCamp’s Data Storytelling Course
- Performance Optimization:
Optimize reports and dashboards for efficiency and speed.
Resources:
Microsoft’s Power BI Performance Optimization Guide
10. Build a Portfolio
Showcase Excel Projects:
Highlight your data analysis skills using Excel.
Resources:
Build sample projects based on open datasets from Kaggle or https://t.co/Xfouuk2NVp
Power BI Projects:
Feature Power BI dashboards and reports in your portfolio.
Resources:
Create dashboards based on real-world scenarios from Kaggle datasets