I joined NoPixel in 2018, couldn't make phone calls, inventory was primitive, voice chat sounded like a call of duty lobby and the server had 32 players maximum.
But yet, it was such an amazing place, and wasnt surprised when it blew up in 2021, NoPixel the 🐐
A useful tool I use to spot when the market is due for a breather, or due for a bounce.
Top panel is $VXV divided by $VIX. In plain English: 3-month volatility divided by 1-month volatility. It tells you how the options market is pricing the short term relative to the medium term.
Here's how I use it:
When the ratio gets above 1.20, that means back month vol is more than 20% above front month. The short term has gone quiet and the market is usually feeling pretty comfortable. That's when I start preparing for a consolidation or pullback.
When it drops below 1.00, front month vol has spiked above back month. Short-term fear is getting priced in. That's when I start preparing for a bounce or sideways chop.
We're sitting at 1.18 right now with the SPX at all-time highs. Not in the zone yet, but close enough that it's on my radar.
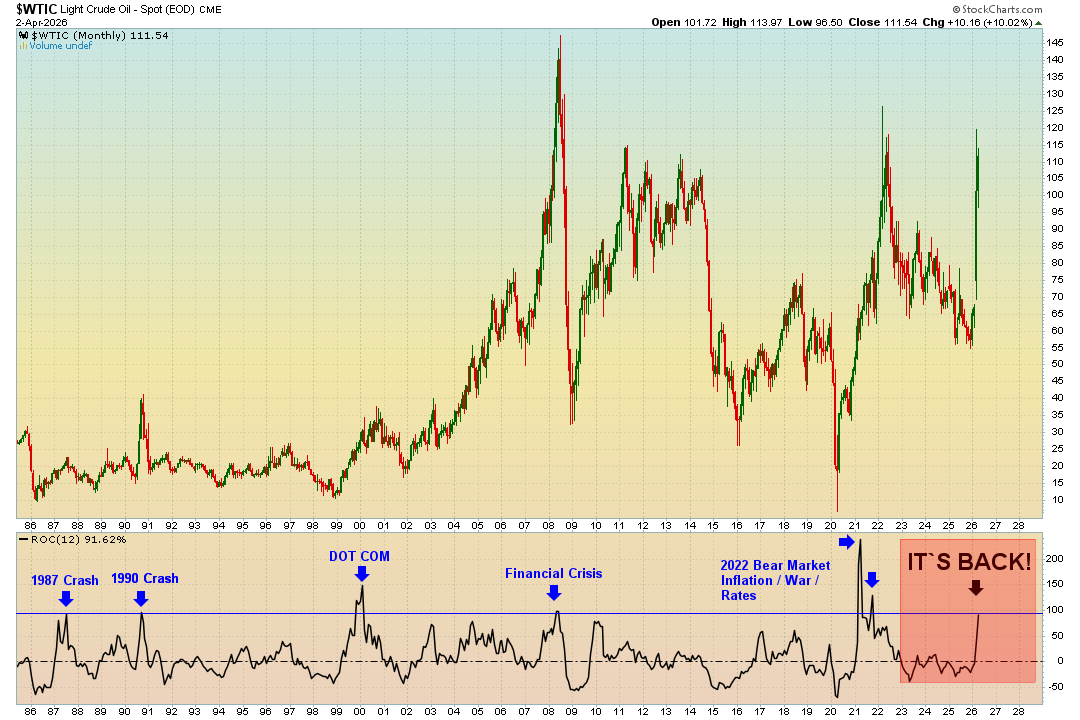
Nobody is talking about the 12 month rate of change on oil right now. They should be.
WTI crude's ROC(12) just spiked to over 91%. Let me show you what happened every other time it did this.
- 1987 Crash.
- 1990 Crash.
- Dot Com Bust.
- 2008 Financial Crisis.
- 2022 Bear Market.
Every single spike of this magnitude on the 12 month rate of change has led to something breaking. Every. Single. Time.
Do you really think this time we just walk away unscathed?
This is your warning shot.
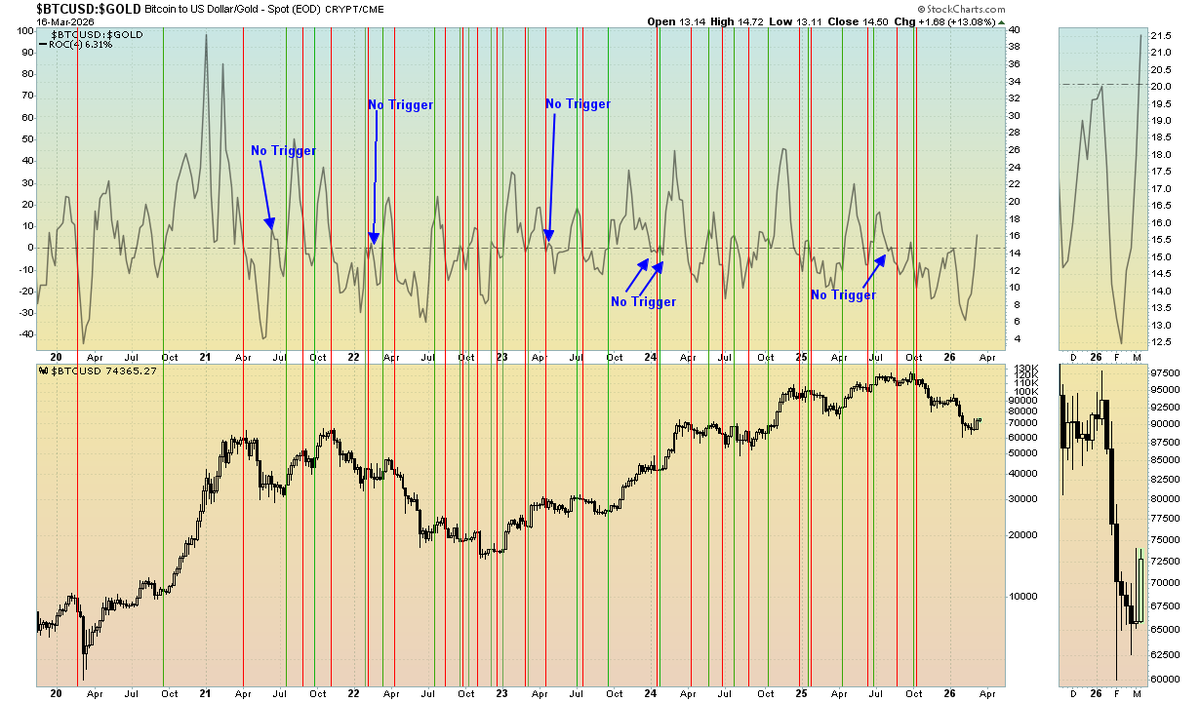
If I had to keep only one tool for spotting major Bitcoin turning points, it would be my “Saylor to Schiff” BTC vs Gold indicator.
It just fired a fresh BUY signal / Trigger, the first since the October 2025 sell trigger.
Could it be a whipsaw? Absolutely. No signal is perfect. But when this thing moves, it has historically lined up with some of the most important regime shifts in BTC vs gold. The messy chart is intentional, it shows every buy, sell, and non-trigger so you can judge it for yourself.
Next post: video breakdown of the logic behind this indicator and how I’m positioning around it.
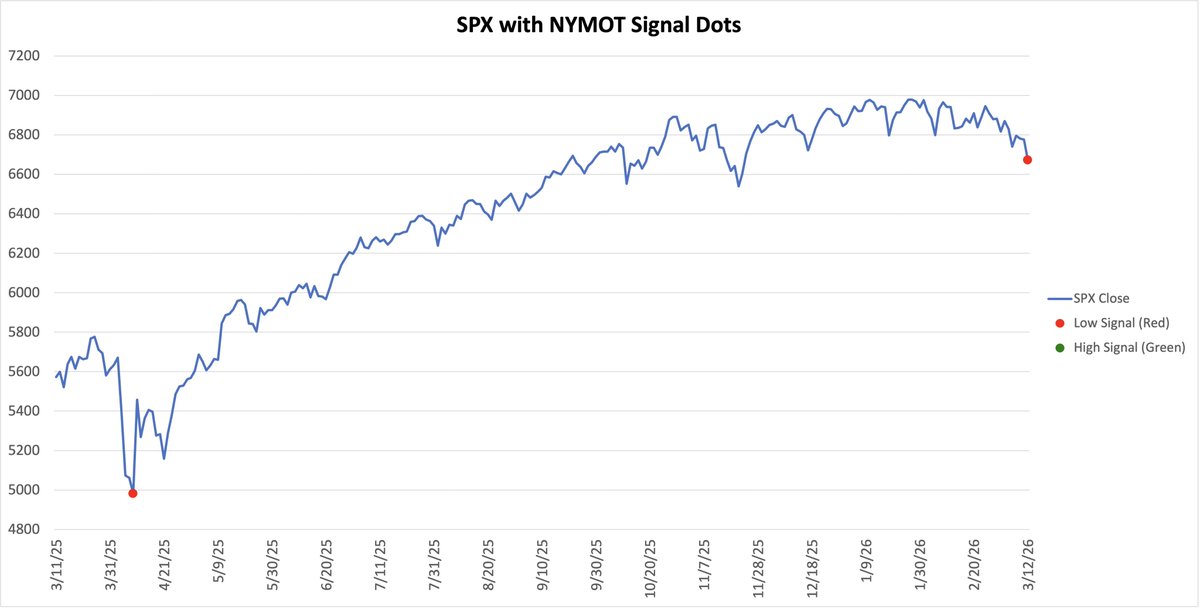
I pulled up a chart today that made me sit up straight.
NYSE McClellan Oscillator percentile ranked over 3 years. Current reading: 1.4. That means it was higher 98.6% of the time.
The only other time it got about this low? April 2025. Right near the bottom.
Not a prediction. Just a signal worth paying attention to.