Peter Lynch’s real edge was never about predicting tomorrow’s stock price.
His real edge was understanding one simple idea:
Before you buy a stock, you must understand the company.
Too many investors only look at charts, headlines, or trending tickers. But a stock is not just a symbol on a screen. A stock represents a real business.
If you don’t understand how the company makes money, where its growth comes from, who its customers are, and why it can keep winning, then you are not investing. You are gambling.
The best stocks usually have a few things in common:
Clear business model.
Consistent revenue and earnings growth.
Strong industry position.
Reasonable valuation.
Real competitive advantage.
A market that has not fully priced in the long-term story.
That is why I focus on the business behind the ticker.
$NVDA is not just a chip company. It is the backbone of AI infrastructure.
$MSFT is not just a software company. It is a cloud, enterprise AI and productivity ecosystem.
$AAPL is not just an iPhone company. It is a global hardware, services and user ecosystem.
$TSM is not just a manufacturer. It is the foundation of advanced chip production.
$AVGO is not just a semiconductor company. It is a key player in AI networking and custom chips.
Peter Lynch’s lesson is clear:
A great stock is not great because everyone is talking about it.
A great stock is great because the company’s long-term growth logic is clear.
Retail investors do not have more capital than institutions, but they do have one advantage: flexibility.
Institutions are often limited by size, liquidity, mandates, and quarterly performance pressure.
Individual investors can research earlier, move faster, and hold with more patience when the long-term story remains intact.
Real stock picking is not about chasing hype.
It is about asking:
What does this company do?
Where does its revenue growth come from?
Does it have a real competitive moat?
Is valuation still reasonable?
If the stock drops, has the business actually changed?
Would I still want to own it after a market correction?
Short-term prices are driven by emotion.
Long-term stock performance is driven by earnings, growth, and business quality.
That is the core of Peter Lynch’s investment philosophy:
You are not buying a ticker.
You are buying the future growth of a business.
The market will always have hype.
What matters is whether you can see the real business before the crowd fully prices it in.
$WDC is no longer just a storage stock. 🚨📊
On the 15-minute chart, Western Digital made a strong move from the 520 area and pushed all the way toward 602.
That was a powerful momentum leg.
Now the stock has pulled back and is trading around 590, which means it is no longer in a clean vertical breakout phase.
It is now in a retest and recovery zone.
The first area I am watching is 588–592.
If $WDC can hold this zone and reclaim strength above 592, the short-term recovery remains healthy.
The key support is 584–585.
If price loses that area, I would become more cautious because the pullback may extend toward 579–580.
But this is bigger than one chart.
When $WDC moves, the market usually starts watching the AI storage and data center infrastructure chain:
$MU — AI memory and HBM
$STX — data storage demand
$NVDA — AI GPUs create massive data demand
$AMD — AI accelerators and data center chips
$DELL — AI servers
$SMCI — AI server infrastructure
$AVGO — custom AI chips + networking
$MRVL — AI networking + data movement
$AMAT $LRCX $KLAC — semiconductor equipment
$SMH $SOXX — semiconductor ETFs
My view is simple:
AI is not only about GPUs.
AI also needs memory, NAND, storage, servers, networking, and massive data infrastructure.
That is where $WDC becomes important.
The chart had a strong run.
Now I want confirmation.
Hold 588–592 → recovery stays alive.
Lose 584–585 → risk increases.
I would rather wait for support confirmation than chase after a vertical move. 🚀📊
Not financial advice.
$KLAC is showing a powerful semiconductor equipment signal today. 🚨📊
This chart is not just about one stock moving higher.
On the 15-minute chart, KLA pushed out of the 1,900–1,948 consolidation zone, reclaimed momentum, and then accelerated into the 2,087–2,103 high area.
That tells me buyers are rotating into semiconductor equipment names again.
Right now, $KLAC is still holding near the upper range, but after this kind of move, I do not want to chase emotionally at the top.
The levels I am watching:
First support: 2,071–2,072
If $KLAC pulls back and holds this area, the short-term bullish structure remains strong.
Key support: 2,051–2,052
As long as $KLAC stays above this zone, the broader short-term trend remains intact.
If $KLAC continues to hold near the highs, the market may start watching the entire semiconductor equipment and AI chip supply chain.
Related names to watch:
$ASML — advanced lithography
$AMAT — semiconductor process equipment
$LRCX — etch and deposition tools
$TSM — advanced chip manufacturing
$INTC — foundry expansion
$NVDA — AI GPU demand
$AMD — AI accelerators
$AVGO — custom AI chips and networking
$MRVL — AI networking and custom silicon
$MU — AI memory and HBM
$SMH $SOXX — semiconductor ETFs
My view is simple:
AI demand does not stop at GPUs.
It spreads into fabs, wafers, inspection, process control, equipment, memory, networking, and the entire semiconductor infrastructure layer.
That is why $KLAC matters.
KLA is not just an equipment stock.
It is one of the key companies behind advanced chip yield, inspection, and manufacturing quality.
Strong chart.
Strong sector signal.
Strong AI supply-chain read-through.
But after a sharp move, entry price still matters.
I would rather wait for support confirmation than chase near the high. 🚀📊
Not financial advice.
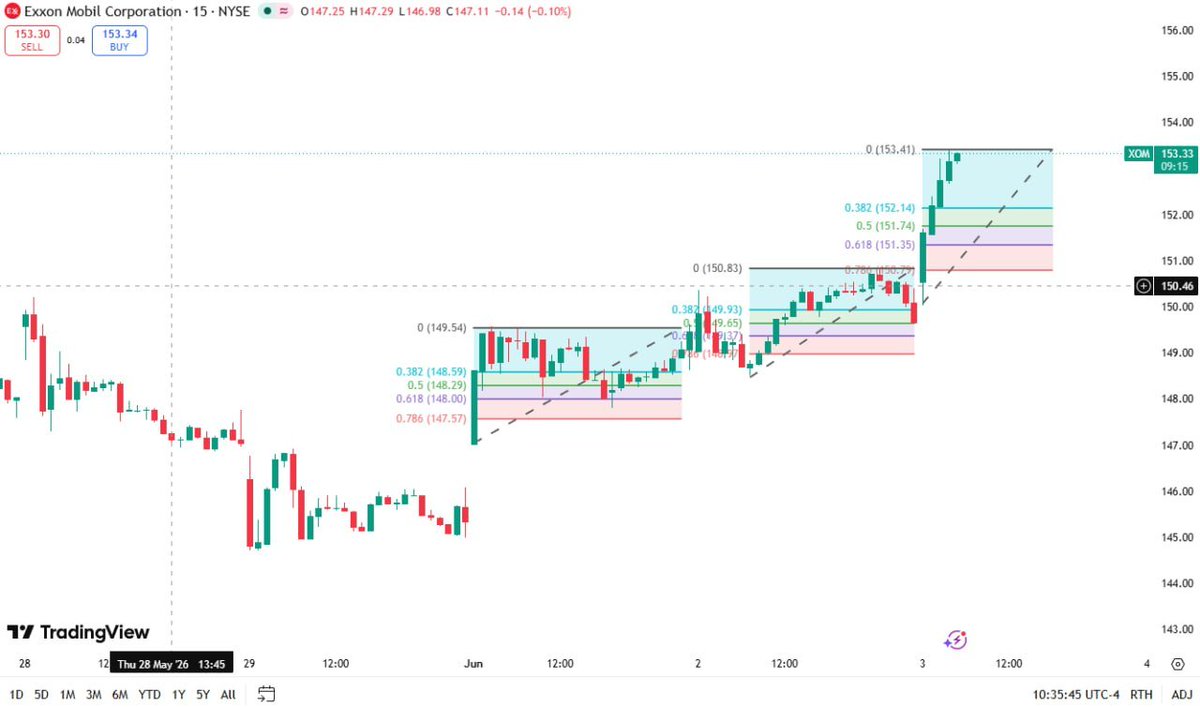
$XOM is giving a clean energy-sector breakout signal today. 🚨📊
On the 15-minute chart, Exxon Mobil moved out of the 148–150 consolidation range and pushed straight into the 153 area.
That tells me buyers are rotating into energy again.
This is not weak price action.
It is a clear short-term bullish breakout.
But after a fast move, I do not want to chase blindly near the top.
The level I am watching first is 152.1.
If $XOM pulls back and holds around 152.1, it means buyers are still defending the breakout.
The key support is 150.7–150.8.
As long as $XOM stays above that zone, the short-term bullish structure remains intact.
But this is not just about Exxon.
When $XOM moves, the market usually starts watching the entire energy chain:
$CVX — integrated oil major
$COP — upstream oil and gas
$OXY — oil production + Berkshire-linked energy play
$EOG — shale oil leader
$FANG — Permian Basin exposure
$SLB — oilfield services
$HAL — drilling and services
$BKR — energy technology + LNG services
$LNG — natural gas export theme
$XLE — energy sector ETF
$XOP — oil & gas exploration ETF
My view is simple:
If energy stocks start breaking out while tech is still strong, the market may be broadening beyond AI.
That matters.
$XOM is not just an oil stock.
It is a cash flow, dividend, energy security, and inflation hedge name.
Strong chart.
Strong energy rotation signal.
Strong sector read-through.
But entry price still matters.
I would rather wait for support confirmation than chase after a fast move. 🚀📊
Not financial advice.
$CRWD is not giving a simple “breakout” signal right now.
It is giving a recovery signal after a sharp pullback. 🚨📊
CrowdStrike had a strong move from the 670 area and pushed all the way to 785.
That was the momentum leg.
But after hitting 785, the stock pulled back hard toward 745, which means the first strong move already triggered profit-taking.
Now the important part:
$CRWD has recovered back to around 769 and is trying to rebuild strength.
The level I am watching first is 766.
If $CRWD holds above 766, the short-term recovery remains alive.
The key support is 757–758.
If price loses that area, the recovery structure weakens, and I would become more cautious.
On the upside, 771 is the first level bulls need to reclaim.
If $CRWD can hold above 771, the next area to watch is 777–786.
But this is not only about CrowdStrike.
When $CRWD moves, the market usually starts watching the entire cybersecurity and AI security basket:
$PANW — enterprise cybersecurity
$ZS — zero trust security
$FTNT — network security
$S — endpoint security
$OKTA — identity security
$NET — cloud security and edge network
$DDOG — cloud monitoring and security
$CYBR — privileged access security
$QLYS — vulnerability management
$MSFT — enterprise security and AI security platform
My view is simple:
Cybersecurity is no longer just an IT spending category.
It is becoming one of the most important layers of the AI economy.
More AI agents.
More cloud workloads.
More data movement.
More attack surfaces.
That means security demand does not disappear.
$CRWD is still one of the core names in this space.
The chart is recovering.
The sector story is strong.
But confirmation matters.
I want to see 766 hold and 771 reclaim before calling this a clean continuation. 📊🔥
Not financial advice.
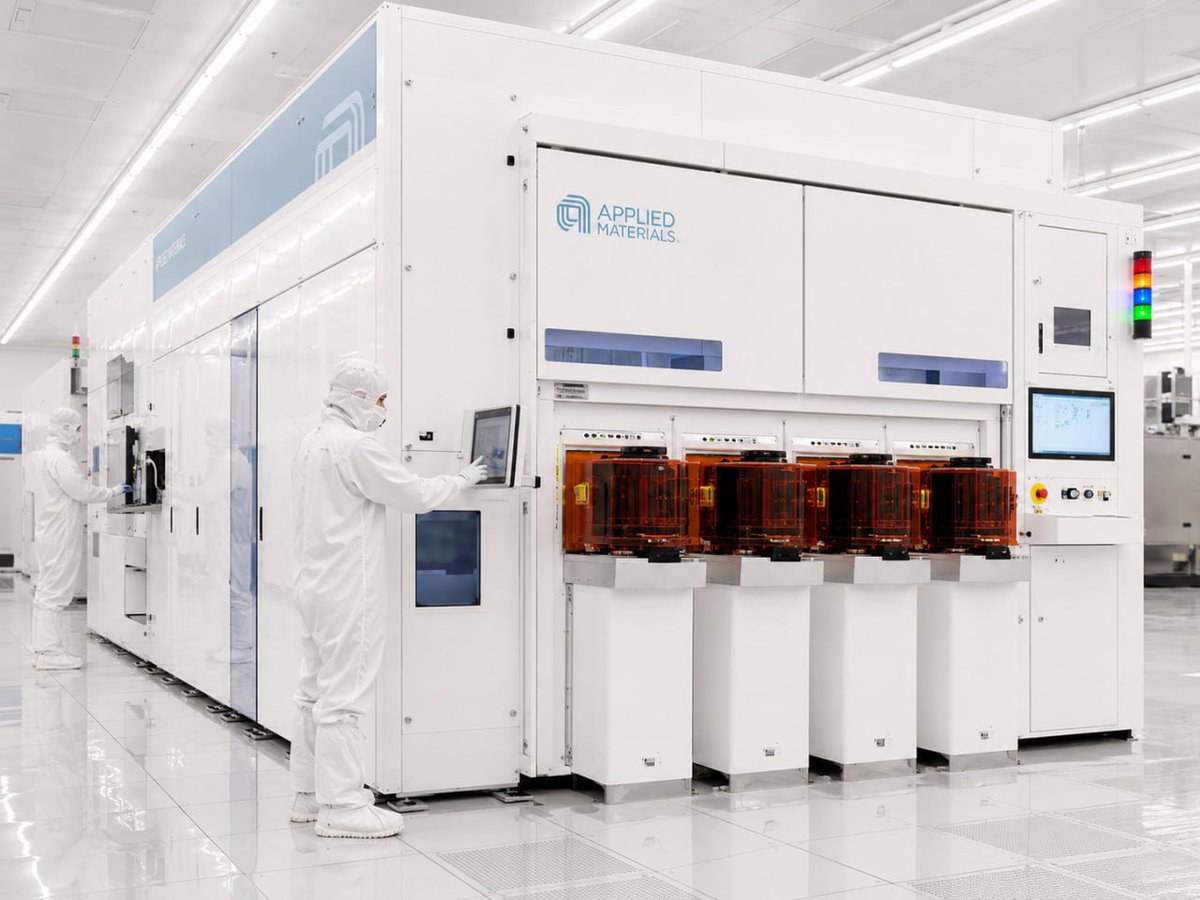
$AMAT is showing real strength inside the semiconductor equipment trade. 🚨📊
On the 15-minute chart, Applied Materials broke out from the 448–454 consolidation zone, reclaimed the 463–464 area, and pushed all the way toward 491.
That is a clean momentum move.
Right now, $AMAT is trading near the highs around 489–490. Buyers are still in control, but after this kind of move, I would not chase blindly at the top.
The level I am watching first is 480.
If $AMAT pulls back and holds around 480, it would show that buyers are still defending the breakout.
The real key support is 473.
As long as $AMAT stays above 473, the short-term bullish structure remains intact.
But this is not just about one stock.
When $AMAT moves like this, the market usually starts watching the entire semiconductor equipment and AI chip supply chain.
Related names to watch:
$ASML — EUV lithography
$LRCX — etch and deposition tools
$KLAC — inspection and process control
$TSM — advanced chip manufacturing
$INTC — foundry expansion
$NVDA — AI GPU demand
$AMD — AI accelerators
$AVGO — custom AI chips and networking
$MRVL — AI networking and custom silicon
$MU — AI memory and HBM
$SMH $SOXX — semiconductor ETFs
My view is simple:
AI chip demand does not stop at GPUs.
It spreads into fabs, tools, wafers, advanced processes, memory, networking, and full semiconductor capex.
That is why $AMAT matters.
Strong chart.
Strong sector rotation.
Strong AI infrastructure read-through.
But after a sharp move, entry price still matters.
I would rather wait for a clean pullback near support than chase strength at the top. 🚀📊
Not financial advice.
$ASML is not just another semiconductor name. 🚨📊
The 15-minute chart is showing a strong short-term recovery.
ASML bounced from the 1,647 area, pushed all the way back toward 1,708, and is now trading near the highs around 1,704–1,705.
That tells me buyers are still active.
But this is not a low-risk chase zone anymore.
The stock is already close to the short-term high, so I want to see support hold before getting too aggressive.
The levels I am watching:
First support: 1,684–1,685
If $ASML holds this area, the short-term bullish structure remains healthy.
Key support: 1,670–1,671
As long as $ASML stays above this zone, the broader short-term structure remains intact.
If ASML continues to stay strong near the highs, the market will not only watch $ASML.
It will start watching the entire semiconductor equipment and AI chip supply chain.
Related names to watch:
$AMAT — semiconductor equipment
$LRCX — etch and deposition tools
$KLAC — inspection and process control
$TSM — advanced chip manufacturing
$INTC — foundry expansion
$NVDA — AI GPU demand
$AMD — AI accelerators
$AVGO — custom AI chips and networking
$MRVL — AI networking and custom silicon
$MU — AI memory and HBM
$SMH $SOXX — semiconductor ETFs
My view is simple:
ASML is one of the biggest bottleneck companies in advanced semiconductor manufacturing.
If AI chip demand keeps growing, the world needs more advanced nodes, more EUV capacity, more fabs, and more semiconductor capex.
That is why $ASML matters.
Strong chart.
Strong semiconductor cycle signal.
Strong AI infrastructure read-through.
But entry price still matters.
I would rather wait for support confirmation than chase strength near the top. 🚀📊
Not financial advice.
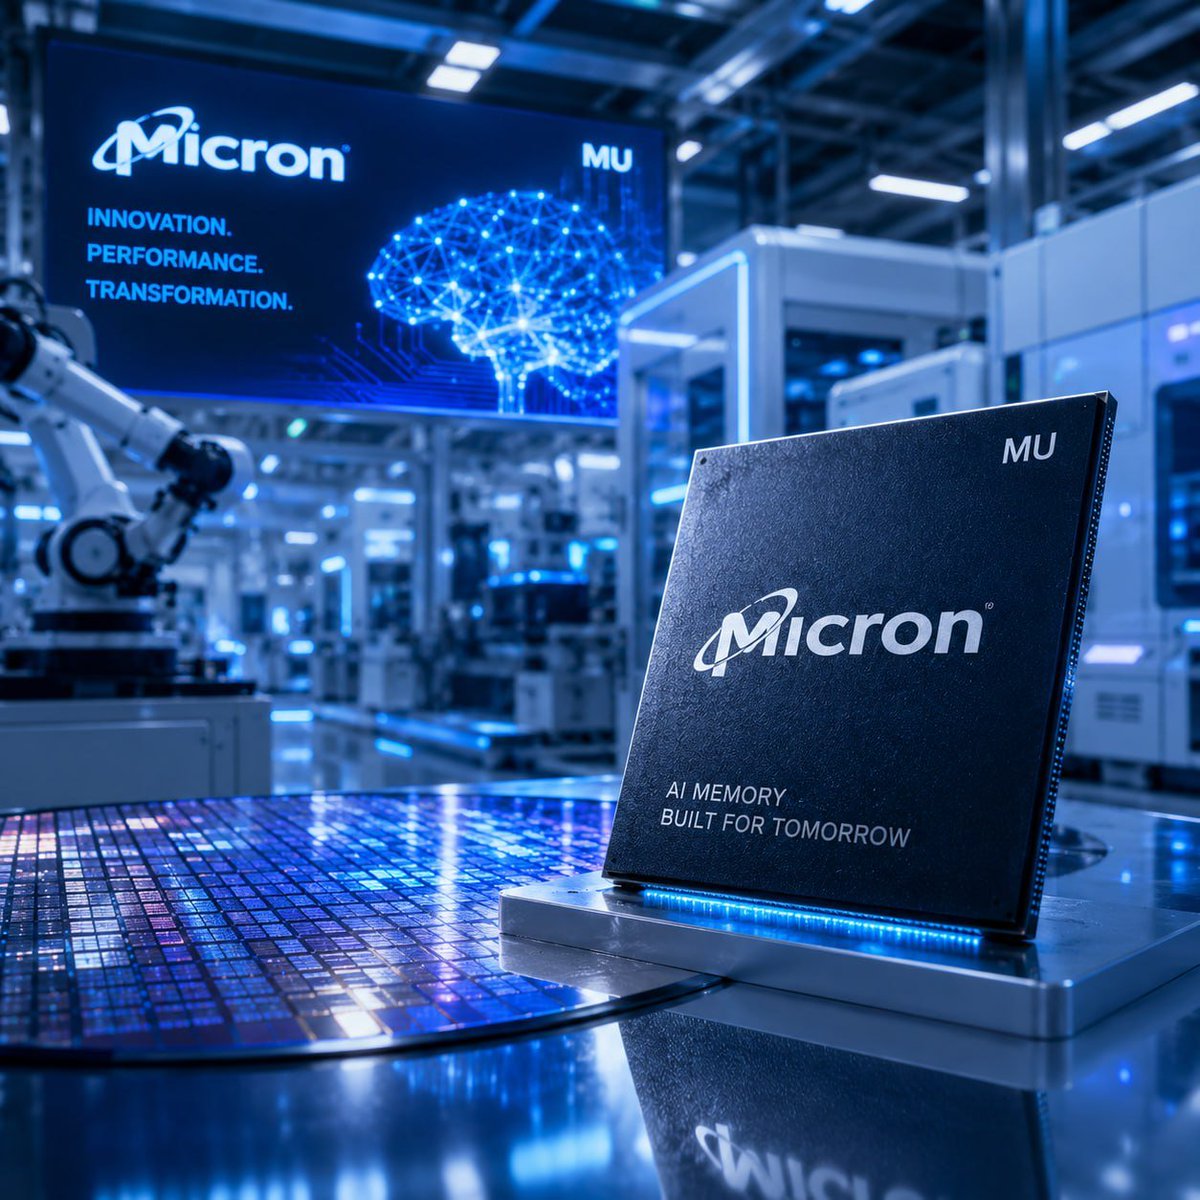
$MU is showing another strong AI memory signal today. 🚨📊
On the 15-minute chart, Micron moved from the 1,010 area and pushed all the way toward 1,076.
That is not weak price action.
It is a clear short-term bullish structure driven by strong buying pressure.
Right now, $MU is trading around 1,064 after pulling back from the high.
This looks more like a high-level consolidation after a strong move, not a clean breakdown.
The levels I am watching:
First support: 1,054–1,055
If $MU holds this zone, the short-term trend remains strong.
Key support: 1,040–1,041
As long as $MU stays above this area, the bullish structure is still intact.
But this is bigger than just Micron.
When $MU moves higher, the market usually starts looking at the entire AI memory and data center supply chain.
Related names to watch:
$NVDA — AI GPUs need massive HBM
$AMD — AI accelerators and data center chips
$AVGO — custom AI chips + networking
$MRVL — AI networking + custom silicon
$TSM — advanced chip manufacturing
$DELL — AI servers
$WDC — NAND and storage exposure
$STX — data storage demand
$AMAT $LRCX $KLAC — semiconductor equipment
$SMH $SOXX — semiconductor ETFs
My view is simple:
AI is not only about GPUs anymore.
The next layer is memory, HBM, storage, servers, networking, and full data center infrastructure.
That is why $MU matters.
Strong chart.
Strong AI memory story.
Strong semiconductor momentum.
But after a big move, entry price still matters.
I would rather wait for support confirmation than chase strength at the top. 🚀📊
Not financial advice.
$TSM is sending an important signal to the AI semiconductor chain. 🚨📊
On the 15-minute chart, TSMC made a strong move from the 417 area and pushed all the way toward 449.
After that move, price pulled back, found support, and is now trading around 444–445.
This does not look like a clean breakdown.
It looks more like a high-level retest after a strong breakout.
The key levels I am watching:
Support: 443.7
If $TSM holds above this area, short-term momentum remains bullish.
Key support: 440.9
If price loses this level, the recovery structure weakens.
But the bigger point is this:
$TSM is not just one stock.
It is the manufacturing backbone of the AI chip cycle.
When $TSM moves, the market starts watching the entire semiconductor supply chain:
$NVDA — AI GPUs
$AMD — AI accelerators
$AVGO — custom AI chips + networking
$MRVL — AI networking + custom silicon
$AAPL — Apple Silicon
$QCOM — mobile + edge AI chips
$ASML — EUV lithography
$AMAT — semiconductor equipment
$LRCX — etch and deposition tools
$KLAC — inspection and process control
$SMH $SOXX — semiconductor ETFs
My view is simple:
If $TSM holds support, it tells the market AI semiconductor demand is still strong.
This is not just a TSMC chart.
This is a read-through for the entire AI chip supply chain. 🚀📊
Not financial advice.
$LRCX is showing something important today. 🚨📊
This is not just a single-stock move.
On the 15-minute chart, Lam Research moved from a tight consolidation zone around 310–320 and pushed straight into the 335–336 area.
That tells me buyers are rotating into semiconductor equipment names again.
The stock is now near the short-term high, so I would not chase blindly at the top. But the structure is still strong.
The level I am watching first is 330.
If $LRCX pulls back and holds around 330, that would show buyers are still defending the breakout.
The real line in the sand is 326–327.
As long as $LRCX stays above that area, the short-term bullish structure remains alive.
If it breaks and holds above 336, the next upside leg could start.
But the bigger message is this:
When $LRCX moves, the market is not only looking at one company.
It is looking at the whole semiconductor equipment cycle.
Related names to watch:
$ASML — advanced lithography
$AMAT — semiconductor process equipment
$KLAC — inspection and process control
$TSM — advanced chip manufacturing
$INTC — foundry expansion
$NVDA — AI GPU demand
$AMD — AI accelerators
$AVGO — custom AI chips and networking
$MRVL — AI networking and custom silicon
$MU — AI memory and HBM
$SMH $SOXX — semiconductor ETFs
My take:
If AI chip demand keeps growing, the world needs more fabs, more tools, more advanced processes, and more semiconductor capex.
That is why equipment names like $LRCX matter.
The chart is strong.
The sector rotation is real.
The AI supply chain is still active.
But I want support confirmation, not emotional chasing. 🚀📊
Not financial advice.
$ASML short-term structure is still bullish, but momentum is not as aggressive as some AI chip leaders. 🚨📊
On the 15-minute chart, ASML rebounded from the 1,588 area and pushed toward 1,646.
Now the stock has pulled back and is trading around 1,628, which means the market is testing support after the move.
This does not look like a full breakdown yet.
It looks more like a pullback confirmation phase after a strong intraday move.
My plan is simple:
First support: 1,624–1,625
If $ASML holds this area, the short-term bullish structure remains healthy.
Key support: 1,610–1,612
As long as $ASML holds above this zone, the broader short-term structure remains intact.
If $ASML breaks and holds above 1,646–1,647, the next upside move could open.
But this is not only about $ASML.
ASML is one of the most important companies in the entire semiconductor supply chain because advanced chips need advanced lithography.
When $ASML moves higher, the market often starts watching the broader semiconductor equipment and AI chip ecosystem:
$AMAT — semiconductor equipment
$LRCX — etch and deposition tools
$KLAC — process control and inspection
$TSM — advanced chip manufacturing
$INTC — advanced manufacturing and foundry push
$NVDA — AI GPU demand
$AMD — AI accelerators and data center chips
$AVGO — custom AI chips and networking
$MRVL — AI networking and custom silicon
$MU — AI memory and HBM
$SMH $SOXX — semiconductor ETFs
My view is simple:
$ASML is not just a chip equipment stock.
It is a bottleneck company for advanced semiconductor manufacturing.
If AI chip demand keeps growing, the world needs more advanced nodes, more EUV exposure, and more semiconductor capex.
Trend is still constructive.
Support is being tested.
Semiconductor demand remains the bigger story.
I would rather wait for support confirmation than chase after a fast move. 🚀📊
Not financial advice.
$AVGO was a perfect example of why I focus on structure. 🚨
Before the move, the chart was already giving the signal.
The pullback was controlled.
Support was holding.
There was no real breakdown.
Buyers were still defending the trend.
Then the market opened, and $AVGO moved hard.
$459.97 → $481.30
+$21.33
+4.64%
At the open, it even pushed to $488.79, around +6.27% from the level I was watching.
The market rewards preparation.
Not emotion. 📊🔥
$AVGO short-term structure remains bullish. 🚨📊
On the 15-minute chart, Broadcom is still holding a strong breakout structure.
The stock pushed from the 435–440 area all the way to the 465–466 zone, then pulled back and is now rebounding around 459–460.
This tells me one thing:
Buyers are still active.
The trend is not broken, but the price is already near the short-term high, so I would not chase aggressively here.
My plan is simple:
Buy zone: 454–455
This is the pullback area I would watch first.
Key support: 447
As long as $AVGO holds above 447, the short-term bullish structure remains intact.
If $AVGO breaks and holds above 466, the next upside move could open.
But if price fails near 466, I would watch for a pullback toward 454–455 first.
The bigger story is still AI infrastructure.
$AVGO is one of the most important names outside of Nvidia because it sits directly in custom AI chips and AI networking.
Custom silicon.
AI accelerators.
Networking chips.
Data center infrastructure.
Trend is strong.
Momentum is bullish.
AI demand remains the main driver.
But entry price still matters.
I would rather wait for a clean pullback near support than chase strength at the top. 🚀📊
Not financial advice.
$ARM short-term structure remains bullish, but momentum is cooling after a strong move higher. 🚨📊
On the 15-minute chart, Arm pushed sharply higher after breaking out from the 300 area.
The stock moved through 330, 350, and 400, then reached a short-term high near 421.
Right now, $ARM is trading around 408–410, consolidating after the rally.
This does not look like a clear breakdown yet.
It looks more like high-level consolidation after a fast move.
My plan is simple:
Buy zone: 405–406
This is the first pullback area I would watch.
Key support: 396–397
As long as $ARM holds above this zone, the short-term bullish structure remains intact.
If $ARM breaks and holds above 421, the next upside move could open.
But this is not only about $ARM.
When Arm moves higher, the market usually starts looking at the entire ARM architecture ecosystem.
Related names to watch:
$AAPL — Apple Silicon
$QCOM — Snapdragon, mobile AI, edge AI
$NVDA — Grace CPU, AI data center systems
$AMZN — AWS Graviton chips
$MSFT — Azure Cobalt chips
$GOOGL — custom AI and cloud infrastructure
$AVGO — custom AI silicon
$MRVL — AI networking and custom chips
$TSM — advanced chip manufacturing
$ASML $AMAT $LRCX $KLAC — semiconductor equipment
My view is simple:
$ARM is not just another chip stock.
It is the architecture layer behind mobile chips, AI PCs, cloud CPUs, edge AI, automotive chips, and custom silicon.
As AI moves from data centers into devices, $ARM could become even more important.
Trend is strong.
Momentum is bullish.
But the price is still near the high.
I would rather wait for a clean pullback near support than chase strength at the top. 🚀📊
Not financial advice.
$AVGO short-term structure remains bullish. 🚨📊
On the 15-minute chart, Broadcom is still holding a strong breakout structure.
The stock pushed from the 435–440 area all the way to the 465–466 zone, then pulled back and is now rebounding around 459–460.
This tells me one thing:
Buyers are still active.
The trend is not broken, but the price is already near the short-term high, so I would not chase aggressively here.
My plan is simple:
Buy zone: 454–455
This is the pullback area I would watch first.
Key support: 447
As long as $AVGO holds above 447, the short-term bullish structure remains intact.
If $AVGO breaks and holds above 466, the next upside move could open.
But if price fails near 466, I would watch for a pullback toward 454–455 first.
The bigger story is still AI infrastructure.
$AVGO is one of the most important names outside of Nvidia because it sits directly in custom AI chips and AI networking.
Custom silicon.
AI accelerators.
Networking chips.
Data center infrastructure.
Trend is strong.
Momentum is bullish.
AI demand remains the main driver.
But entry price still matters.
I would rather wait for a clean pullback near support than chase strength at the top. 🚀📊
Not financial advice.
$AMD short-term structure is still bullish, but momentum is cooling. 🚨📊
On the 15-minute chart, AMD rebounded strongly from the 488–490 area and pushed into the 517 zone.
The stock broke above 500 and held the higher range, which shows buyers are still active.
Right now, $AMD is trading around 510, consolidating below the 514–518 resistance area.
This means the trend is not broken, but it is not the best area to chase aggressively.
My plan is simple:
Buy zone: 506–507
This is the first pullback area I would watch.
Key support: 499–500
As long as $AMD holds above this zone, the short-term bullish structure remains intact.
If $AMD breaks and holds above 518, the next upside move could open, with 527 as the next area to watch.
But if price loses 499, I would become more cautious because the short-term structure may start to weaken.
The bigger picture is simple:
$AMD is becoming one of the most important AI semiconductor names outside of Nvidia.
AI demand is no longer going to one company only.
Hyperscalers want more GPU supply, more competition, and more efficient data center options.
That is where $AMD matters.
EPYC CPUs.
Instinct AI GPUs.
Data center acceleration.
AI infrastructure demand.
Trend is still bullish.
Momentum is cooling.
Buyers are still active.
But entry price still matters.
$AMD is not weak here, but I would rather wait for a clean pullback near support than chase inside a high-range consolidation. 🚀📊
Not financial advice.
$NVDA short-term structure remains bullish. 🚨📊
On the 15-minute chart, Nvidia has completed a strong breakout after consolidating around the 212–217 area.
The stock pushed through 219, 221, and 223, then reached the 224.8–225 area, showing strong short-term buying pressure.
Right now, $NVDA is trading near 224, very close to the recent high.
This means momentum is still strong, and buyers are still in control, but the price is already near a short-term resistance zone.
I would not chase aggressively here.
My plan is simple:
First support: 221.3
This is the first pullback area I would watch.
Key support: 219.2
As long as $NVDA holds above this level, the short-term bullish structure remains intact.
If $NVDA breaks and holds above 225, the next upside move could open.
But if price fails near 225, I would first watch for a pullback toward 221.3.
The bigger picture is simple:
Nvidia is still the core name of the AI infrastructure trade.
It is not just a GPU company anymore.
It sits at the center of AI compute, data centers, networking, software ecosystem, robotics, autonomous systems, and physical AI.
Every major AI cycle still needs compute.
And Nvidia remains one of the most important companies supplying that compute layer.
That is why $NVDA continues to attract capital whenever AI momentum strengthens.
My view is simple:
Trend is strong.
Momentum is bullish.
AI leaders are still attracting capital.
Nvidia remains the platform layer of the AI economy.
But entry price still matters.
I would rather wait for a clean pullback near support than chase strength at the top. 🚀📊
Not financial advice.
solana:J3NKxxXZcnNiMjKw9hYb2K4LUxgwB6t1FtPtQVsv3KFr short-term structure is still bullish, but the market is now in a pullback confirmation phase. 🚨📊
On the 15-minute chart, the S&P 500 pushed higher after consolidating around the 7570–7590 area and reached a short-term high near 7617.
That breakout shows buyers are still active.
But now price has pulled back toward the 7599–7600 area, which means the market is testing support after the move.
My plan is simple:
First support: 7596
This is the first area I am watching. If solana:J3NKxxXZcnNiMjKw9hYb2K4LUxgwB6t1FtPtQVsv3KFr holds here, the pullback still looks healthy.
Key support: 7583–7584
As long as solana:J3NKxxXZcnNiMjKw9hYb2K4LUxgwB6t1FtPtQVsv3KFr holds above this zone, the short-term bullish structure remains intact.
If solana:J3NKxxXZcnNiMjKw9hYb2K4LUxgwB6t1FtPtQVsv3KFr breaks and holds above 7618, the next upside move could open.
But if price loses 7583, I would become more cautious because the breakout may start to fail.
My view is simple:
Trend is still bullish.
Momentum is cooling.
The market is testing support.
Do not chase blindly.
I would rather wait for support confirmation than buy at the top. 🚀📊
Not financial advice.
$MU short-term structure remains bullish. 🚨📊
On the 15-minute chart, Micron completed a strong move after consolidating around the 940–960 area.
The stock pushed through 1000, 1020, and 1030, then reached the 1046 area, showing strong short-term buying pressure.
Right now, $MU is trading near 1038, close to the recent high.
That means momentum is still strong, but the price is already near a short-term high, so I would not chase aggressively here.
My plan is simple:
Buy zone: 1032–1033
This is the first pullback area I would watch after the breakout.
Key support: 1023–1024
As long as $MU holds above this zone, the short-term bullish structure remains intact.
If $MU breaks and holds above 1047, the next upside move could open.
But this is not only about $MU.
When Micron moves higher, the market often starts looking at the entire AI memory and data center supply chain.
Related stocks to watch:
$NVDA — AI GPUs need high-bandwidth memory
$AMD — AI accelerators and data center chips
$AVGO — custom AI chips + AI networking
$MRVL — AI networking + data center interconnect
$DELL — AI servers and enterprise infrastructure
$WDC — storage and NAND exposure
$STX — data storage demand
$AMAT $LRCX $KLAC — semiconductor equipment names
$SMH $SOXX — semiconductor ETFs
My view is simple:
$MU is not just a memory stock anymore.
It is becoming one of the key AI infrastructure names because AI needs massive amounts of DRAM, HBM, NAND, and data center storage.
The AI trade is moving beyond GPUs.
It is spreading into memory, servers, storage, networking, and full data center infrastructure.
Trend is strong.
Momentum is bullish.
AI memory demand is real.
But entry price still matters.
I would rather wait for a clean pullback near support than chase strength at the top. 🚀📊
Not financial advice.
$PLTR short-term structure remains bullish. 🚨📊
On the 15-minute chart, Palantir completed a clean breakout after consolidating around the 132–143 area.
The stock then pushed through 153, 157, 160, and reached the 162 area, showing strong short-term buying pressure.
Right now, $PLTR is trading near the upper range around 161–162.
That means momentum is still strong, but the price is already close to a short-term high, so I would not chase aggressively here.
My plan is simple:
Buy zone: 159–160
This is the first pullback area I would watch.
Key support: 157
As long as $PLTR holds above 157, the short-term bullish structure remains intact.
If $PLTR breaks and holds above 162.5, the next upside move could open.
But this is not only about $PLTR.
When Palantir moves higher, the market often starts looking at related AI software, enterprise AI, defense tech, and government data names.
Related stocks to watch:
$AI — enterprise AI software
$SNOW — enterprise data cloud
$CRM — enterprise software + AI agents
$NOW — workflow automation + AI
$DDOG — cloud monitoring + AI infrastructure
$CRWD — cybersecurity + AI security
$NET — cloud security + edge AI
$LMT $RTX $NOC — defense and government spending themes
My view is simple:
$PLTR is not just an AI stock.
It is a government AI, defense data, enterprise automation, and decision intelligence platform.
If $PLTR continues to break out, the market may start repricing the broader AI software and defense technology basket.
Trend is strong.
Momentum is bullish.
But entry price still matters.
I would rather wait for a clean pullback near support than chase strength at the top. 🚀📊
Not financial advice.
$TSM short-term structure is still bullish. 🚨📊
On the 15-minute chart, TSMC completed a strong breakout after consolidating around the 407–421 area.
The stock pushed sharply higher and reached the 443 area, showing strong short-term buying pressure.
Right now, $TSM is trading near the upper range around 440, close to the recent high.
That means momentum is still strong, but the price is already near a short-term high, so I would not chase aggressively here.
My plan is simple:
Buy zone: 421
This is the first pullback area I would watch after the breakout.
Key support: 407
As long as $TSM holds above 407, the short-term bullish structure remains intact.
If $TSM breaks and holds above 443, the next upside move could open.
But if price fails near 443, I would watch for a pullback toward 421 first.
My view is simple:
Trend is strong.
Momentum is bullish.
Buyers are still in control.
But the price is already near the high.
I would rather wait for a clean pullback near support than chase strength at the top. 🚀📊
Not financial advice.