This is the best momentum screener in the market to find leading small caps
I've literally used this screener to find every single leading stock in the market before it broke out
super simple to use on Trading view
1. Head of over to Tradingview
Click the screener section on the bottom right
2. Add the right parameters
-Index: Russell 2000
-Price over 3 USD
-Change > 0.01%
-Market cap > 300m USD
-EMA 21 and 50 < Price
-Avg volume > 500k
-ADR >2%
Sort by volume descending
You now get a list of the strongest and most liquid stocks in $IWM
This will change you trading.
Top Trader Mistakes according to @Qullamaggie
1. Trading mediocre setups / not knowing what good setups look like
2. Trading in bad market environments
3. No linearity / longing choppy stock
4. Trading slow moving stocks / not swing trading stocks
5. Anticipating breakouts
6. Frontisde vs. backside breakouts - longing setups below declining moving averages (basckside) vs. setups surfing 10 20 50 (frontside)
7. Not buying on entry / breakout day
8. Not buying tight setups / buying wide and loose
9. Not surfing any of the key moving averages
10. Buying microcaps on the 50-day
11. Buying away from the moving averages
12. Buying base breakout 5, 6, or 7 instead of 1st or 2nd base / longing stocks without rest
13. Broken stock trading
14. Buying a random day on a random stock
15. Sector selection - commodity names vs growth names / longing tough sectors
16. No range
17. Not an explosive stock / grinder
18. Barcode setup
19. Incomplete setups
20. Let the setup develop / go sideways
21. Laggard stocks
22. No higher lows
23. Random setup
24. Random up day
25. Not focusing on 5-star setups
26. Overtrading / Too eager to buy / "Trading 10 tickers per day"
27. Stock selection
28. Trying to be the first one in
29. Not a traditional setup - setups off lows / mean reversion trades
30. No tight candles prior to breakout day
31. Buying a downtrending stock
32. Mistaking a continuation move for a breakout
33. "Chaser’s entry"
34. Not following sell rules properly
35. Mean reversion trades
36. Buying inside of a range
37. "Not ideal scenario" - stock breaks out day prior fails comes back into range and breaks out again next day
38. Not a good flag
39. Secondary breakouts
40. Buying just because they broke previous day’s highs or built higher lows
41. Not taking setups breaking out off a moving average
42. Buying random stocks
43. Volume confirmation*
44. Buying random up days on a momentum stock
If you don't know what these mean go study and find out.
I always get asked how to differentiate between a momentum move and chasing stocks
the best way to keep yourself in check is to use the 8 EMA
the 8 EMA is the best tool for momentum gauging
then check what the stocks ADR(average daily range) is
if the stock is over twice the ADR away from the 8 EMA you are most likely chasing and should wait for a retest
the closer the stock is to the 8 day the better your entry is and the more likely you get follow through on a move
if you feel like you have a ton of fomo and end up losing out chasing stocks...
always remember stocks don't go straight up they will literally always pull in
buy off the key moving averages or when price tightness up
you will double your win rate doing this.
Timing is everything in trading 👇
1. Market Timing
Only trade when the odds are in your favor. A simple rule: trade when the NASDAQ is above a rising EMA 21. Advanced traders rely on a full Market Trend Model—like the one we use.
2. Entry Timing
Wait for high-probability setups: tight consolidations, volatility contractions, volume dry-ups near breakout levels. These offer strong risk-reward. I’ve taught this exact method to thousands of traders.
3. Exit Timing
You won’t sell at the top—but you can stay in long enough to capture the bulk of a move. A simple trailing stop, like the EMA 21, can help you ride trends and lock in profits. Other selling techniques like a Climax Top is a big plus.
4. Mindset Timing
Your mental state matters. You need to be in your performance zone to execute well. If you’re off—don’t trade. Discipline includes knowing when not to act.
Most people learn by seeing how things work.
So when a trader is feeling lost and anxious, telling them to “just have conviction” or “never give up” doesn’t really do much. It’s not helpful.
That’s why I focus on giving real context and details in my content—so the why behind a setup actually makes sense. Once you get the why, you can start building a system that fits you.
Having a mentor like @PradeepBonde was gane changing for me. He breaks down the small stuff that really matters. That’s why I—and so many others—were able to take what he taught and run with it. He’s a master of the little things that make a big difference.
The Magic Elixir 🧪
liquid + high ADR + linear + previous history big moves + theme/story + fundamentals + catalyst + big weekly base + tight daily.
Yes... not many fit this bill. Some previous and current names:
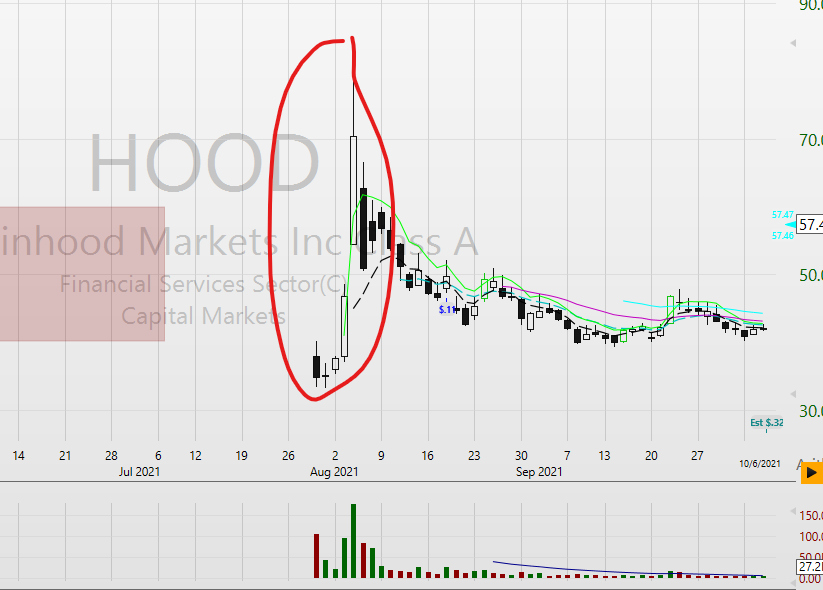
$NVDA $SMCI $TSLA $MSTR $BTC $QBTS $IONQ $SEZL $DAVE $HIMS $HOOD
I have immense respect for @Qullamaggie, but many who study him miss the real lesson.
If you take his content at face value, you’ll never find success on your own. His true teaching is this: find your own way.
His success with ORBs on EPs comes from a his own studying and deep dives—a level of understanding others can’t replicate. That’s why building your own system is the ultimate takeaway.
Valuable insights from market wizard and systematic trader @mars10p during his interview by @chatwithtraders
I was not aware of him trading breakouts/breakdowns on high-volume stocks since the 90s. Very similar to the strategy we presented in our awarded paper
A Profitable Day Trading Strategy for the U.S. Equity Market.
Some promising ideas to extend the paper’s results are already saved in my notebook.
Links to paper and podcast below
A vast majority of my tactical entries into the ADXpress and ADXtender setups revolve around these core intraday patterns on the hourly. These would essentially be "wedge pops" and "base'n'breaks" on the hourly timeframe, for those familiar with Kell's model.
There's nothing magical about this. I'm using volalility, liquidity, momentum, relative strength, and linearity to narrow the universe of stocks. From there it's simply just multi-timeframe trading - using the bigger picture setups (ADXpress and ADXtender on the daily), while using lower timeframe tactical entries (wedgepop and base'n'break on the hourly).
I use intraday bollingerbands extensively as well since they are very scannable criteria. You can use whatever tactical entry you please as long as you can consistently get in at inflection points that will give your regularly outsized rewards vs risk.
Then the only thing left is modulating my aggressiveness (risk per trade and number of positions) based on market backdrop and how my positions are performing.
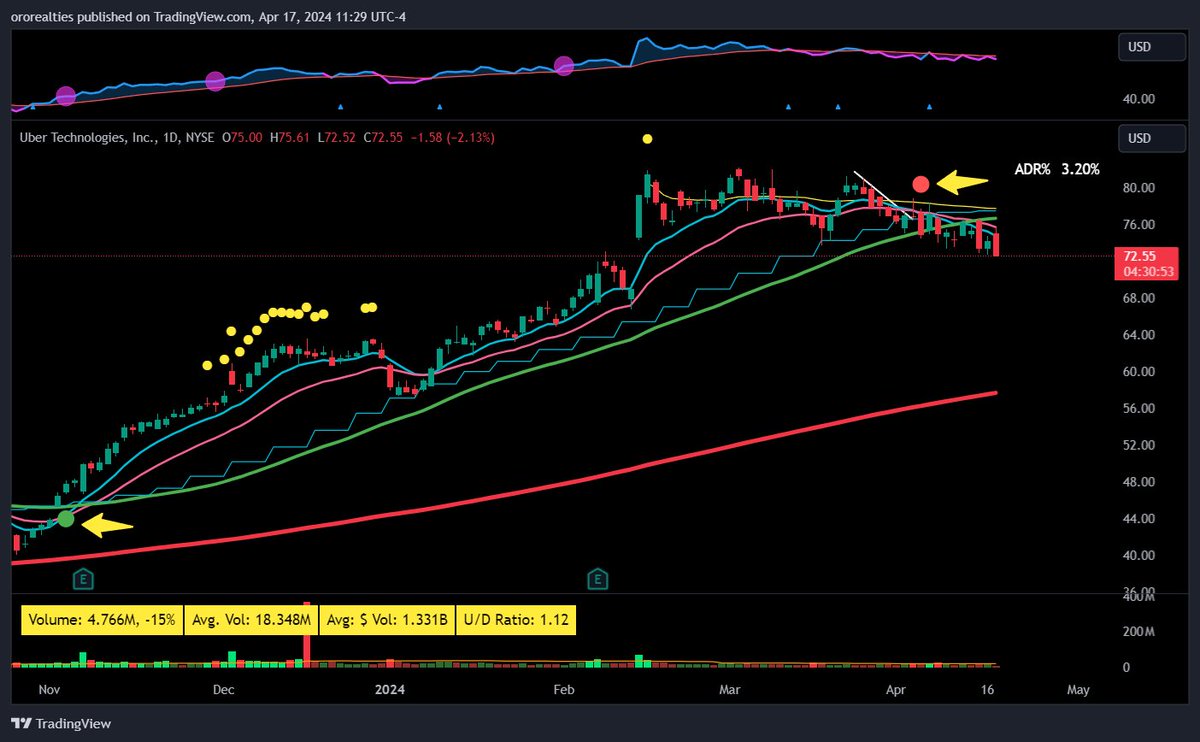
I created a basic indicator to signal 10/21ema moving average crossovers. Something I like to be aware of for trend change.
Here it is on $UBER
I'll post the code below for anyone interested (TradingView)
Reducing randomness in trading and finding market leaders seems very complicated on the surface but it's actually quite simple, especially if you have the correct tools for it. No need to spend hundreds or thousands on scans, special software, services, etc. All you need is readily attainable and more simple than you think.
Alongside a few blanket parameters I use like ADR and dollar volume, there is one calculation I use that gives me exactly what I'm looking for:
Price as a % of 52wk Highs: 100 * c / maxh252
This simple filter allows you to find names that are near their highs, defying market gravity. The higher the number, the stronger the stock.
Step 1:
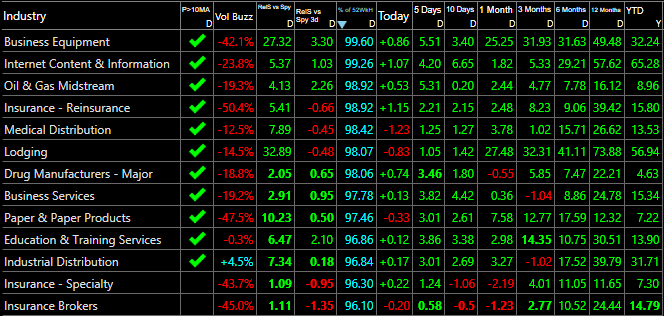
Want to find what industries are strong? Look no further. When the market pulls back, which are at the top of the list? Which are back to 100% the quickest? These are the industries you want to pay attention to.
Step 2:
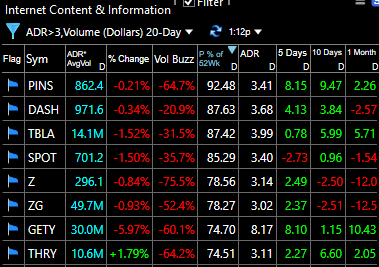
If you look at Internet Content & Information, once again, I'm using the same filter. Price as a % of 52Wk highs. Here are your leading stocks in this leading industry. If I remove the ADR > 3 filter, I can see some of the larger market cap names that hold a lot of weight, but they are too slow for my liking. Regardless, you aren't just buying whatever is spit out at the top of the list. You still need a setup.
In a broad perspective, disregarding industry, you can see which stocks are leading that trade over X in dollar volume and have an ADR over 3, you guessed it; by using Price as a % of 52Wk Highs.
I don't even bother looking at something that isn't over 60%, which I have set as a minimum, and probably should be even higher than that, but all of a sudden thousands of stocks are reduced to a few hundred, and if you adjust thresholds for ADR and Dollar Volume to your specific needs, there may be even less.
When the market pulled back, I was laser focused on the stocks that ranked high on my list. These names showed RS, had a setup, and were in strong industries. $CRWD $ZS $MOD $VRT $SCS $ONTO $NTNX
Now this isn't the end all be all, even if I position myself in these leaders, I still need the market to follow through. And so far things are looking good, but who can say what will happen weeks or months from now which will ultimately pay me.
Here are the latest top 9 free trading and investing web tools that I am highly dependent on. I hope this they could also provide valuable and insightful resources as these tools have proven beneficial for my own processes.
I would appreciate more contributions from you for an updated list next year!
Below are my list!
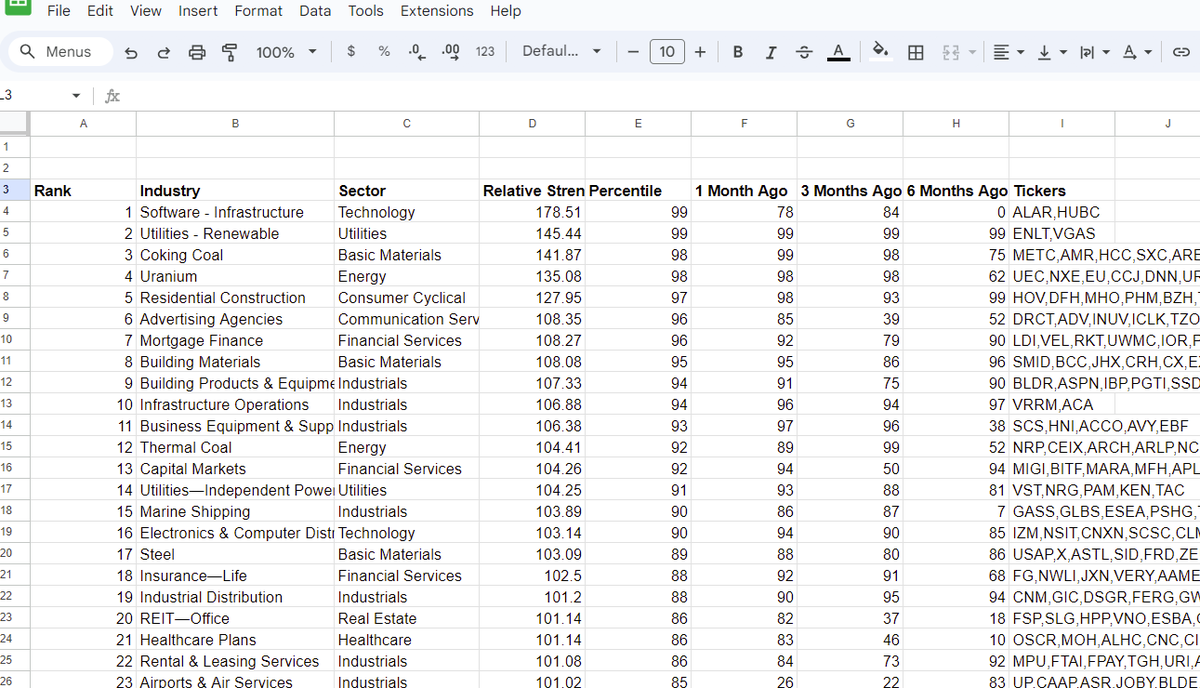
1. Industry Group RS Rating - https://t.co/bqdlAVWri9
The source is made available for free by @DumbleDax, but he highlighted this piece of work is 100% attributed to TradingView User: Skyte.
For Googles Sheet User, data can be seamless imported into your googlesheet via the below code
=IMPORTDATA("https://t.co/7D1d47Tx61…",",",0)
For Excel User, I noted the same could be implemented via use Power Query. This is this is from ChatGPT.
1. Go to the "Data" tab in Excel.
2. Click on "Get Data" or "Get & Transform Data" (the exact wording might vary depending on your Excel version).
3. Select "From Web."
4. In the "From Web" dialog, enter the URL https://t.co/SDx9rI3r1d and click "OK."
2. https://t.co/TOtAhbHwmB -
@PradeepBonde Market Monitor is a daily breath monitor for signs of strength/weakness and turnaround. May be from a simple Blogspot layout but data remains free and accessible through the years)
3. https://t.co/vdGRnDuQmn -
This link provides a daily pre-market crucial news, for everyone to kickstart their trading/investing session. Link is updated every 90 minutes before market open.
4. https://t.co/aCQQUVq32y -
If you are a Story Stock, Earnings Gap or Episodic Pivot strategy trader that is dependent on impactful price action, the pre-market movers data gives you a quick birdeye view of strongest/weakest pre-market move, along with their pre-market volume. Can be flited via Earnings for earnings play.
5. https://t.co/RaxMUZmvHe -This is a great free website by @stock_analysisx. I actually thought the ETF Screener is extremely useful if you trades leveraged ETF like myself. Screening parameters such as strongest 1-month mover are available. Thank you @A_jrk23 for highlighting this last year.
6. https://t.co/3lObWMzq50 - Data Roma (13F filings of activity by top investors. Seamless and unclutter website because it's simply using blogspot if i'm not wrong :D ) -
7. https://t.co/1PXncU6W3d This encompasses a range of free financial data dating as far back as 9 FY, segments, investor tools, and an Excel add-in. In my humble opinion, it has surpassed Koyfin and Stratosphere, as the latter two have restricted usage for free users in the past 9 months.
8. https://t.co/JPFOpivqYG - @BlogJulianKomar free CANSLIM screener. One of my favorite weekend scan is going through @BlogJulianKomar strongest stock scan, which is shared publicly for free in his #240 weekend newsletter. The link above is the default settings published by him.
9. https://t.co/ocaXXDP3mr - @Nevonal This is great study material. The work @Nevonal has done on @Qullamaggie stream is remains extremely underrated. Reading the recap with charts from the website are always my travel entertainment. Although it is only updated till 6/12/2021, but studying the charts from stream recap of a top trader in today's era still remains essential to improving your own thought process.
Special Mention (Not entirely free)
https://t.co/T28g1V6ErW
If you find this thread helpful and would appreciate more contributions from the public for an updated list next year, please consider giving it a retweet and like!
Learn Epidosdic Pivots (EP) FAST!
How does Qullamaggie make $100m from EP setups when the edge is SHORT?
This is my varying perception 👇👇👇
https://t.co/Pga1VP9C4f