$TDTH
🌍 Expanding into Africa
🤖 AI-powered digital infrastructure
🏢 530K+ SMEs targeted
💰 Nearly $800M projected economic impact
Trident Digital just launched TDTHAI Africa, building on its existing partnership with Ghana's tax authority
One to keep on the radar
$CELH
✅ Near long-term trendline support
✅ Risk/reward improving
✅ Sub-$27 looks attractive
The setup I've been waiting for is almost here
Interesting for both stock buyers and long-dated call option traders🔥
$YUM
The chart is setting up nicely
After rebounding, shares have returned to the wedge structure while holding above a strong trendline support
The 50-day moving average remains the main resistance level
A breakout above $150.50 could trigger a move toward $158 and potentially $170
$AMC
The stock has broken above resistance and is now retesting that level as support
If the support holds, do you see another leg higher?
We're already sitting on 45%+ gains. Curious to hear everyone's thoughts
$AMC
daily chart is forming a bullish flag ��⛳️
Once it breaks above the $1.60 resistance, momentum could really accelerate.
Next upside targets: $1.90 → $2.06 → $2.28
$MCO
Technically, the stock is working through a triangle breakout and is now pulling back toward its 50-day moving average
This could be a favorable spot to accumulate shares on weakness 🚀 🟢
$KTTA
Pasithea Therapeutics reports that its ALS drug PAS-004 has obtained Orphan Drug Designation from the FDA
The designation is meant to help advance therapies for rare diseases – those affecting fewer than 200,000 people across the U.S
$QUCY announced a move under the BP United agreement expansion: direct manufacturing of autonomous drones, bringing tech production in-house instead of outsourcing, receiving technical support from BP United, and tying the voting protocol to the platform's long-term strategy
$DXCM
Textbook technical breakout.
Trendline break ✔️
Successful retest ✔️
Confirmation from last week's rally ✔️
If momentum continues, the next resistance level is around $85 📈
$AI remains down 57% over the past year, even in the middle of a historic AI market surge
With earnings coming on June 3, traders are watching closely
Technically, the stock has now broken above its long-term bearish trendline — a potential sign of changing momentum
$WBD is showing a prolonged tight bull flag on the chart 🚀📈
Following Tuesday’s DOJ discussions, reports suggest the path toward a potential agreement is becoming clearer, with regulators reportedly taking a more supportive tone.
That news catalyst could provide the momentum needed for a breakout move
$OPEN keeps showing strength 👀📊
Since publication, the stock has reached a peak return of more than 20%
Breaking through the flag resistance zone could significantly expand profit potential 🔥
$OPEN
The chart is showing a developing triple bottom, with support holding firmly at this level. Price is also sitting directly on an important trendline support area
The CEO also noted that “Opendoor 2.0” is coming, targeting real estate agents 🏘️
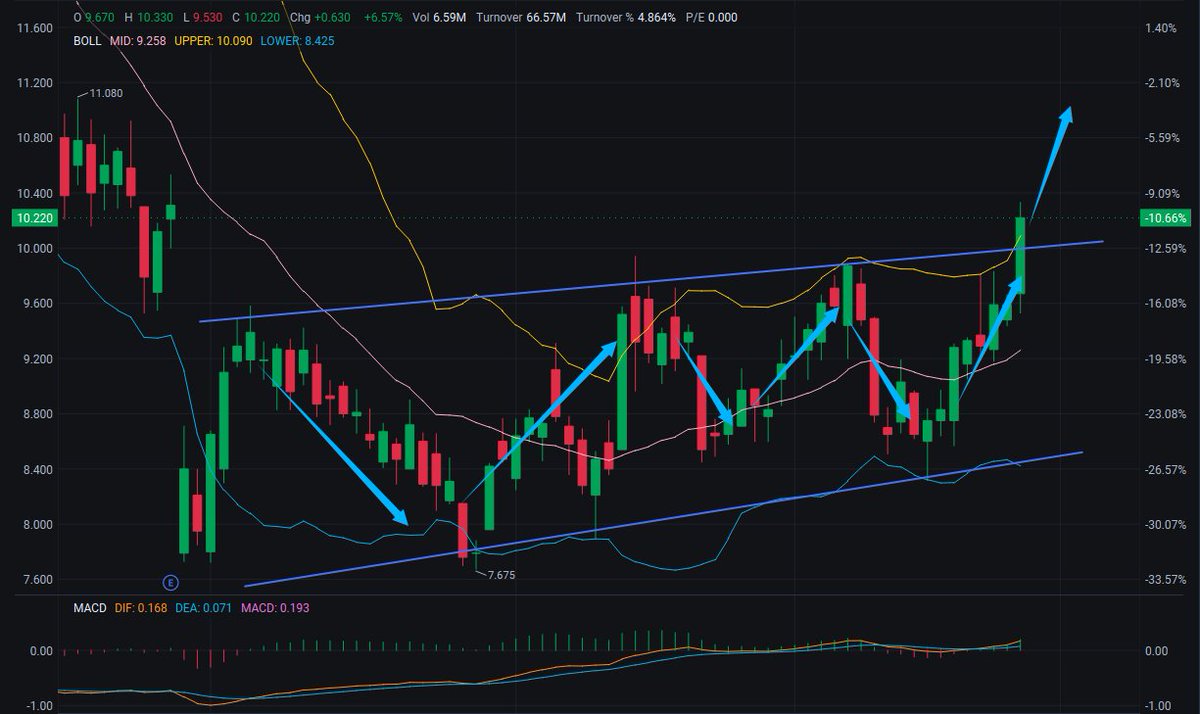
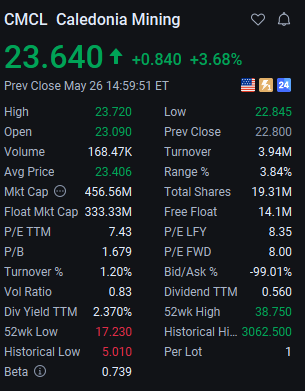
$CMCL is showing solid technical strength 📊🚀
After multiple rebounds from the $21–$22 support region, the stock has now cleared resistance near the Bollinger Band midline
This breakout may pave the way toward the $27 level close to the 200-day moving average
$ASTS is showing a strong short-term rebound from its consolidation zone around $60–$76. The stock is currently trading at $92.10, approaching the upper Bollinger Band, indicating bullish momentum. MACD is positive and rising, confirming near term strength
Support: $76.85 / $88 (short term)
Resistance: $93.30 / previous high $129.89
$AMC
daily chart is forming a bullish flag ��⛳️
Once it breaks above the $1.60 resistance, momentum could really accelerate.
Next upside targets: $1.90 → $2.06 → $2.28
$CMG
continues to hold strong near the $32 support level.
Price action is still respecting the long-term bullish trendline.
This may offer a solid opportunity for investors looking at longer-term upside potential. 📊
$ASTS is showing a strong short-term rebound from its consolidation zone around $60–$76. The stock is currently trading at $92.10, approaching the upper Bollinger Band, indicating bullish momentum. MACD is positive and rising, confirming near term strength
Support: $76.85 / $88 (short term)
Resistance: $93.30 / previous high $129.89