Gold is often seen as a safe asset but its history shows meaningful drawdowns too
Major drawdowns after peaks:
• 1974 → 40% Fall
• 1980 → 60% Fall
• 2011 → 40% Fall
• 2020 → 20% Fall
Gold tends to protect during periods of uncertainty, but it isn’t safe at every moment
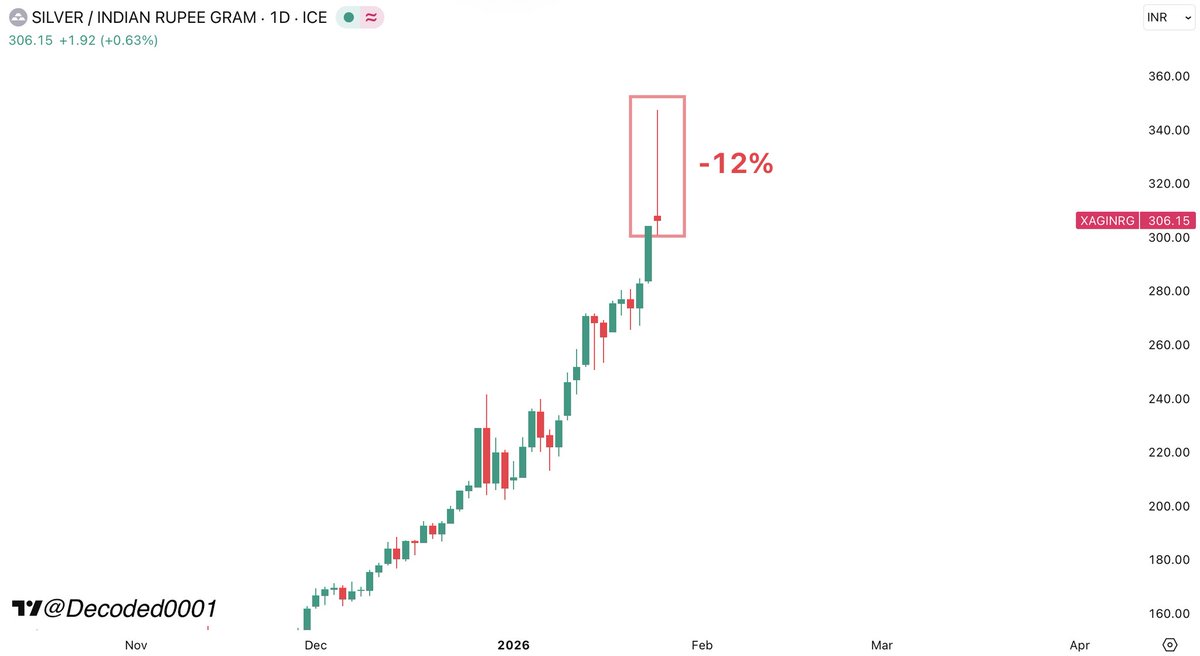
Worst drawdowns in Silver history (Since 1965)
• 1968 peak → Fall 50%
• 1974 peak → Fall 30%
• 1980 peak → Fall 90%
• 2011 peak → Fall 70%
Silver has always moved in extremes sharp rallies followed by deep resets
Gold-to-Sensex ratio is back at a very crucial level
Historically, when the ratio reached this level, one thing followed:
• Either Equities start doing better or Gold's performance slow down
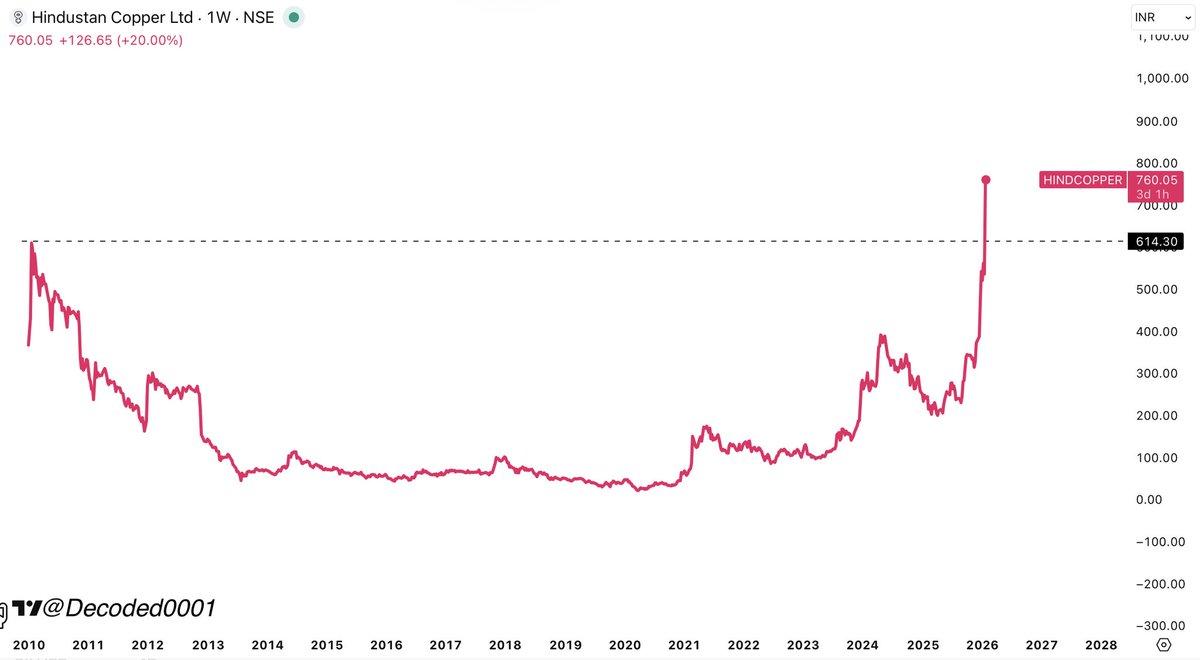
🇮🇳 Hindustan Copper is special
It’s the only company in India that mines copper from the ground
If India wants its own copper, there’s only one source: HINDUSTAN COPPER
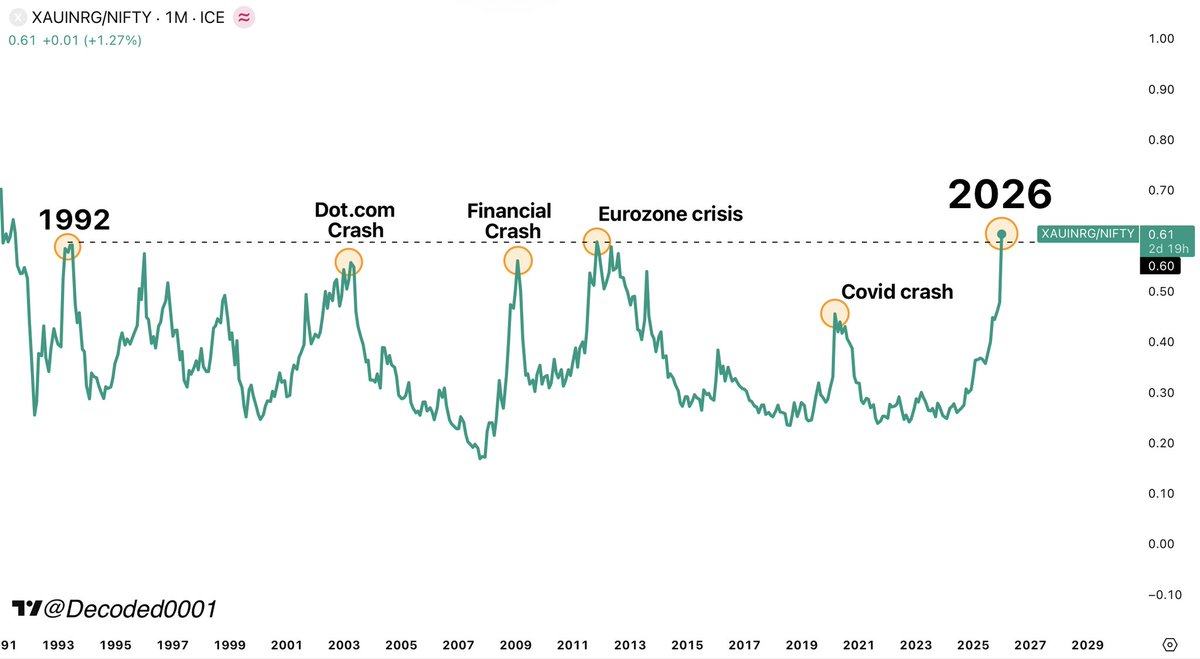
Gold is outperforming Nifty by the widest margin in almost 35 years
This gap is now larger than it was during the biggest market crashes of the last three decades
What market history tells us (2002-2026):
🐂 Bull markets
• Last around 3 years
• ~150% returns on average
🐻 Bear markets
• Last around 7 months
• ~34% average drawdowns
Learning:
• Corrections are short and violent
• Growth phases are long and powerful
In last 20 Years (2006-2025)
Nifty IT and the Rupee show a -88% correlation
That simply mean:
If Rupee falls 1 unit → NiftyIT tends to rise 0.88 units (on normalized scale)
If you had invested ₹10,000 in the Indian stock market:
5 years ago → ₹20,000 (2x)
25 years ago → ₹3,00,000 (30x)
This is the quiet power of compounding