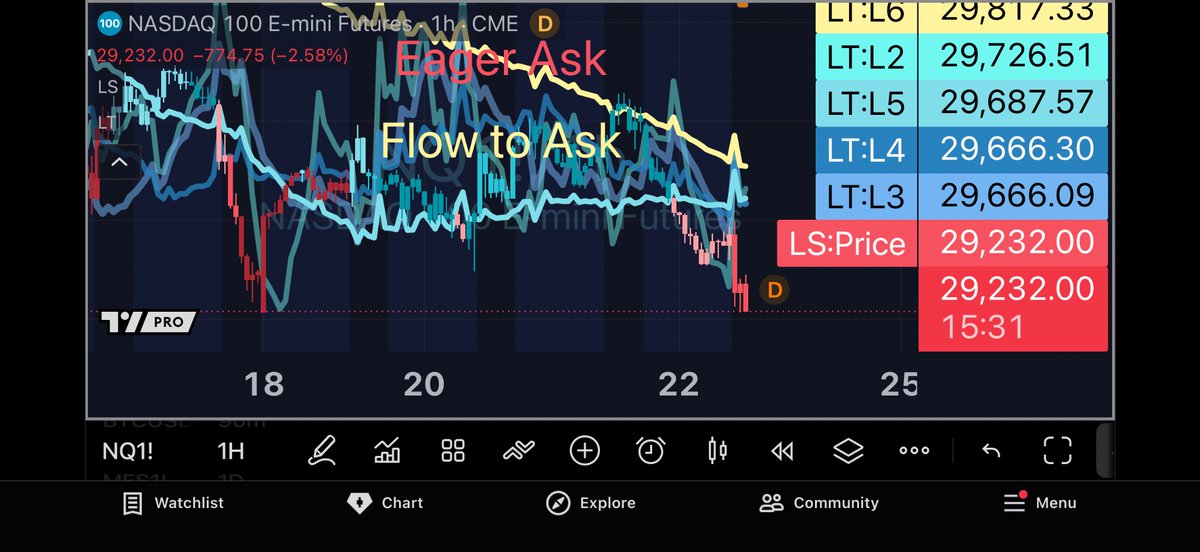
On $QQQ's futures #NQ_F hourly, we see a great example of Jmora's sign.
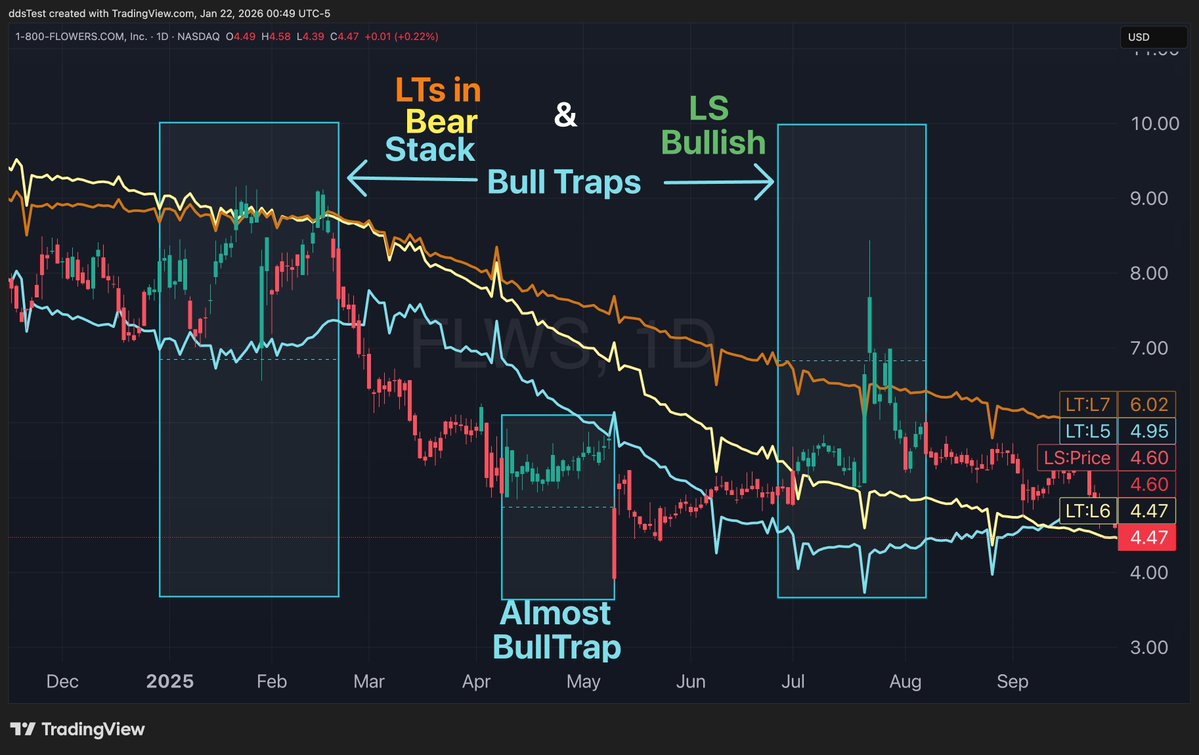
This is when, in bearish conditions (candles are red, LTs are in bearstack), a bulltrap develops (candles turn green). The expectation is rejection at LT resistance, and return to below most recent low.
On $QQQ's futures #NQ_F hourly, we see a great example of Jmora's sign.
This is when, in bearish conditions (candles are red, LTs are in bearstack), a bulltrap develops (candles turn green). The expectation is rejection at LT resistance, and return to below most recent low.
Conditions look very rough on $SPY futures (ES futures) as seen on several timeframes:
Of note:
-bearish liquidity everywhere (candles are red)
- Aggressive ask on the 987-minute
- Bearish liquidity on the weekly
Downside is most likely in the near future, and potentially extending into the next month if LT-6 support is needed on the weekly.
Composite chats let you directly compare liquidity between symbols. This is done, as in ex below, by setting your chart to, for instance, $SPY / $GME.
When liquidity is bullish (green candles), the top symbol will out perform, and when bearish (red candles) the bottom will outperform.
Check out the daily composite chart below!
There's alot! I'll try, but if I stop making sense, let me know.
The big spikes down, are aggressive bids being detected. Aggressive bids are liquidity-draining, ask-chasing orders. They need to transact and they need to do it now.
With LTs these are detected by those deep, uniform down spikes. (Image #1).
The benefit to detecting these is it usually proceeds substantial $+, and when it does, the top can be detected by "the wave" (image #2).
So in the screen shot we see one huge aggressive bid and a very substantial "wave" (indicating how much liquidity the bid was draining) as each LT rises rapidly and falls one by one.
But - Its very rare to see LT5, 6 & 7 apart of the wave ! It indicates a very strong liquidity drain. (notice in image #1 and image #2, LT-5, 6, 7 are not apart of the wave but continue on with their trajectory even after https://t.co/ZA415c77Ku). This means it was *very* hard for bid to transact due to absent ask, yet the bid had to keep climbing to reach the next ask (due to some obligation to buy shares), and so price skyrockets.
In other words: it locates squeezes.
After the first squeeze, things stabilized somewhat but when LTs came together again in 2024, another aggressive bid appeared!
I posted the image because I think it looks cool and also: is the pattern repeating?
Yes! Lesson learned.
Last time there was expectations that such a large spike down were apart of the pattern highlighted in the photo.
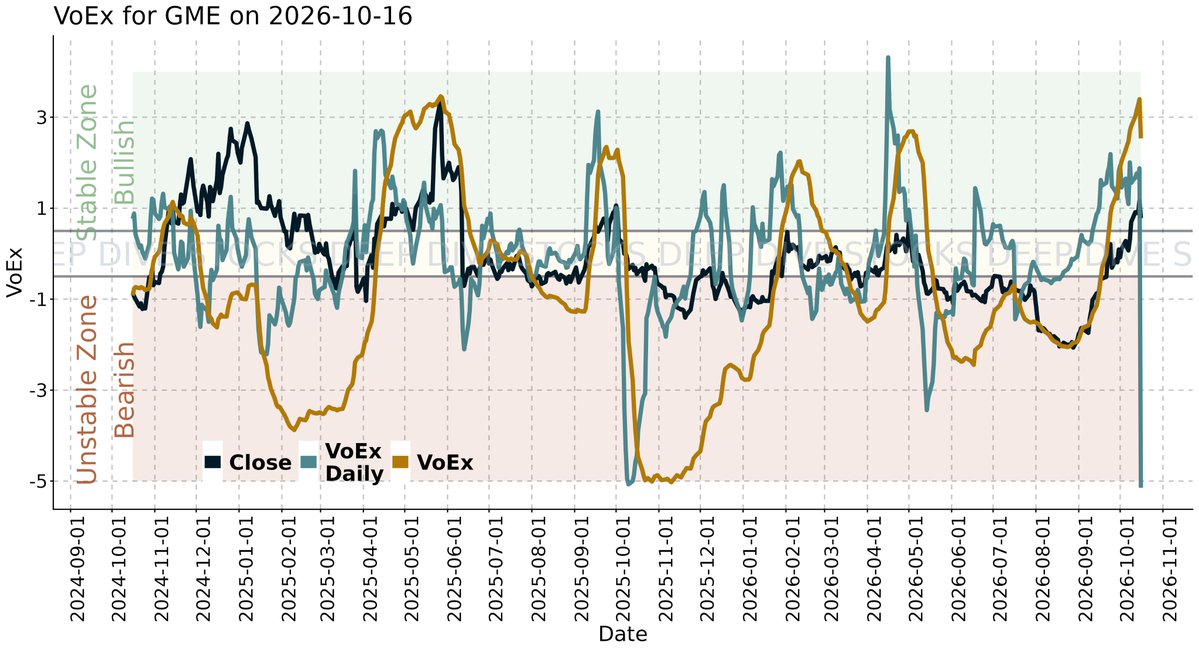
But the pattern didn't last unfortunately! Instead of spiking back up, VoEx remained in the bearish zone.
Thats the play now: on its face, such VoEx movement is bearish but it is still "a part" or rather very similar to the previous patterns but because of the lesson learned last time, Im not jumping the gun on bullish outlooks just yet - only if VoEx spikes back up.
Weekly $NVDA shows weakness as liquidity turns bearish (Candles are red now) - next supports are located at LT-6 ($187 currently; -12%) & LT-7 ($141 currently; -34%).
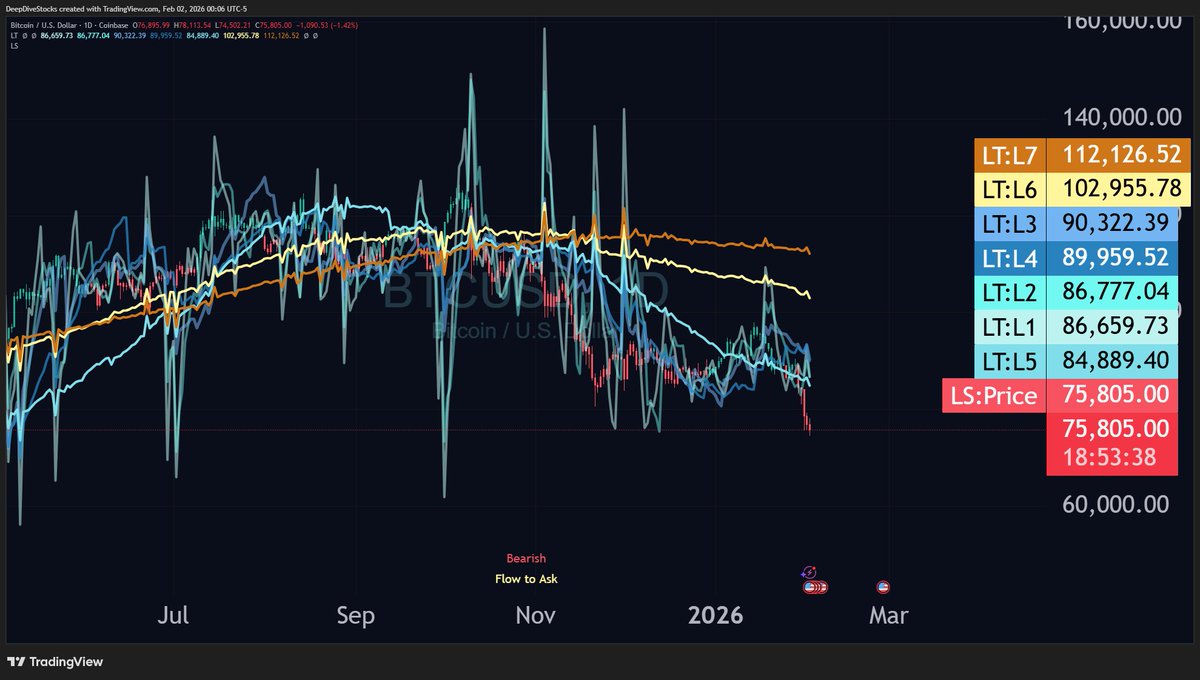
Jmora's Sign is when a bulltrap develops, gets rejected by LT resistance, which causes price to fall back below to recent low! On bitcoin:native we see that exact set up!
The weekly view for BTC shows a bulltrap being rejected by LT5/6, and so the next step is likely sub-$55k over the coming months.