$BTC All I did was draw two simple lines on the chart.
The plan worked perfectly and, as of today, I’ve been long practically since the lows. As long as we hold the 58k area, the natural target remains a return to the 70–75k range in the coming days.
If, on the other hand, those levels were to give way, it wouldn’t change much for me: we’d simply have another great buying opportunity in the 50k area.
No complicated forecasts, no magic. Just key levels, risk management and patience.
For me, that’s what trading is all about: keeping everything as simple as possible.
Only so many times you'd want to see price revisit 60/61s....
Regime is still trend down - no base being built yet
Knife catchers - becoming forced seller....
Rallies are late shorts - covering...
If you're one - then you're probably being outpeformed by a simple set of H1 - 12/25 ema....
Sweet Science....
Bitcoin closed May at $73,568
Market is 50/50 on if Febryary $60k was the bottom, or the bear will continue.
IMO data is telling us that we have not seen bottom formation yet, and that there is a >50% probablility that we go lower (below 200wma $61k or realized price $53k).
I just created a tutorial on how to build an AI agent that trades on your behalf 24/7/365
It's pretty simple and requires 0 coding knowledge
Both the service and the tutorial costs $0.00
It's available right now: https://t.co/n6v3rLIhj4
This expert trader just cracked the code on $BTC.
He says this price fractal has happened before, and he just outlined his blueprint for trading it.
If you're looking to trade this market, I'd pay attention to this:
1. Multiple daily closes above range highs - deviation confirmed
2. Market structure turns bearish post-deviation - "lower low" printed
3. Daily 12/25 EMAs cross red - bearish signal
4. Price getting capped by EMAs acting as dynamic resistance
$BTC
Positive geo-pol news over the weekends for which the market has reacted positively to.
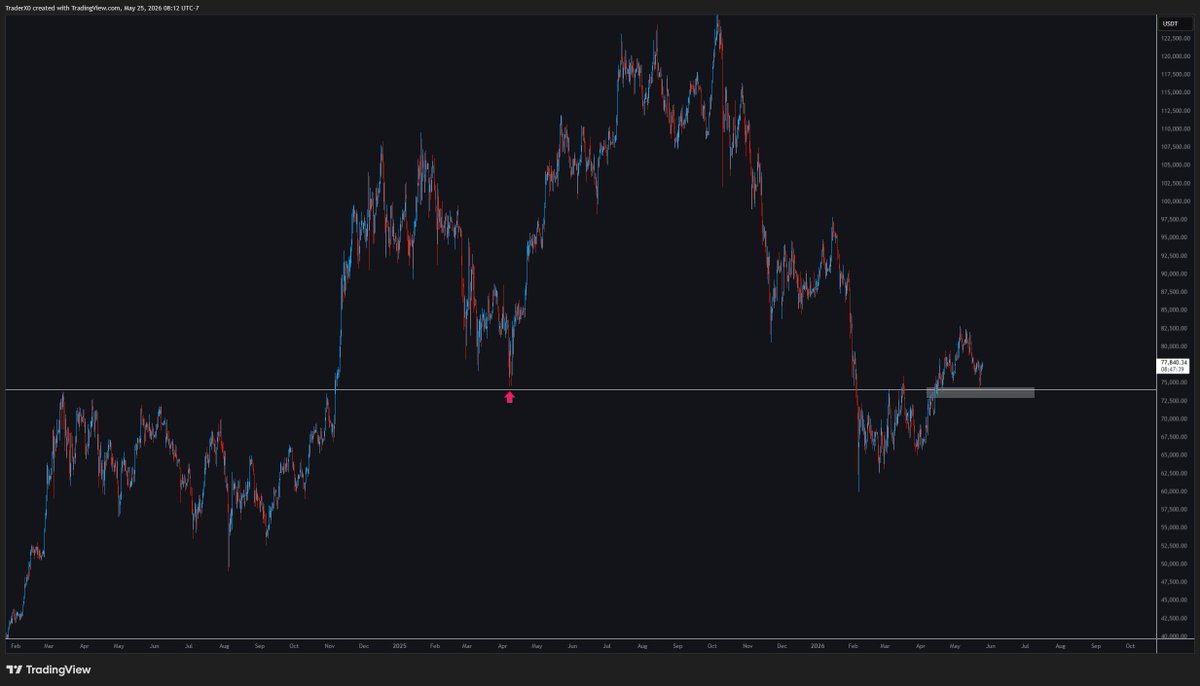
My bias was leaning towards further downside for as long as 76.5s acted as resistance...
HTF looks ok for now - as price clearly backtested an important level around 74.x - confluent with the same zone from April 2025.
79.5's - 2 week comp vah resistance - above here and I'd say we likely trade back towards the local highs pushing for 84s.
76's - 2 week comp val key support - and 74s being a signifcant level as highlighted on the chart - through here and I'd lean towards trading the lower bounds of the range again.
They're the two levels Im focusing on - no current bias.
bitcoin:native is setting up for a 10%+ move and no one is paying attention. either ~90k or ~70k in May/early June. higher probability of up than down at the moment.
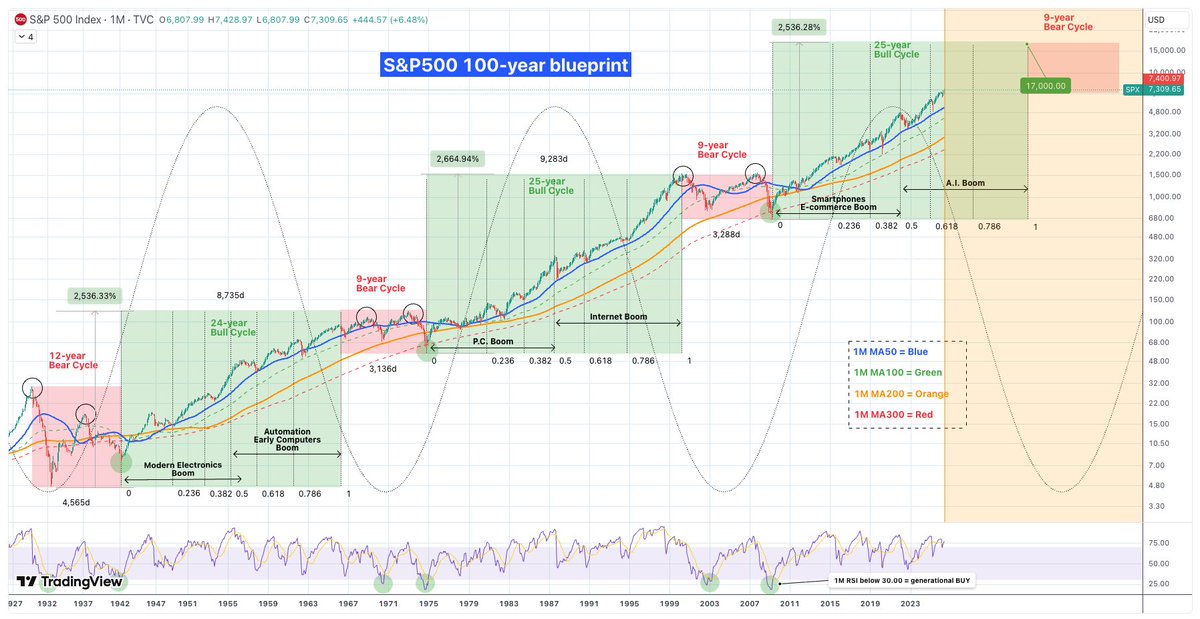
Der 100-Jahre-Plan für den Aktienmarkt
Wenn du dir die letzten 100 Jahre anschaust, siehst du ein klares Muster: Der Markt wiederholt immer wieder die gleichen Zyklen. Seit der Großen Depression 1930 gab es drei große Abwärtsphasen und drei Aufwärtsphasen .
Wir stecken gerade mitten im dritten großen Bullenmarkt.
Die schlechten Zeiten (Bärenmärkte)
Diese Phasen dauerten meistens etwa 9 Jahre (die Weltwirtschaftskrise von 1930 war mit 12 Jahren eine Ausnahme). Ein typisches Zeichen war, dass der Markt zweimal oben und zweimal unten „anklopfte“, bevor es wieder aufwärts ging. Oft krachte der Kurs bis zu einer bestimmten langfristigen Linie (dem 300er-Schnitt im Monatschart) und startete von dort aus neu durch.
Die guten Zeiten (Bullenmärkte)
Die ersten beiden großen Aufwärtsphasen dauerten jeweils 24 und 25 Jahre. Das Spannende: Sobald der Markt einmal Fahrt aufgenommen hatte, fiel er fast nie unter eine bestimmte grüne Linie (den 100er-Schnitt). Die blaue Linie (50er-Schnitt) war dabei immer die beste Chance, um günstig nachzukaufen, wenn es mal zwischendurch ruckelte.
Warum steigt der Markt so extrem?
Hinter jedem Bullenmarkt steckt eine neue Technologie:
Früher waren es industrielle Durchbrüche.
Dann kam der Internet-Boom.
Heute erleben wir den E-Commerce- und Social-Media-Boom.
Klar, irgendwann platzen diese Blasen immer, weil die Leute übertreiben. Aber die Technik bleibt! Das Internet ist nicht verschwunden, nur weil die Kurse im Jahr 2000 abgestürzt sind – es wurde zum Fundament für alles, was wir heute nutzen.
Der KI-Boom
Wir sind jetzt im zweiten Teil des aktuellen Aufschwungs, und der wird von der Künstlichen Intelligenz getrieben. Wahrscheinlich wird diese Blase um das Jahr 2034 platzen. Das wird wehtun, aber danach wird KI das feste Rückgrat unserer gesamten Wirtschaft sein.
Im Grunde sind die letzten 100 Jahre eine Kette von Erfindungen, die die Kurse immer höher treiben. Die Abstürze zwischendurch sind nur dazu da, die heiße Luft rauszulassen und Platz für neues Geld und die nächste Technologie zu machen.
Was bedeutet das für dich heute?
Wenn dieser Zyklus so läuft wie die letzten beiden, könnte der S&P 500 bis auf 17.000 Punkte steigen.
Es wird zwischendurch immer wieder Korrekturen geben. Der Zoll-Crash Anfang 2025 war so ein Moment, hat aber die wichtige blaue Linie nicht ganz berührt.
Schau auf den RSI-Anzeiger. Wenn der unter 30 fällt, ist das eine Chance des Jahrzehnts. Das ist in 100 Jahren erst sechsmal passiert – und jedes Mal war es der perfekte Zeitpunkt zum Kaufen.
Liken, Folgen, Speichern, Kommentieren, Teilen.
Danke für den Support 🫶😊🫶
This expert trader just LEAKED the exact formulas for printing money in the markets.
Master these 5 chart patterns, and you'll have an edge over 99% of retail traders.
Info like this shouldn't be free - make sure to save it:
Bitcoin Market Review Livestream
Today at 4PM UTC with @TraderMagus
Talking all things trading, price action and orderflow...
In partnership with @PrimeXBT
Link to the stream below:
https://t.co/dPK8EePLly
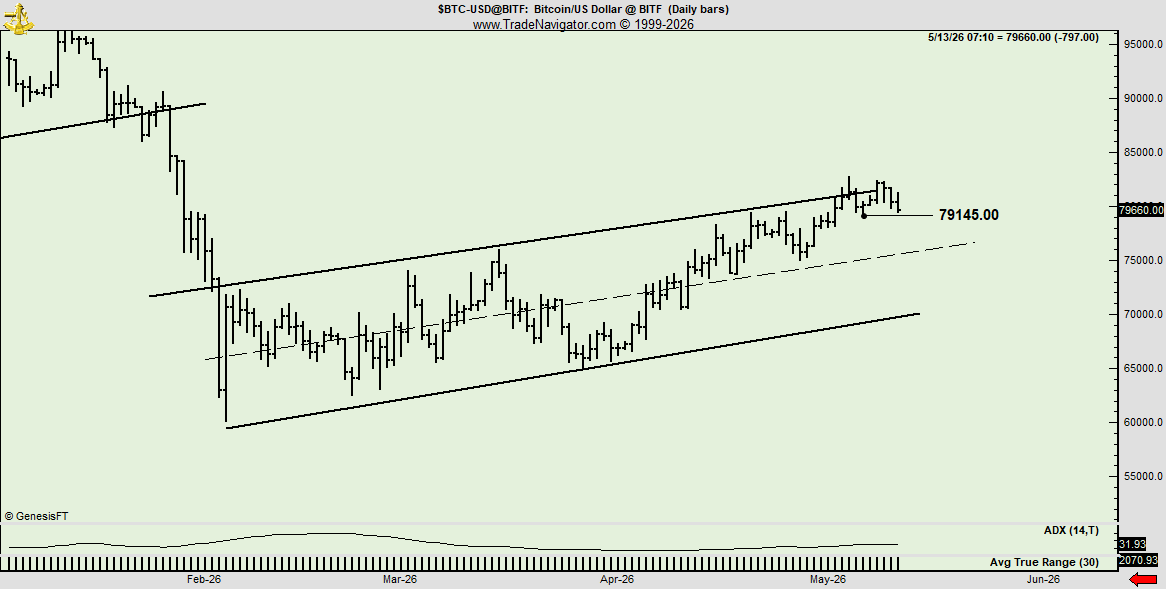
As 👁️ see it
A recognizable bottom has NOT NOT NOT been completed in Bitcoin. A possible bear channel exists from the Feb low. Price is being repealed from the upper boundary. An ATR close below 79145 would indicate a retreat back to mid point, then maybe the lower boundary
Sell in May? Not so fast. My May 2026 Trade Plan🧵
Sell in May and go away is real but it doesn't apply to everything.
April was a strong month across the board. But the setup heading into May is more nuanced than people think.
Here are my three trades for May. 👇