📌 Deep Dive Thread
In case you missed any of my Deep Dives, you can find them all below 👇
I’ll keep updating this thread whenever a new Deep Dive comes out.
If there’s a stock you’d like to see in a future Deep Dive, feel free to drop the ticker below 👇
Save this thread to keep all my long-term setups and research in one place. 🧵
$ZETA is not a bullish chart—but that doesn’t mean there’s no money to be made.
I currently see three scenarios:
1️⃣ Main scenario: Price drops into the green target box before continuing higher.
2️⃣ Price moves higher directly from here. However, with momentum weakening, I wouldn’t expect the blue target zone to be reached.
3️⃣ New lows—but first, price would need to break below the green zone and then $10.66.
You might say, “So price can go up or down?” But that misses the point.
The key takeaway is that $ZETA is currently not in a favorable risk-to-reward area. Sometimes patience is the best trade.
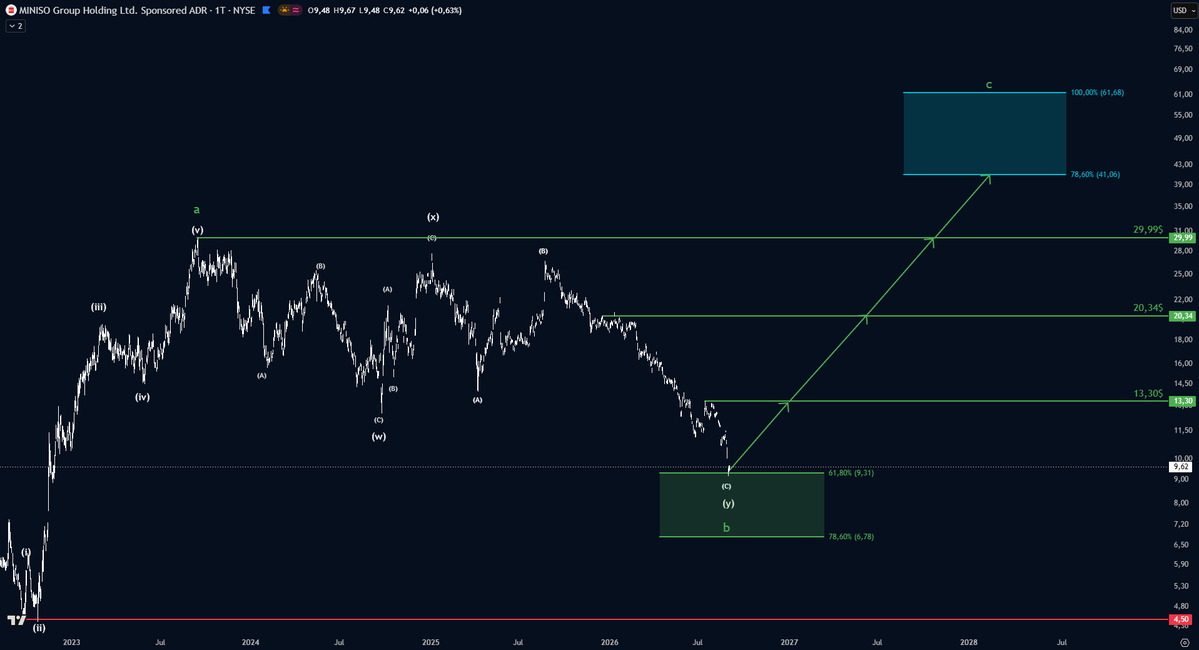
$MNSO revenue is sitting at all-time highs while the stock is down 53%. 👀
Eventually, the price should catch up with the fundamentals.
The stock is now testing a long-term DCA zone—an attractive area to slowly build a position.
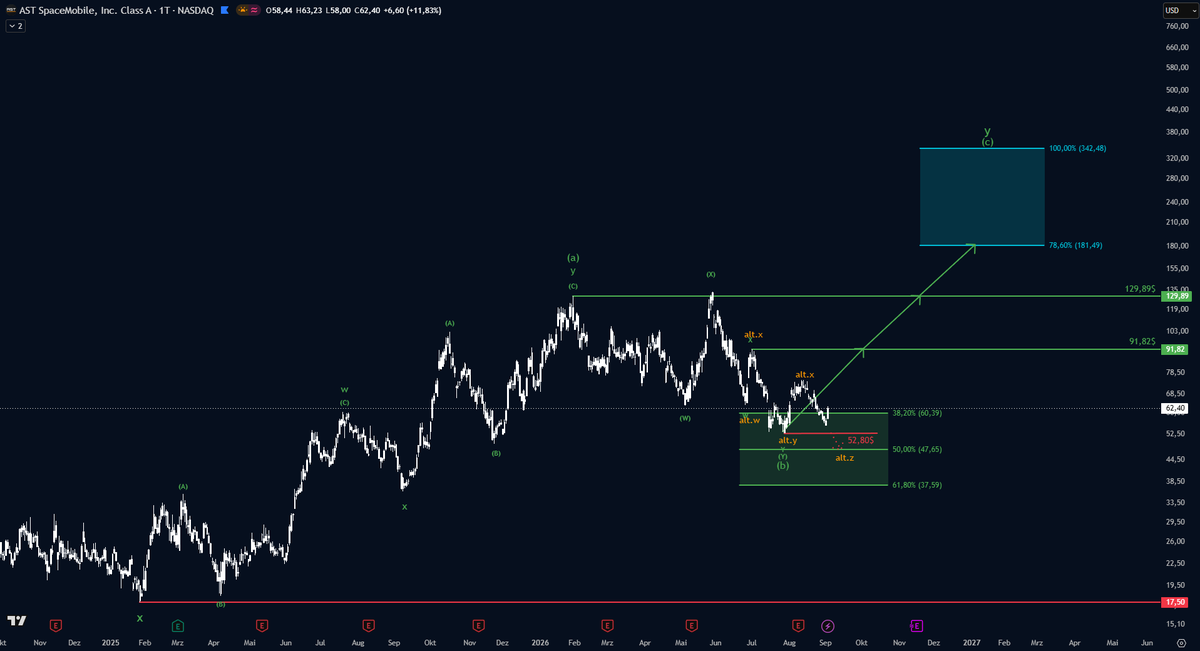
$ASTS is sitting around my long-term DCA area.
The bottom may already be in.
If we get a deeper pullback into the green zone, it would be an even better long-term buying opportunity.
No need to catch the exact bottom—DCA makes sense here.
Quick reminder: $NKE is getting very close to an attractive long-term DCA zone at $35.55–$19.14.
Calling the exact bottom is unrealistic, so scaling in makes more sense.
Long-term Wave (III) potential: +728%
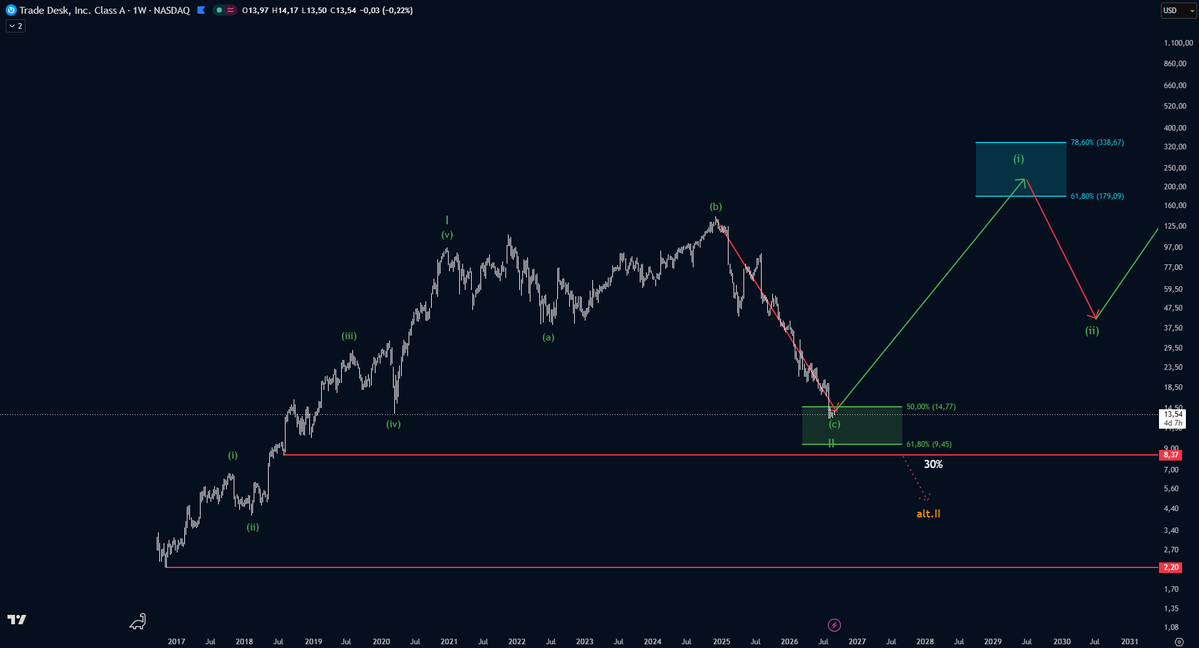
$TTD quick reminder 👀
The stock is still sitting in a very attractive long-term buy area.
Revenue keeps growing while the share price keeps falling.
If the business continues to deliver, I believe the price will eventually catch up.
This is exactly why $SE is so interesting to me 👀
Revenue since 2016: +8,703.6%
Stock price: +634.1%
The business kept growing while the stock remains far below its 2021 high.
Can the price catch up with its impressive revenue growth?
I think the odds are good.
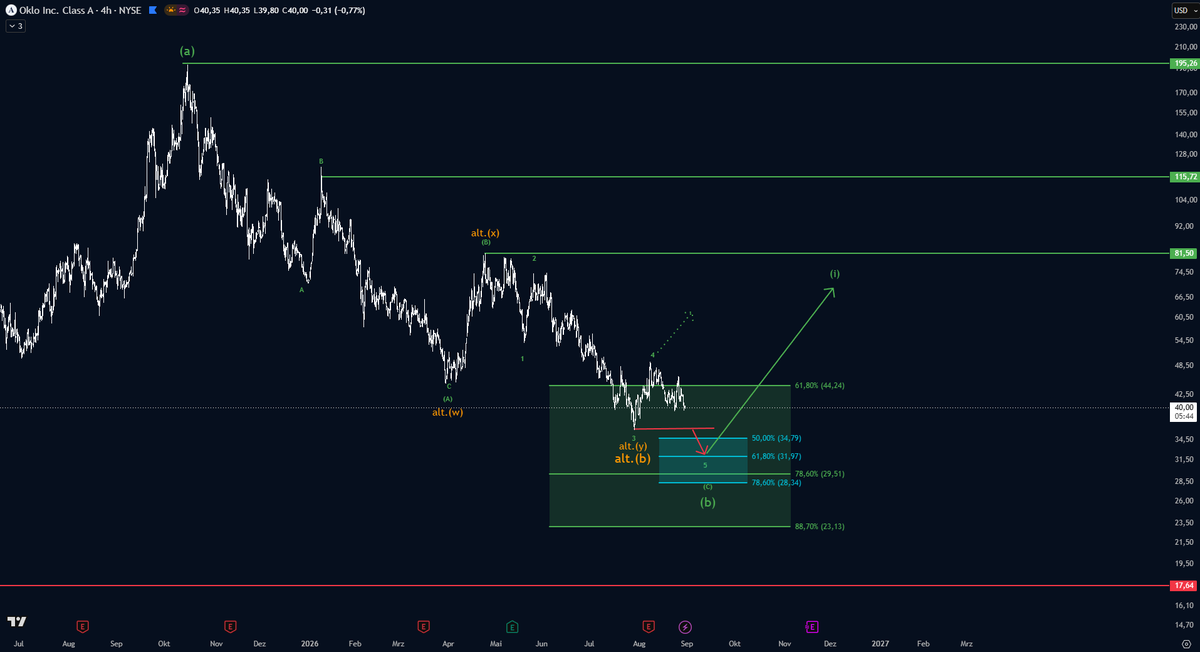
$OKLO short-term update
For now, I still expect one more low before this correction is complete. The main area I’m watching is around $35–$32.
But keep in mind: Wave 5 can be shallow, so even a small new low could be enough before a stronger reversal begins.
$TTD quick reminder 👀
The stock is still sitting in a very attractive long-term buy area.
Revenue keeps growing while the share price keeps falling.
If the business continues to deliver, I believe the price will eventually catch up.
This is exactly why $SE is so interesting to me 👀
Revenue since 2016: +8,703.6%
Stock price: +634.1%
The business kept growing while the stock remains far below its 2021 high.
Can the price catch up with its impressive revenue growth?
I think the odds are good.
$OKLO short-term update
For now, I still expect one more low before this correction is complete. The main area I’m watching is around $35–$32.
But keep in mind: Wave 5 can be shallow, so even a small new low could be enough before a stronger reversal begins.
$OKLO is getting interesting here 👀
Upside momentum is still there, and the daily RSI has plenty of room to push higher.
However, I still expect one more low because the weekly RSI doesn’t look fully oversold yet.
Key level to watch: $80.
A decisive break above $80 would heavily increase the probability that the bottom is already in and that the next major bullish leg has started.
For now, patience is key. 👀
#OKLO #Stocks #ElliottWave #TechnicalAnalysis #Investing
$ETH update 👀
I updated my count, but the key levels stayed almost the same.
Bulls want the green wave (b) pullback to hold the $1,848–$1,692 support area before ETH moves higher again.
Bears want a clear break below $1,692, which would open the door to new lows.
For now, this remains my alternative scenario because the latest move up came with strong momentum.
Overall, two of my three scenarios still point to another bottoming phase. Only one suggests the final low is already in.
The cycle also points to a potential bottom between September and December—either through the green wave (b) or through new lows.
bitcoin:native update 👀
For Bitcoin, $82,814 is still the key level to watch.
As long as BTC stays below it, I think new lows could come sooner than many expect. A break above it would keep the green scenario alive, with a wave (b) bottom first and another move higher after that.
The main difference compared to ETH is that I expect new lows in both BTC scenarios. The only question is whether BTC drops directly or moves higher one more time first.
The cycle points to a bottom between September and December. This could either be the green wave (b) low or already the move to new lows.
1/7 $EOSE DEEP DIVE 🧵
Price is inside my long-term DCA zone at $3.43–$1.26.
If the bullish structure confirms, my long-term target range sits at $25.85–$96.69—roughly +650% to +2,700% from current levels.
But the path won’t be straight. Let’s break it down