This is the commit that has GPG-signed by Toly https://t.co/AZcy2NGcQ5
The only contributor in the Percolatorlabs/Percolator is Toly and Claude, if this specific one is verified, you think the rest are spoof? He is mostly highly concerned for the security so I doubt it's spoof or altered this Percolator organization in Github. This commit describe his work so he signed it with GPG so no other people can claim it.
That is correct you can spoof a commit. But this commit is verified by Toly himself.
Verifying the commit prevents anyone to spoof it. This is a GPG-signed commit by Toly.
https://t.co/dyBCAeMySF
Other commits are authored via his personal email.
If you have a Github in your computer, open the Git Bash and verify the https://t.co/F1uXN3wSoU signature by using this code:
git log --show-signature --oneline
You will see that the author of README of the Percolatorlabs/Percolator is Toly connected with his email. Please do not spam his email.
I will share more information along the way but I think it's not necessary at the moment at this low MC. Bundlers will eat this project and destroy it.
Exchange outflows are still happening.
But they’re no longer moving price the same way.
➢ Netflow (Apr 4): -862.69 $BTC (CryptoQuant)
➢ $BTC price: ~$66.9K
➢ Recent sessions show persistent net outflows
Historically, sustained outflows signaled strong accumulation.
Coins leaving exchanges reduced available supply and pushed price higher.
That reflexivity looks weaker now.
Outflows are still present, but price response is muted.
At the same time, ETF flows have stabilized and derivatives positioning has cooled.
So liquidity hasn’t disappeared.
It’s just behaving differently.
The marginal buyer is no longer momentum-driven.
They’re more selective, more price-sensitive, and less reliant on leverage.
This shifts how flows should be interpreted.
Outflows are no longer a standalone bullish signal.
They need confirmation from positioning and demand.
This is what a more mature market looks like.
Flow quality starts to matter more than flow direction.
We’re moving from a market where liquidity chases narratives
to one where liquidity is allocated with constraints.
Always lovely seeing tradFi exposure looking like native onchain :)
deSPXA bringing S&P 500 access into DeFi where you can trade, borrow and loop it into strategies..
The big take:
> non-US users exposure to the S&P 500 via the Anemoy S&P 500 Index Fund (SPXA).
> mint/redeem at NAV (like ETFs, but onchain)
> 24/7 trading (unlike traditional markets)
> fully usable in DeFi
I’ve never been this excited for such a thing. imho, this is the real shift!
+ it’s centrifuge, so i’m bullish!
(if you’ve been following me, yunno i am always interested in what centrifuge builds! this is one of em!)
Stablecoins have become the monetary base of crypto, with total supply exceeding $315.82B.
They underpin trading, lending, payments, and settlement across both CeFi and DeFi. But supply alone no longer explains market structure.
The shift is analytical.
From measuring how much capital exists
to understanding how actively that capital is used.
This introduces a second dimension to stablecoin analysis: velocity.
● Market Overview
As of March 2026:
➤ Total stablecoin market cap: $315B+
➤ Total holders: 240M+ addresses
➤ Continued expansion across major issuers
Market structure remains concentrated:
➤ USDT dominates exchange liquidity and cross-border settlement
➤ USDC anchors institutional flows and DeFi collateral
At the same time, new entrants are scaling through alternative growth models.
Supply growth alone does not indicate whether stablecoins are actively used or simply held.
● Core Framework: Velocity vs Supply
Stablecoin analysis has historically focused on stock metrics:
➤ Total supply
➤ Market share
➤ Issuer dominance
These measure presence, not activity.
A more complete framework separates:
Supply (Stock)
Total issued stablecoins.
Velocity (Flow)
How frequently stablecoins move across the system:
➤ Transaction volume
➤ Transfer frequency
➤ Deployment across trading, lending, and payments
This distinction is structural.
A network can accumulate large supply with limited activity.
Another can generate high economic throughput with less capital.
Velocity introduces a measure of capital efficiency.
How much economic activity is generated per dollar of stablecoin supply.
● Chain & Network Snapshots
Tron: High-Velocity Settlement Layer
➤ Dominant network for USDT transfers
➤ High transaction frequency
➤ Widely used for payments and exchange settlement
Tron functions as a movement layer, optimized for speed and cost rather than capital density.
Ethereum: Capital-Dense Liquidity Hub
➤ Large share of USDC supply
➤ Deep integration with DeFi protocols
➤ Lower relative transfer frequency
Ethereum prioritizes capital concentration and acts as the primary collateral base for DeFi.
Solana: Throughput-Driven Trading Layer
➤ Rapid growth in stablecoin usage tied to trading
➤ High transaction throughput
➤ Strong DEX integration
Solana’s velocity is driven by execution demand, particularly in high-frequency trading environments.
● New Entrants: Distribution-Led Growth (USD1)
➤ Rapid ascent into top stablecoin ranks by market cap
➤ Backed by U.S. Treasuries and cash equivalents
➤ Custody via institutional infrastructure (BitGo)
➤ Early distribution anchored through Binance
USD1 is not optimizing for onchain velocity at launch.
It is scaling through:
➤ Exchange distribution (Binance as primary access layer)
➤ Institutional-grade backing and custody
➤ Yield positioning where applicable
This introduces a second growth path in stablecoins.
Velocity-led systems grow through usage.
Distribution-led systems grow through access first.
● How the System Is Dividing
Stablecoins are no longer competing along a single axis.
The market is segmenting across distinct roles:
➤ Movement → Tron
➤ Collateral → Ethereum
➤ Trading → Solana
This reflects a structural shift.
Supply is no longer the dominant signal.
Usage and access are becoming the defining variables.
The edge is moving from issuance to capital efficiency.
● Market Impact
1. Supply is an incomplete metric without usage context
2. Transaction volume and turnover better reflect real demand
3. Chains are specializing into distinct stablecoin roles
4. Capital efficiency is emerging as a core benchmark
5. Distribution can scale supply before onchain activity materializes
The landscape now spans three layers:
➤ Issuers compete on trust and backing
➤ Chains compete on velocity and throughput
➤ Platforms compete on distribution and access
● My Take
Stablecoin dominance is no longer defined by who issues the most, but by who turns supply into movement.
The catch-up trade was always $ETH.
Not because of direction.
Because of where relative value broke.
ETH/BTC printed 0.028 in early February.
That level compressed months of underperformance into a single entry.
Today it’s 0.031.
10% higher, with no new narrative required.
Why it worked:
1. Positioning was already spent: Rotation out of $ETH had been ongoing. By the time 0.028 hit, most of the move was behind it.
2. It pays you to wait: ~3–4% staking yield vs $BTC’s 0%. Carry starts to matter once volatility compresses.
3. Supply adjusts with activity: EIP-1559 isn’t static. As usage returns, issuance compresses. Float tightens.
4. Flows move in sequence: $BTC gets first allocation. $ETH follows. The lag is structural, not random.
So this wasn’t a momentum trade.
It was a re-pricing of structure.
An asset with:
➤ yield
➤ tightening supply
➤ and delayed flows
trading too cheap relative to $BTC.
0.028 was the opportunity.
0.031 is just the market catching up.
And those second-leg moves tend to be the most efficient ones.
$3.5T AUM isn’t "testing" crypto anymore. they’re literally rebuilding the whole game on-chain.
With Apex Group now utilizing @worldlibertyfi's USD1 to settle $3.5 trillion in fund flows, the 'RWA meme' is officially dead. It’s no longer a roadmap; it’s the new global infrastructure.
The maldives resort is the flashy storefront, but the Apex integration is the back-end engine for the next 10 years.
Here is the play:
➤ apex shifting to USD1 for subscriptions/redemptions across 30k+ funds
➤ mobile app bridging bank accounts to digital wallets = pure retail vacuum
➤ LSEG (london stock exchange) secondary liquidity incoming
People think it's about a hotel. it’s actually about the Infrastructure. When the biggest fund admins in the world ditch old system, and starts utilizing a Stablecoin, it already won.
You either get it or you don’t.
Bitcoin entered February following a material January drawdown.
As of February 9, 2026, $BTC trades near $70,000, with market sentiment registering Extreme Fear (9).
That context is useful only where it aligns with historical positioning resets, not because February is “bullish by default.”
● Seasonal Context (Historical, Not Predictive)
Over the past 13 years, February has coincided with rebounds only when January closed deeply negative and leverage had already reset:
➣ Win rate: 69.2% (9 / 13 positive)
➣ Average return: +14.3%
➣ Median return: +12.2%
➣ Post-red-January rebound rate: 80%
Exceptions (2014, 2025) occurred when positioning failed to fully clear.
Seasonality does not cause reversals.
It only appears after risk is forced out of the system.
● Supply Is the Only Question Left
The relevant signal today is not price direction.
It is who is still able to sell.
Over the past two weeks:
➣ Open interest has fallen materially from January highs
➣ Funding rates remain compressed to negative across majors
➣ Risk has been reduced because it had to be, not because sentiment improved
At Fear = 9, exits stop being optional.
Remaining supply is increasingly non-discretionary.
This is a positioning reset, not a confidence shift.
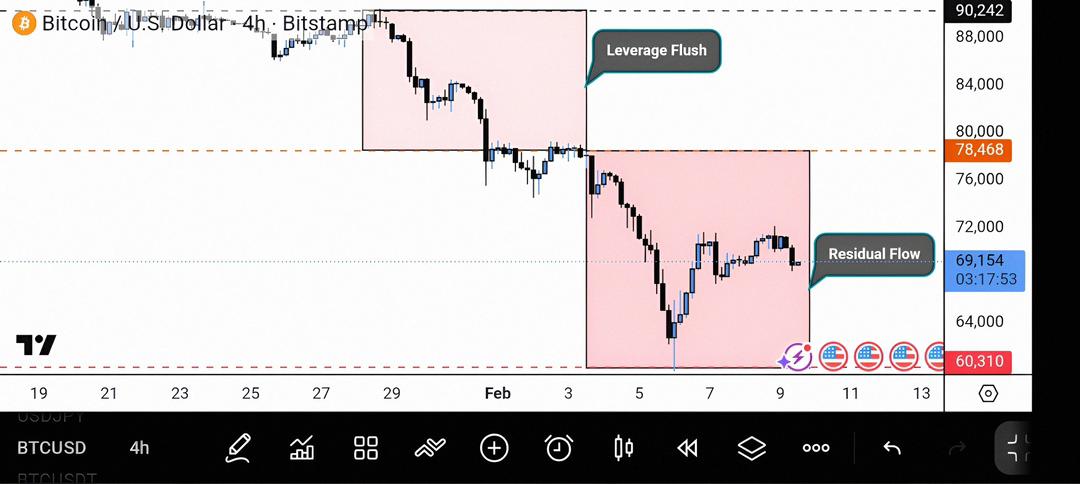
● Leverage Has Already Moved
The leverage unwind occurred before this print.
➣ January leverage was flushed during the $90K → $78K leg
➣ The $78K → $60K extension reflects residual spot and ETF-linked flow
➣ Short positioning has increased into declining volatility
That combination is the signal.
When leverage clears first and price continues lower, the marginal seller is no longer a trader.
It is balance-sheet driven.
● What the Market Is Actually Doing
This environment produces three mechanical outcomes:
1. Volatility compresses after expansion
2. Shorts accumulate into falling liquidity
3. Price discovery becomes flow-dependent, not narrative-driven
At Fear = 9, price can still move lower.
But downside now requires new supply, not continuation selling.
That distinction is structural.
● This Is About Structure, Not Calls
This is not a bottom call.
This is not a rebound forecast.
This does not assume macro relief or ETF reversal.
It says only this:
The market has transitioned from positioning risk to flow risk.
That is a different phase.
● My Take
$BTC at $69K with Fear at 9 isn’t bullish or bearish. It’s mechanical. Forced selling is close to done.
Markets don’t bottom on confidence.
They bottom when sellers are finished and risk can’t be cut anymore.
The system is still clearing. When it’s done, price moves by default, not belief.