Hello X, I wanted to share what I have been working on for the past few months:
This Q2 report covers Aave protocols full on-chain financial activity for the first half of 2026. The report covers over 1.3 Million transactions over 2,000 addresses and contracts.
The main statements (only Ethereum is covered) are:
- Full Aave protocol income statement
- Full Aave protocol balance sheet
- Aave DAO Treasury cashflow
- Aave DAO balance sheet
The financials aren't built by hand. I created a data pipeline that extracts blockchain txns from RPC nodes, classifies accounts based on token movement and log traces, then transforms the classifications into journal entries. Then I built some custom agent skills to connect the classification to accounting standards.
INSANE
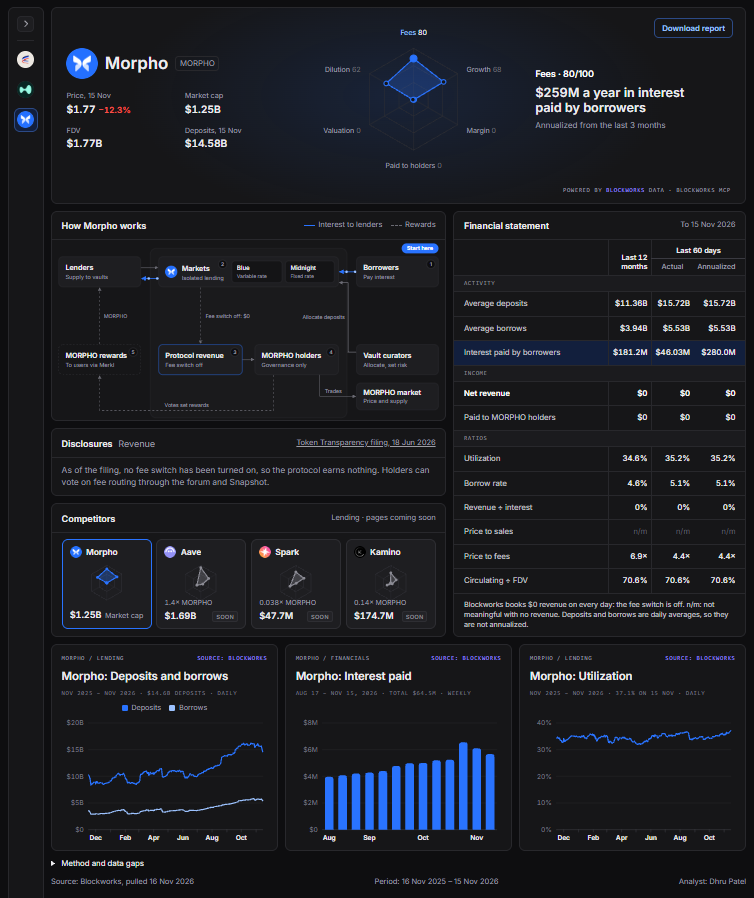
@Morpho I created an analytical portal for $MORPHO utilizing the Blockworks MCP.
Key Takeaways from the data:
✘ Big lending business: borrowers pay about $259M a year in interest, and interest paid grew 18.1% over the last 4 weeks.
✘ Holders get nothing yet: the fee switch is off, so the protocol keeps none of that interest and nothing is paid to MORPHO holders.
✘ Valuation: with no revenue to measure, market cap is 4.4× a year of the interest borrowers pay.
✘ Dilution is light: unlocks add 3.8% to circulating supply over the next 3 months, and 70.6% of the full supply is already circulating.
✘ From the Token Transparency filing: three investor rounds sold about 25.5% of supply, and the last one vests through November 2027. The filing is marked partial with 11 gaps, including confidential market-maker and listing terms and confidential grants that pay integrators to bring in deposits.
Aave has about 1.8× Morpho’s deposits ($26.7B vs $14.6B), and its borrowers paid about 1.5× more interest over the last 30 days ($37.0M vs $25.0M). Yet Aave is valued only about 1.35× higher ($1.69B vs $1.25B). The difference is that Aave keeps about 14% of that interest as revenue, while Morpho keeps none. Deposits fell at both over the month, Morpho’s by less (−8% vs −14%)
I Created an analytical portal for $AERO utilizing the blockworks MCP.
Key Takeaways from the data:
✘ Nearly everything goes to holders: veAERO voters get 100% of fees and incentives, and with buybacks on top, payouts were 104% of net revenue over the last 60 days.
✘ Margin is near-perfect: 97% of the ~$106M a year in swap fees becomes revenue.
✘ Growth is the soft spot: swap fees fell 7.5% over the last 4 weeks while volume rose 39.6%, so each dollar traded paid less in fees.
✘ Valuation: market cap is 4.4× a year of revenue.
✘ From the Token Transparency filing: the team and Foundations have never sold AERO, and there was no fundraising. The gap is insider vesting, which is only partly disclosed.
@Uniswap is still about 3× bigger by volume and valued about 7× higher, but Aero’s volume grew about 54% over the past month while Uniswap’s stayed flat, and almost all of Aero’s fees go straight to people who lock AERO.
1/ NEW: Introducing the Blockworks MCP: our data, your agents.
Plug ChatGPT, Claude or any AI agent into every dataset we have and build whatever you can imagine.
Dear @JasonYanowitz, @shaundadevens, @Blockworks
With the Blockworks MCP $100 credits I created a protocol terminal for investors and Defi research tracking revenue, analytics, and disclosures on a single page.
With the $1,000 MCP credits I would expand this to other protocols and maintain on my website or a blockworks site.
The Key features include:
1. The Hexagon: Six scores from 0 to 100 including: Fees, Growth, Margin, Paid to holders, Valuation, and Dilution. Every protocol is scored on the same scale so the star graph shape can show what kind of business it is at a glance.
2. How it works (Protocol): A diagram of how money moves throughout the protocol, going from a user paying fees to holders receiving buybacks. Numbered steps to walk through in order.
3. Financial statement: Activity, income, and ratios over the last 12 months and last 60 days with annualized.
4. TTF disclosures: For each section we map what the Token Transparency filing says about it, with any gaps flagged. With each click you can explore more with transparency built in.
5. Everything's connected: Click a hexagon corner, a diagram box, or a statement row, and the whole page updates to match the readout, highlights, the disclosures, and charts.
The full demo is on 3 protocols:
$AERO
hyperliquid:native
ethereum:0x58d97b57bb95320f9a05dc918aef65434969c2b2
Live at:
https://t.co/PwZeaxkDAR
All powered by blockworks data.
Introducing the BLOCKWORKS COOKOFF!
Use the Blockworks MCP to ship something special and RT this post with a video/mockup breaking it down for your chance to win $1000 in credits for the MCP.
Here's how to get started:
1. Sign up for your free $100 of MCP credits https://t.co/mbh0Pjlwj8
2. Connect the MCP to your favorite AI agent
3. Get cooking
Let's see what you got.
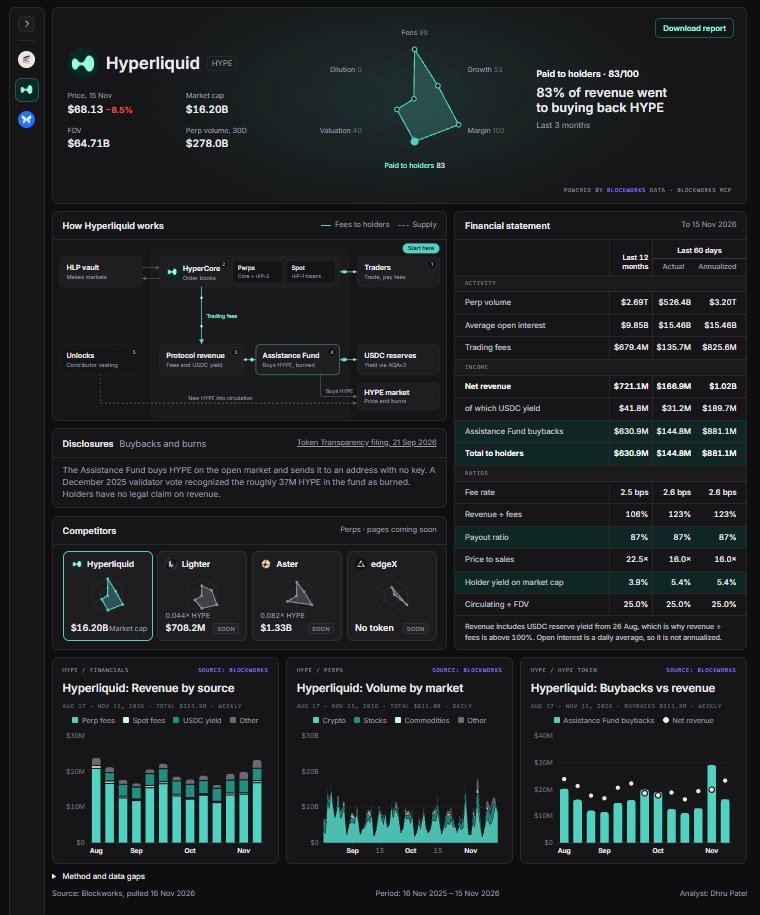
I created an analytical portal for $HYPE utilizing the Blockworks MCP.
Key Takeaways from the data:
✘ Buybacks are the payout: 83% of revenue over the last 3 months went to buying HYPE on the open market, and that HYPE is sent to an address with no key, so it’s effectively burned.
✘ Fees are huge and still growing: about $859M a year in trading fees, up 3% over the last 4 weeks. Since August, yield on its USDC reserves adds revenue on top of fees, so revenue was 123% of fees over the last 60 days.
✘ Valuation: market cap is 15.8× a year of revenue.
✘ Dilution is the soft spot: scheduled unlocks add 10.8% to circulating supply over the next 3 months, and only 25% of the full supply is circulating today.
✘ From the Token Transparency filing: there was no fundraising, OTC or discounted token sale, and the genesis airdrop gave 31% of supply to past users for free. The gaps are that the 38.9% emissions reserve has no published release schedule, and Hyperliquid Labs’ ownership isn’t disclosed.
Hyperliquid did $278B in perp volume over the last 30 days, about 3.4× Lighter ($81.5B) and 5.7× Aster ($48.6B). It also grew faster than both over the month (+32% vs about +22%). The market prices in that lead: HYPE’s market cap is about 23× Lighter’s and 12× Aster’s.
@Blockworks this is my submission to your Blockworks MCP Cookoff:
I created a financial terminal for DeFi protocols where investors and retail can learn about protocols make up and financials.
Problem:
You have a lot of data but low focus. AERO alone has over 100 charts, which is information overload to the average viewer.
They don't know where to start and what to see.
My Solution:
A single page protocol overview where the analytics change based on your exploraroty interests. All transparent by connecting in the Token Transparency Framework for disclosures.
Here are the key Features:
1. Hexagon character overview: shows a high level of the protocols focus and its positioning over all.
2. A Infrastructure overview: This is a visual diagram that explains how the protocol makes money. When users click on each section they will be shown the TTF disclosure and highlights along with charts will change to the most relevant analytics and financials.
3. Financial Statements: These are the high level financials to the protocol more often then not showing total revenue and buybacks if applicable.
4. Competition: See other comparable protocols and how they stack up in terms of multiples.
5. Dynamic Analytics: The analytics that are shown can be changes with a click of the diagram sectors or selecting the how it works diagram. We have mapped the most relevant analytics that blockworks has through the MCP to the selection for the most relevant information.
All of the data and charts are pulled from the Blockworks MCP.
Full Demo:
https://t.co/TN0yMXbBTp
Relevant People: @JasonYanowitz@shaundadevens@Blockworks
Introducing the BLOCKWORKS COOKOFF!
Use the Blockworks MCP to ship something special and RT this post with a video/mockup breaking it down for your chance to win $1000 in credits for the MCP.
Here's how to get started:
1. Sign up for your free $100 of MCP credits https://t.co/mbh0Pjlwj8
2. Connect the MCP to your favorite AI agent
3. Get cooking
Let's see what you got.