Interdisciplinary research lab @helsinkiuni. Spatial big data analytics on a human scale for fair and sustainable societies. Inactive account, see 📍
We will be inactive in X going forward. Let's stay in touch on our other channels!
Website: https://t.co/YieKb24VcF
Bsky: https://t.co/iyHijs948o
Mastodon: https://t.co/b56w0q25PP
LinkedIn: https://t.co/O2zXaa3i4j
In GREENTRAVEL we’re using #VirtualReality to explore how #GreenUrbanEnvironments impact our everyday active travel.
Ashish Shete explains what's happening behind the scenes 👉 https://t.co/0pP1PvDuyQ
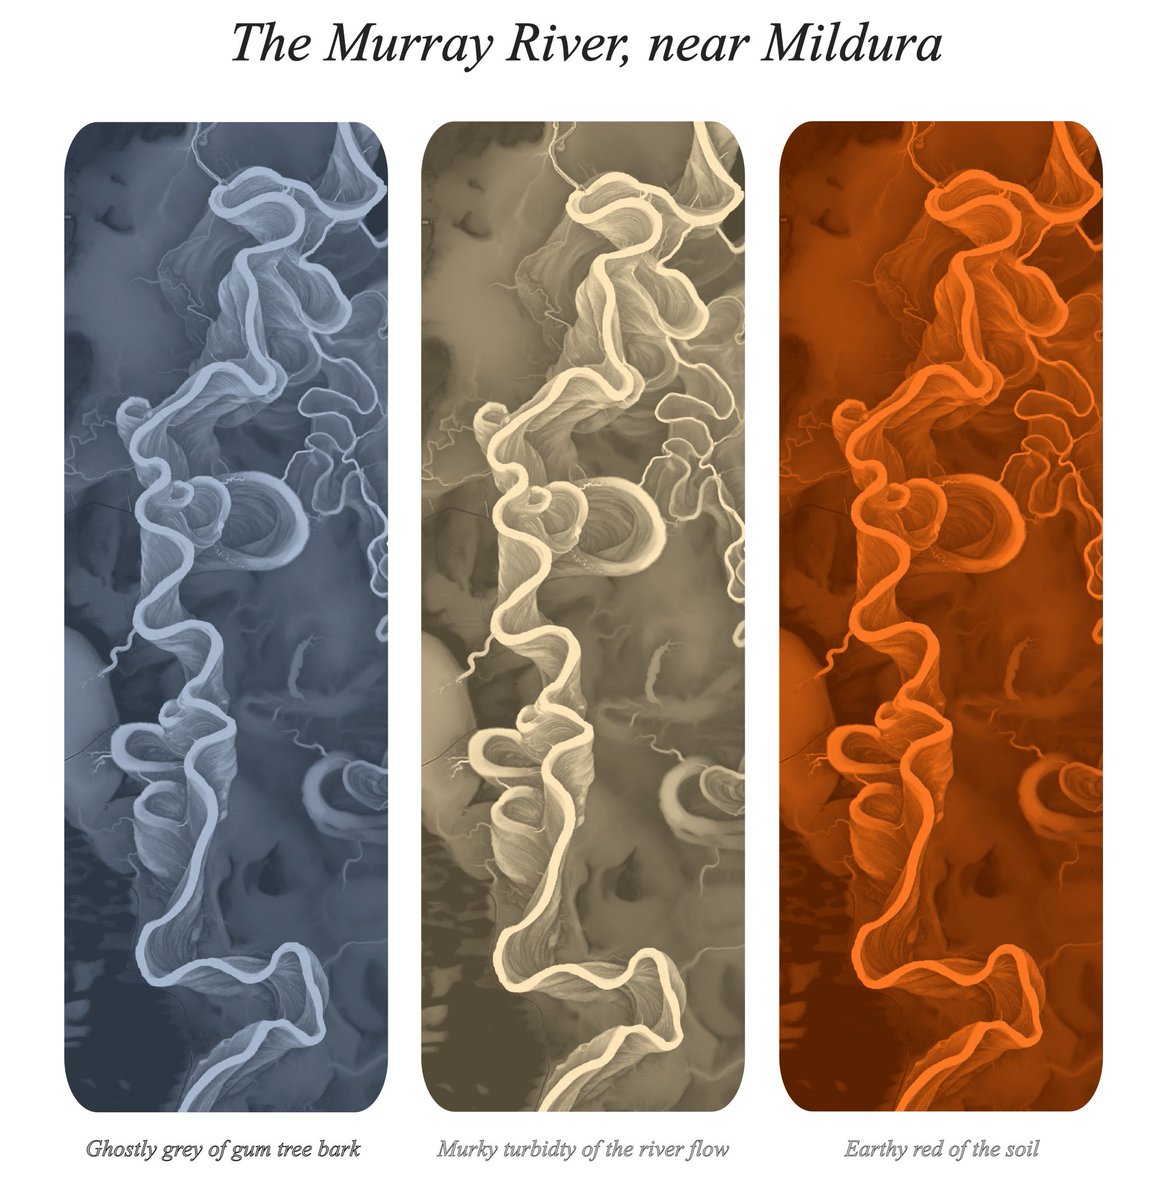
#30DayMapChallenge - Day 28 - The Blue Planet.
#RelativeElevationModel of the Murray River. Check out those meander scars!
Data source 👉 https://t.co/IrEpjqPGTx .
- by Rory Taylor
SAVE THE DATE: Friday 7th February 2025!!
Seminar hosted by the Digital Geography Lab: "Spatial big data research for fair and sustainable societies: Celebrating 15 years of the Digital Geography Lab at the University of Helsinki"
More details here 👉https://t.co/ERqnwAPRpL
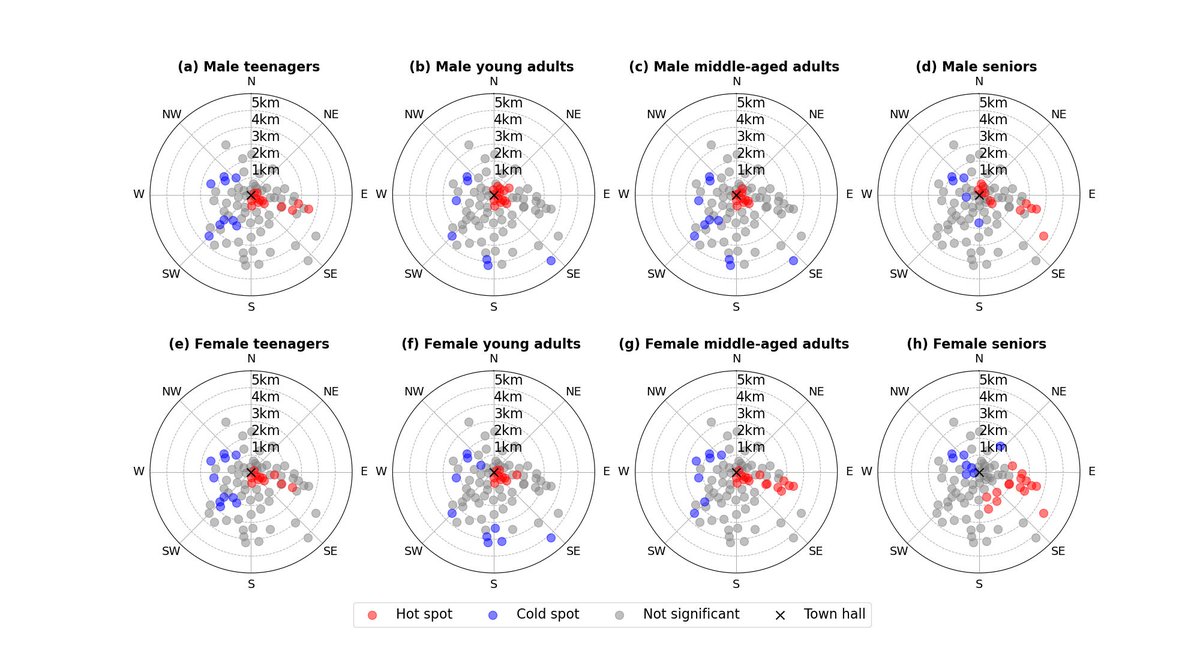
#30daymapchallenge Day 24 - Only circular shapes
Xiao Cai visualized the results of the hot spot analysis, comparing the age and gender differences in the bike-sharing usage patterns of eight demographic groups in Tartu, Estonia.
#hotspotanalysis#bikesharing#Tartu
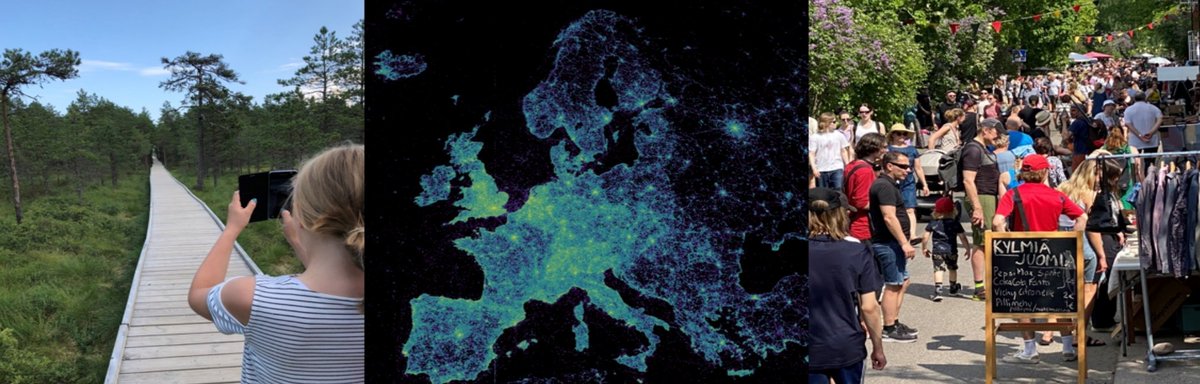
#30DayMapChallenge Day 20, #OpenStreetMap
Where are the users of #OSM? The daily logs from OSM's tile server give some hints 🌍
Data source: https://t.co/Meesqjmqb0
By: @tadusk0
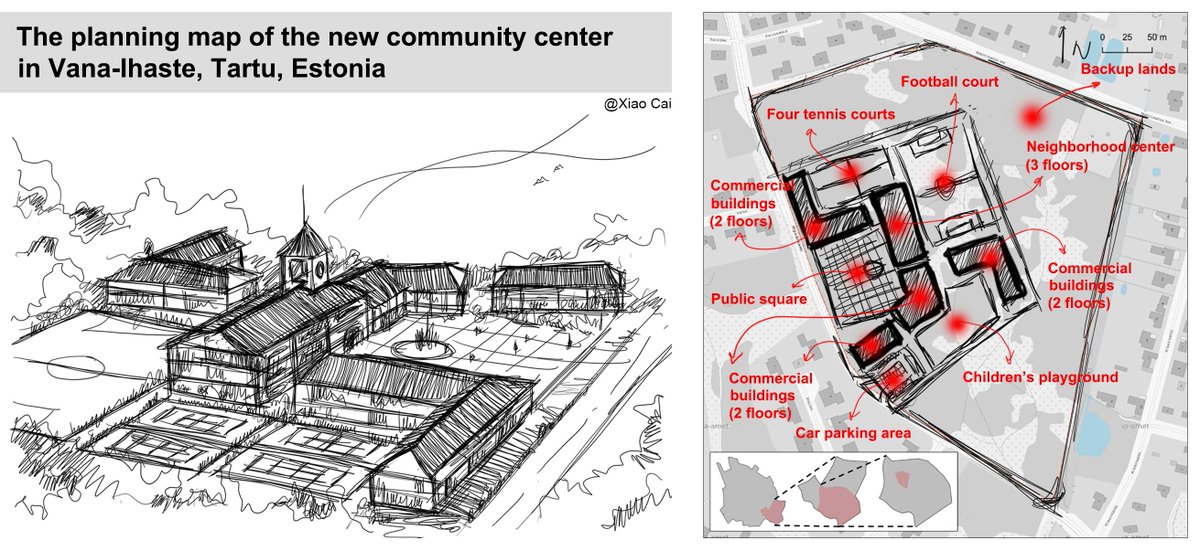
#30daymapchallenge day 10 - Pen & paper
This planning map (draft) was created by Xiao Cai. It aims to enhance the sense of community in the Vana-Ihaste neighborhood (Tartu, Estonia), as existing residents have no such public place to interact with each other.
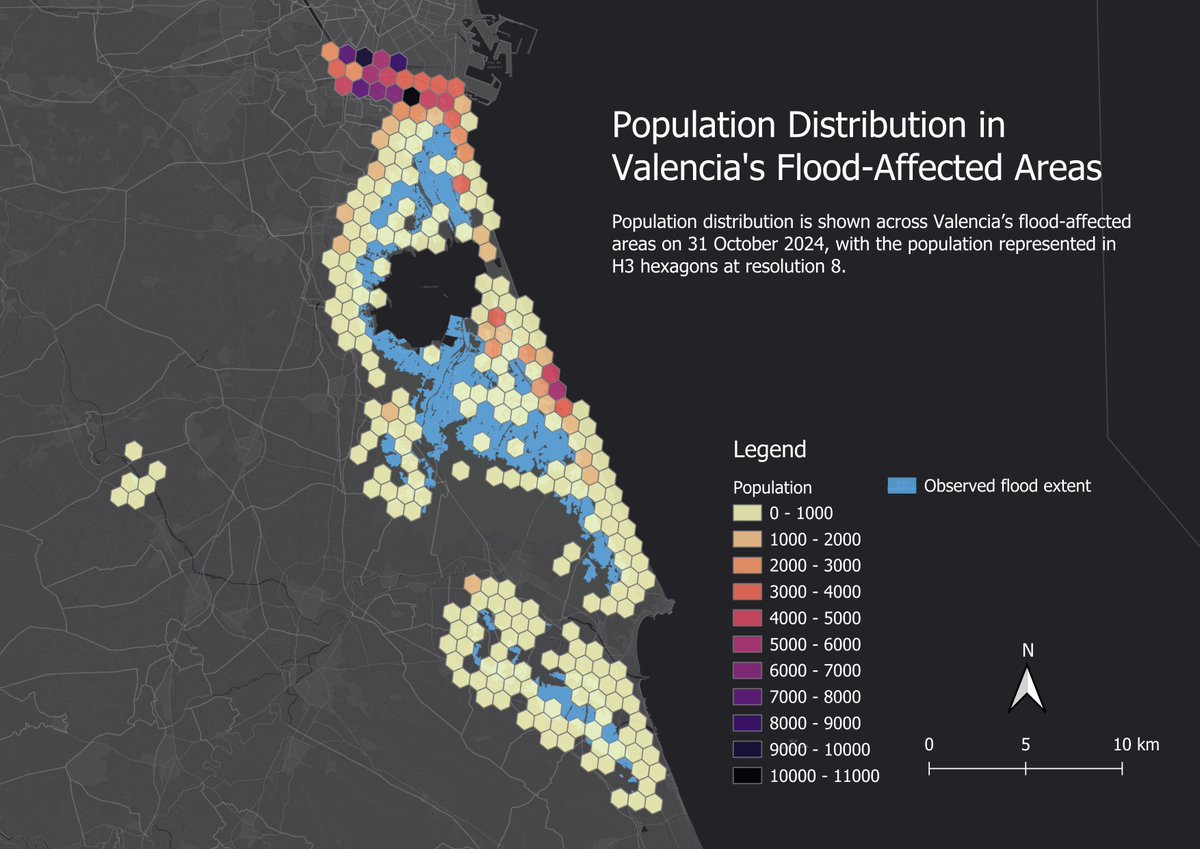
#30daymapchallenge day 8 - Humanitarian Data Exchange (HDX)
This map shows the population distribution across the observed #flood extent in Valencia on 31 October 2024.
Visualization: Leyi Xu
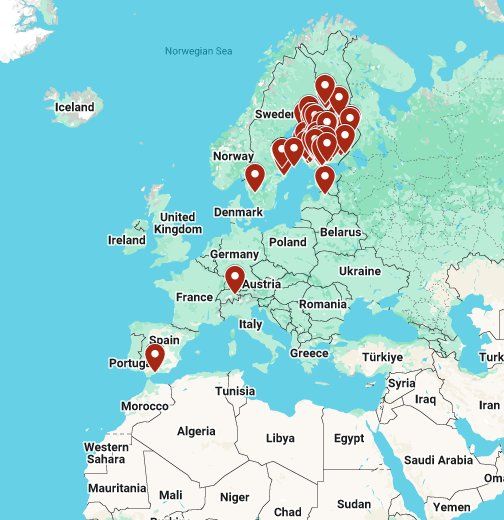
#30DayMapChallenge 5: Journey
Riku is a floorball champ! https://t.co/cqGXs19U6A
"Since 2000, I’ve played in 121 different venues in 🇫🇮🇸🇪🇱🇻🇨🇭🇪🇸. The list is still expanding, but only at a rate of 1–2 / year. 'Places where I’ve coached floorball' looks quite different! 🇫🇮🇸🇪🇪🇪🇨🇿"
Our contribution to the #30DayMapChallenge comes from @waeiski with special thanks to @polarboe. The map shows the value of aggregation and edge-bundling for complex mobility data. The data and methods will be published openly in the near future as a part of the @MobiTwinProject.
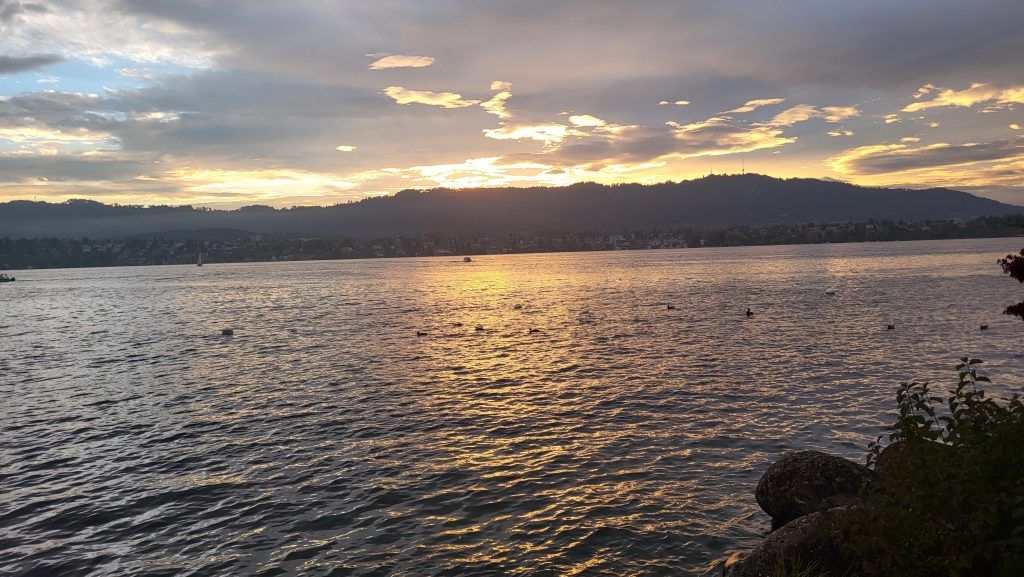
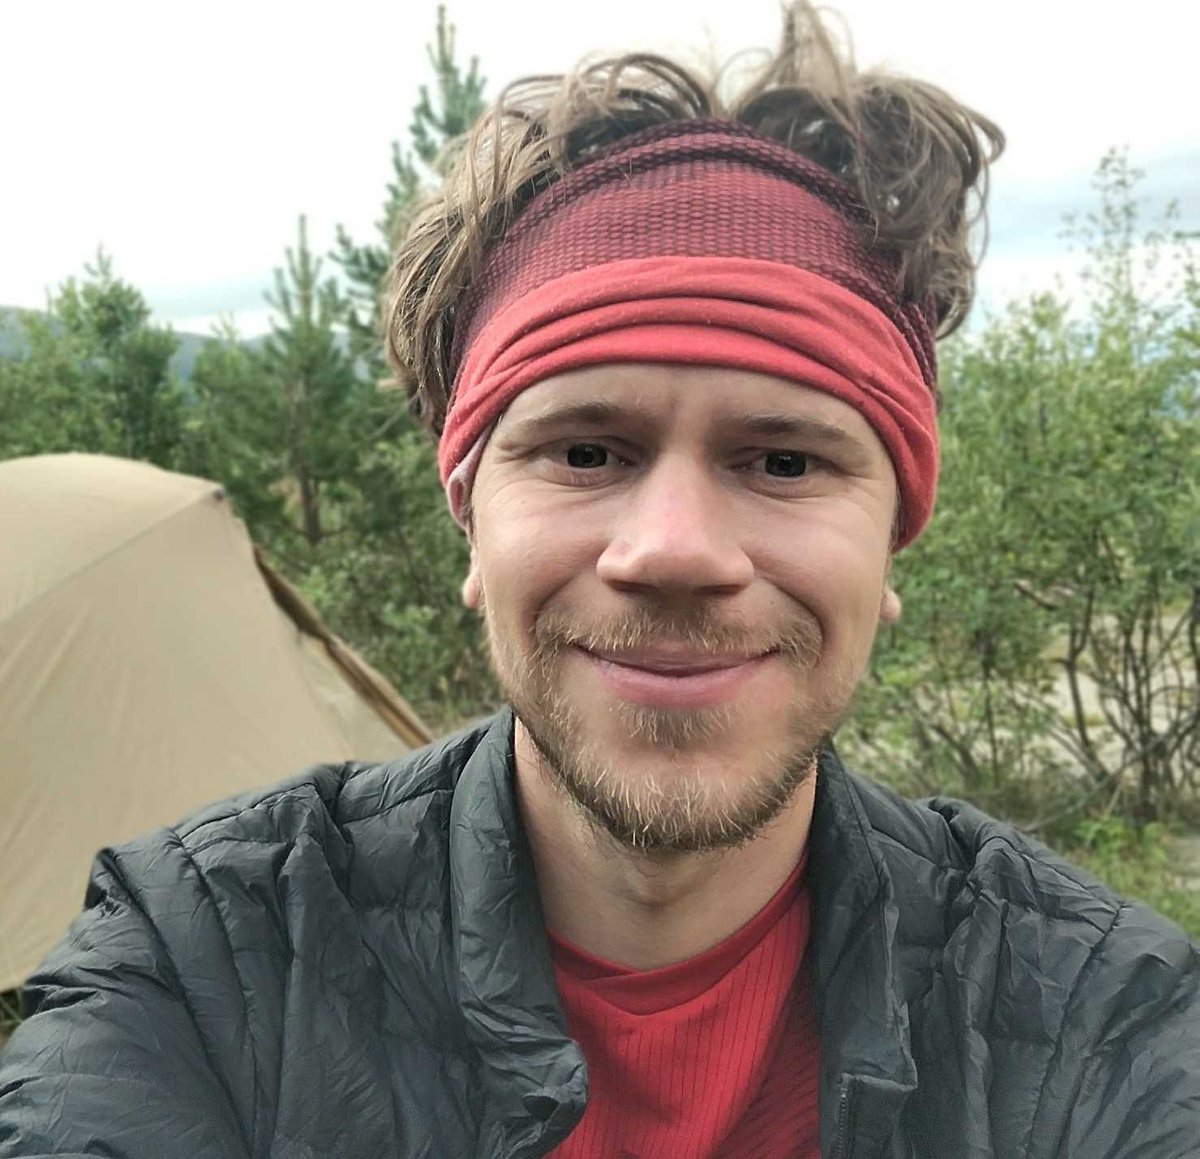
Tatu @tadusk0 from our lab has been visiting the geocomputation unit at the University of Zürich for a few months now. Check out what he's been up to in Switzerland in this travel diary 🏔️
https://t.co/4uozDHoDEm
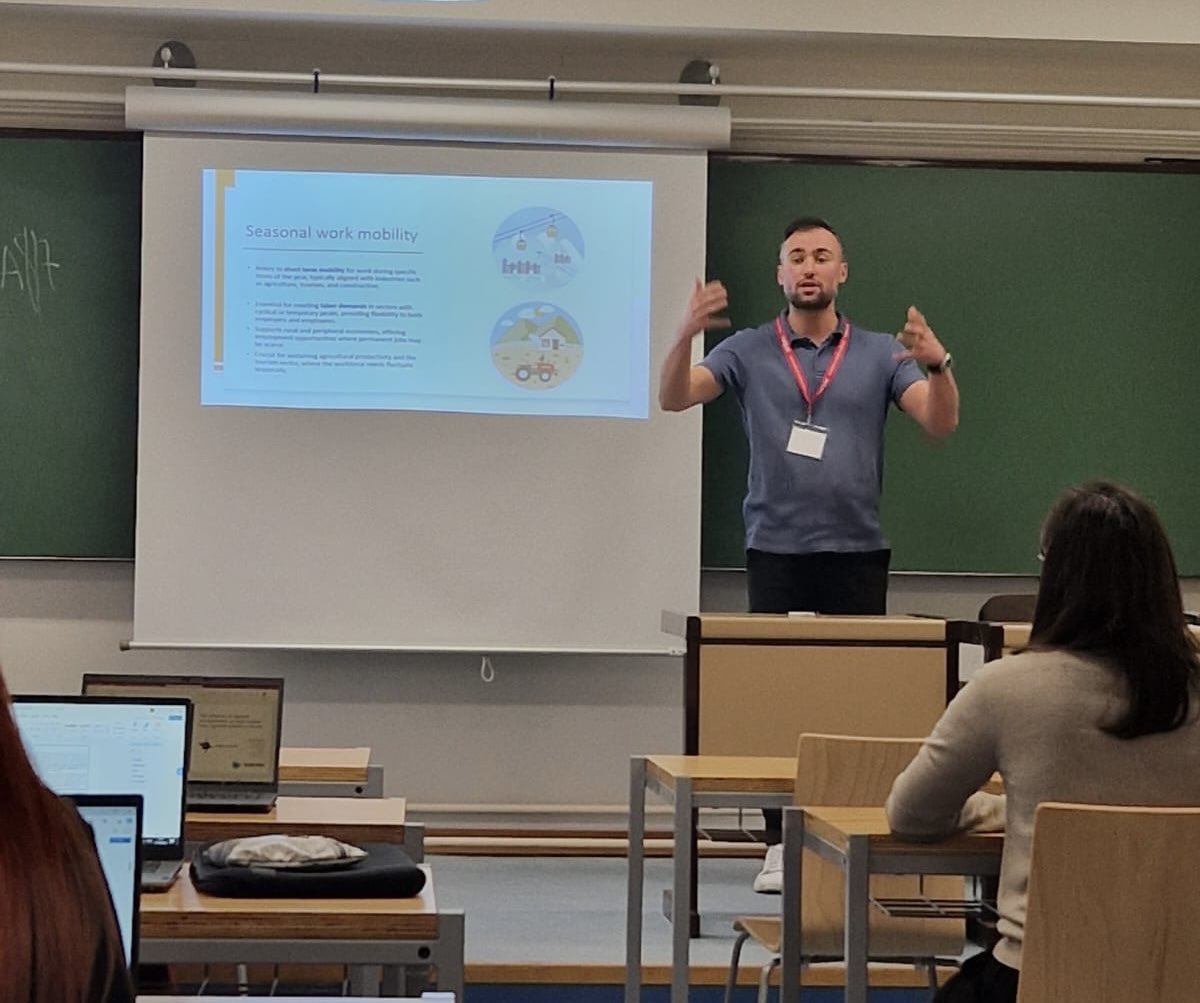
Presented at the International Conference on Regional Science in Cuenca for the MobiTwin project.
While this is not my usual focus, I was impressed by how advanced economists’ works are in statistics and had some awesome conversations with researchers there.
@MobiTwinProject
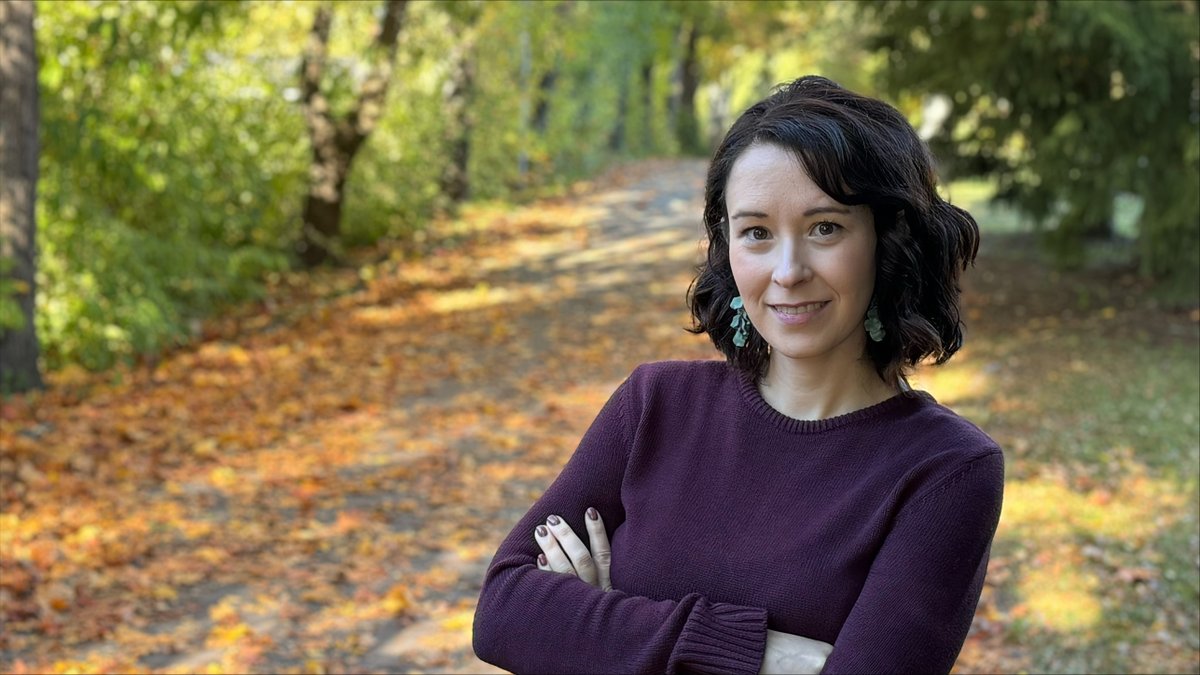
We are so so thrilled to introduce Rachel Robinson-Lehtinen as a new Research Coordinator in our lab fam. Rachel will be working to drive forward grant proposals and scientific project management at DGL. 🤩
Learn more about Rachel here: https://t.co/Ym7VeCTswX
Our team is growing😀! We are excited to introduce Rory Taylor as project planner at DGL!
Rory focuses on supporting the GREENTRAVEL project as well as the administration of broader lab activities🙏.
Learn more about Rory: https://t.co/a3GWRLrrYB
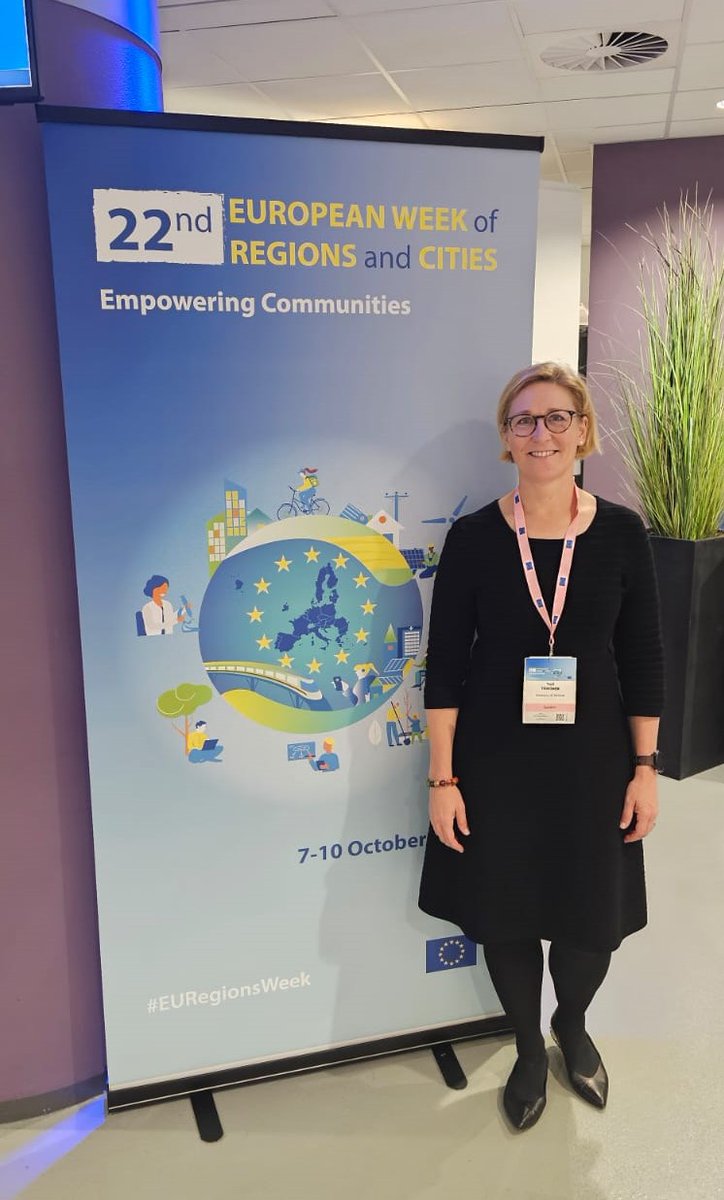
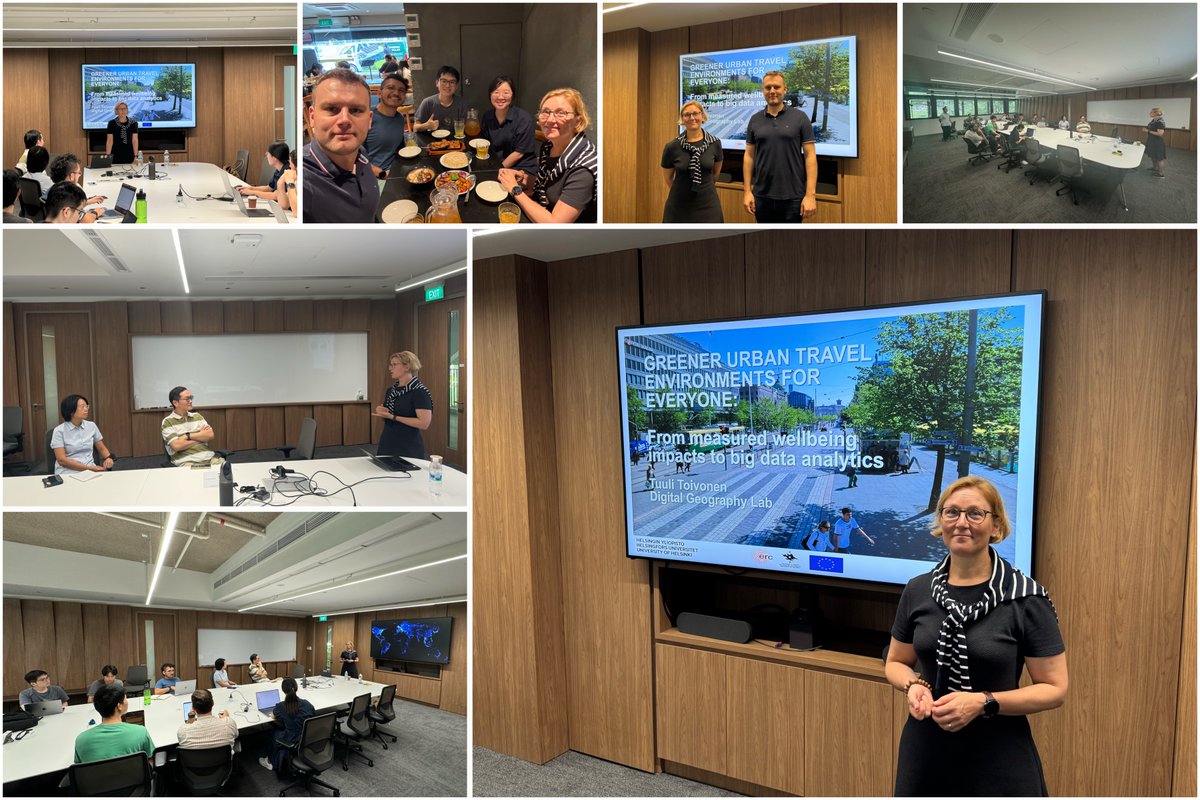
We were delighted to host Prof @TuuliToivonen @HelsinkiUni 🇫🇮 for a visit to our research group @NUSingapore earlier today! We are thankful for her time and for sharing the impressive work of @digigeolab. We look forward to welcoming more distinguished guests in the near future.