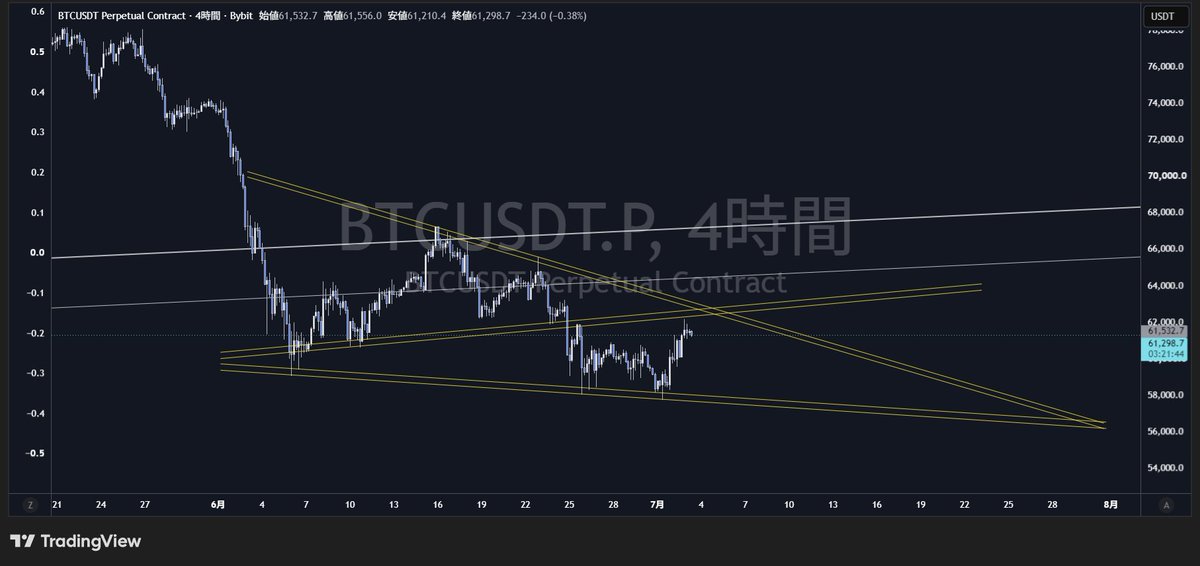
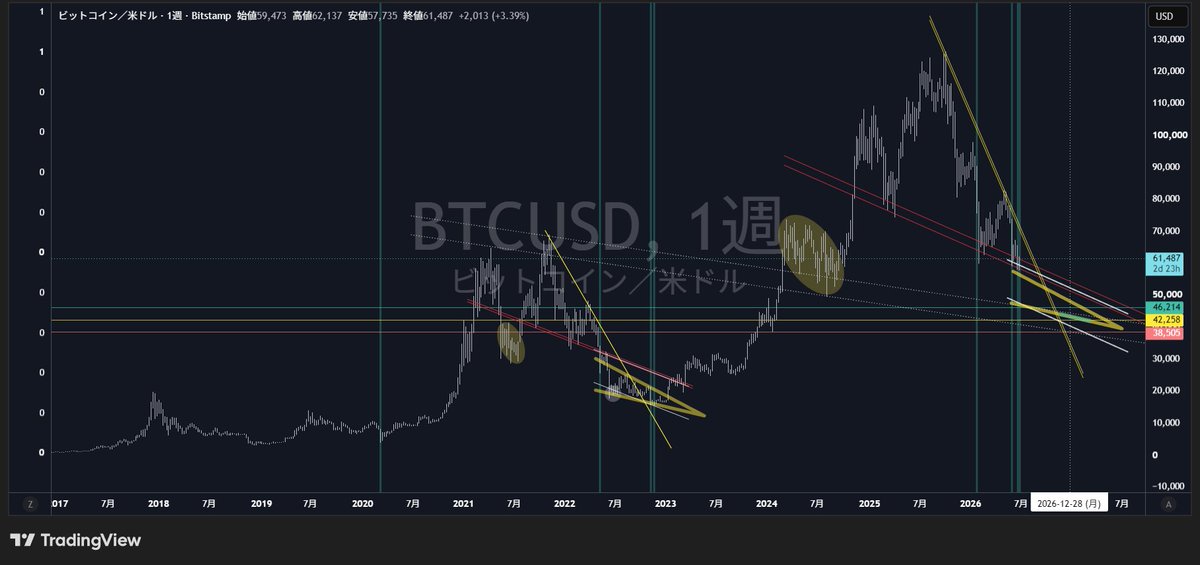
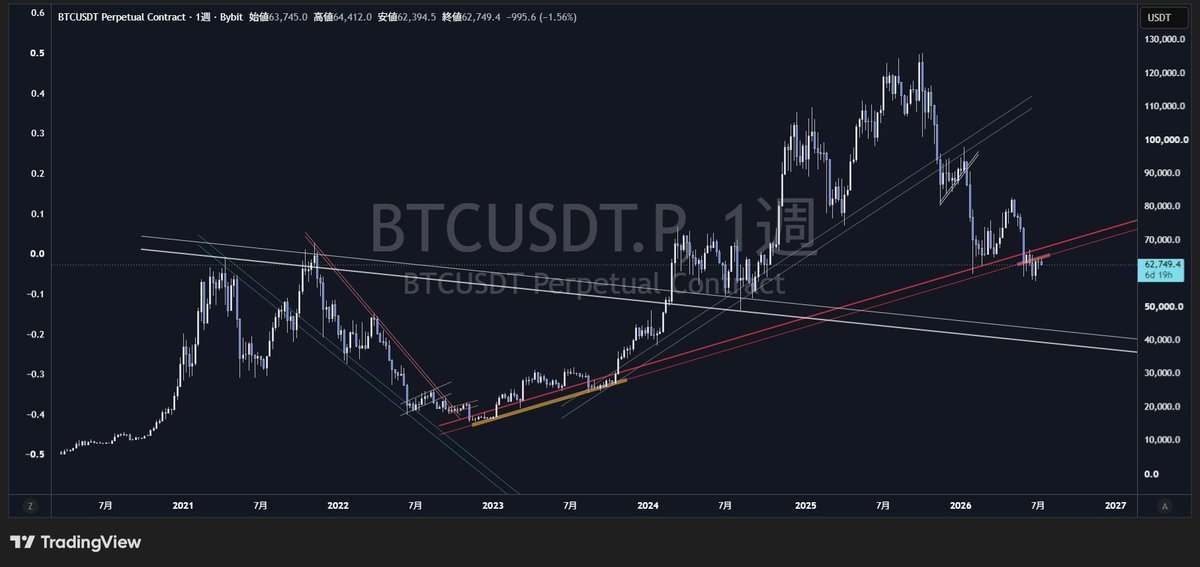
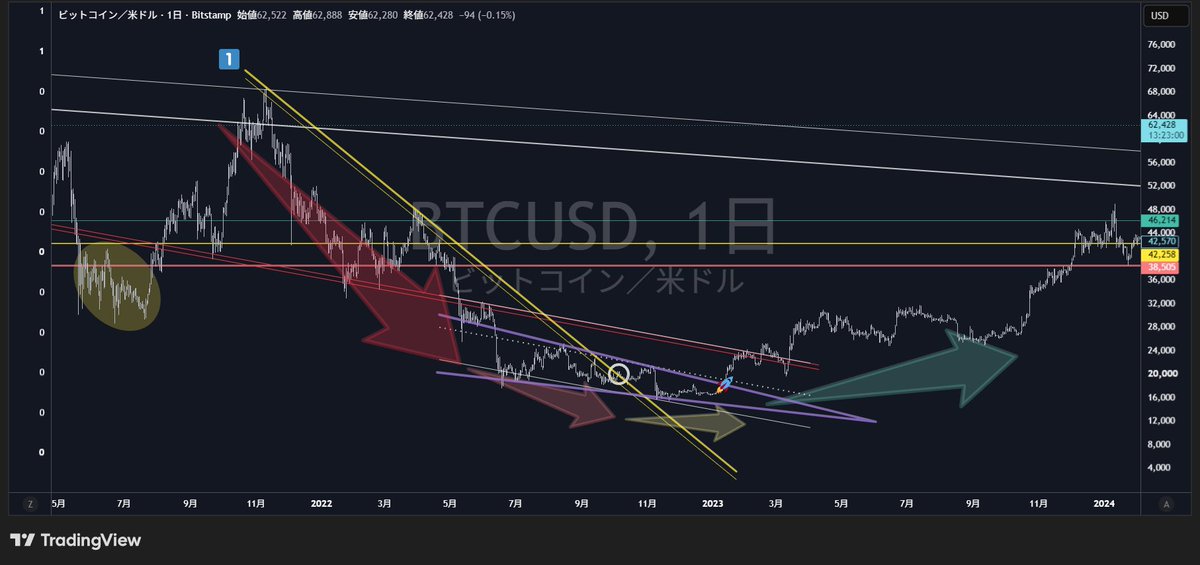
Please look at the weekly chart
It is obvious at a glance how much greater returns the person who consistently executed “sell the rip” from the cycle top has obtained…
You must never go against the trend
#btc fx
Similarly to $BTC, unless $GOLD slip out sideways (or break above) the yellow resistance zone & escapes the area under downward pressure, current drop will likely continue
However, after $GOLD slip out sideways the yellow resistance zone , there is a possibility of a roll reversal back to the yellow trendline
#xauusd #gold
Dear supporters & followers
It’s obvious, but the number of impressions from you guys increases in proportion to the accuracy of my mkt analysis & predictions
Compared to before, my post impressions have increased quite a bit, huh~ Maybe I’ve managed to level up a little…
Thx always for your support🙏
I’ll keep working hard & improving🤘
I knew from the very beginning that you guys would think ‘there’s no way it’s going to drop sharply from here
But when I looked at the chart, it was crystal clear that this timing had a very high probability of forming a Lower High (LH)
Geopolitical risks, fundamentals, & on-chain influences on the mkt are all nothing more than post-hoc excuses
Informations from the chart is a only leading indicator, All the answers are in the chart…
#btc
IMO, traders who had noticed in advance the resistance zone indicated by the red trend line would not employ a 'buy the dip' strategy."
Please don't blame everything on Taco Trump...
#btc
All mkt movements can be explained through changes in trends
Mkt analysis should not be primarily based on incomprehensible indicators or data..
Trend dominate all mkt
#cocoa
Current unfilled CME Gaps price
△$116,990
△$97,965
△$95,655
△$84,105
△$79,210
△$75,170
△$71,735
▲$63,890 🆕7/8🆕
▽$53,695
▽$47,770
▽$39,700
▽$37,210
▽$35,365
▽$33,955
⚠️There is no guarantee that all gaps will be filled
#btc@CMEGroup
The downtrend momentum will gradually weaken, eventually leading to a trend reversal
While $BTC remains on the left side of the yellow descending trendline, downside risk will always be present — this point should be clearly recognized & kept in mind
There will be no bottoming formation until $BTC breaks decisively to the right side of the yellow descending trendline
This is a fundamental principle of the market...
The chart contains all the answers
#btc
According to a certain $BTC price prediction site, it will bottom out sometime after the new year, & the bottom price range at that time is quite close to what I had in mind...
#btc
If an emerald green vertical sign lights up in the background, that’s the signal that the market has bottomed out
Right now, this sign is lit on the weekly basis, but since $BTC is still moving on the left side of the yellow trend line, it’s invalid...
Without relying on on-chain, it is possible to identify the bottom with overwhelmingly accurate precision using only the information from the chart
Well, it’s possible to identify the bottom without relying on this kind of gimmick anyway lol
#btc