Netflix only gave Dana White one minute to roast Tom Brady and he was not having it. "You guys gave me 60 seconds? My name is Dana! Is that not trans enough for you liberal f*cks?" 😭
Stagflation
Inflation stays high
Energy prices stay elevated
Economic growth slows
Stock markets move sideways for years
That’s the likely environment we are transitioning into…
During stagflation, commodities and real assets outperform while traditional equities struggle.
The first rotation already started
Markets usually rotate in a sequence.
Typical order:
1-Energy (oil, gas)
2-Commodities (grains, metals)
3-Input producers (fertilizer, mining)
4-Infrastructure & shipping
5-Real assets
We are currently looking at stage 2/3
If grains break out fertilizer is the next trade, Then demand increases for nitrogen, potash and phosphate, as they are the 3 core fertilizer inputs.
Major global players
Nutrien
Mosaic Company
CF Industries
Yara International
These often move after grain prices rise.
Then Commodity infrastructure
shipping companies
pipelines
storage
Under stagflation, these tend to underperform:
Crypto
high-growth tech
unprofitable companies
consumer discretionary
long-duration assets
Because interest rates stay higher for longer, simple as that
The largest moves often happen in the smallest producers.
Examples:
fertilizer miners
uranium juniors
agriculture equipment
shipping companies
These can sometimes move 3–10× in commodity cycles.
Oil is up 34.5 percent in a week. Gold is up 2.3 percent. That divergence is the single most important signal in global markets right now and almost nobody is reading it correctly.
The consensus explanation is that dollar strength from oil driven inflation is capping gold. Energy costs denominated in dollars increase global dollar demand. Higher inflation delays Fed rate cuts. Gold rises on the war premium but falls on the rate repricing. Net result: modest gain while oil screams higher.
Mechanically correct. Strategically incomplete.
In every major oil shock driven by Middle Eastern conflict since 1973, gold’s response has followed a two phase pattern. Phase one: gold underperforms oil because the dollar strengthens on the same inflation that drives the oil surge. The correlation between oil and gold compresses from its crisis average of 0.6 to something lower. In the current war the correlation has run at roughly 0.4 since February 28.
Phase two arrives when the market realizes the disruption is structural rather than transient. When the forward curve shifts from pricing a spike to pricing a plateau. When inflation is no longer a fear but a fact embedded in input costs and food prices. When central banks run out of room to hold rates steady against a supply shock they cannot fix with monetary tools. The dollar ceases to be a haven. The correlation snaps back. Gold reprices to match the structural reality that oil already priced.
In 1973, oil quadrupled between October and March. Gold rose six percent during the embargo itself. Then gold rose 73 percent over the following twelve months as the structural inflation embedded.
In 1990, oil doubled during the Kuwait invasion. Gold rose six percent during the crisis. Then gold held its gains while oil collapsed when the war ended in weeks.
The difference between 1973 and 1990 is duration. The embargo lasted months. The Gulf War lasted weeks. Gold’s phase two only detonates when the market accepts that the disruption is not transient.
Now apply the mechanism test. Hormuz is closed not by Iranian gunboats but by the withdrawal of commercial reinsurance. Reinsurance returns on actuarial timelines, not political ones. The DFC backstop covers six percent of the exposure gap. The ships have not moved. Futures are pricing 30 to 60 day resolution. The mechanism says months.
If the mechanism is right and the market is wrong about duration, gold is currently in phase one of a 1973 pattern, not a 1990 pattern. The 2.3 percent gain is not gold failing as a hedge. It is gold waiting for the market to catch up to the mechanism.
Goldman Sachs has a year end target of $6,300 set before the war. If the Hormuz closure persists beyond 90 days, that target is conservative.
The oil chart says the supply shock is real. The gold chart says the market believes it is temporary. One of them is wrong. The reinsurance mechanism says it is gold that has not yet priced reality.
The lag is the trade.
https://t.co/ULBgEzZ3A8
$BTC [Post Weekly Close Update]
BTC hasn’t just closed the week below its weekly 88K support – it’s also smashed through the key 80K level on the weekly, properly breaking structure to the downside and carrying on with the HTF downtrend.
Price is now rolling into that HTF support zone around 74K-ish, and we’re seeing it front-run the liquidity base, which can make it look like the bottom’s already in. But imho, we’re going to sweep that level properly – it’s coming, no two ways about it. The bounce we’re getting right now is textbook behaviour at these major HTF support points; we saw exactly the same thing off the 100K HTF S/R zone before that eventually gave way.
On the daily, our key SH is sitting at 90,596.2 – that’s the pivotal level now. A clean break above it would give us our first proper daily BOS. Until then, the bias stays firmly lower.
On the LTF/MTF, price isn’t really doing a great deal. One scenario I’m keeping an eye on is a bounce up into the 83K–84K region without taking out the 74K lows – that would set up a nice short entry targeting 72K at minimum. If that doesn’t materialise, we’re likely heading for a sweep of 74K down into the 67K–70K area, and then we can start looking at getting long and picking up a few spot plays.
Have a great trading week everyone :)
Quick crypto update
Order flow and Usdt.D
BTC structure bearish🧸
Price is currently consolidating below prior support, now acting as resistance around 88.5–90k (12HPHOB)
🟩Key Demand 85500-86250→ strong liquidity & buyers previously defended this zone
A clean 4H close below it would be structurally bearish and will lead to a first stop at 78k
Funding is positive (~0.0074)
This means:
Market is still long-heavy
Longs are paying shorts
In a downtrending / corrective market, positive funding is not bullish…
If price drops into support with positive funding → long liquidation cascade possible
OI is steadily decreasing
From ~30B → ~20.7B
This tells us: positions are being closed, not aggressively added
This is deleveraging, not accumulation…
Current move down = position unwinding, not panic yet
No sign of aggressive smart-money longs here
Very low liquidation activity
No major spikes → no capitulation yet
This suggests pain is not done
Real bottoms often come with large liquidation spikes
Not financial advice but Do NOT chase longs here, better shorts on weak bounce, or patience for demand reaction
Confirmation for longs:Liquidation spike
Funding reset
Strong bullish 4H close from demand
USDT.D
Still on trend support, with bullish market structure.
The 0382 has been respected, telling us that market makers are willing to push that chart higher at the moment.
Strong resistance at the 1D Supply where I still expect some reaction and potential reversal/relief on the market.
Patience.
🧠 Biggest Reasons “Money Taur” Followers Fail (Even With a Great System)
Here’s the hard truth — most don’t fail because of markets...
They fail because of mindset loops that sabotage every good setup.
5 core mistakes I keep seeing:
1️⃣ Always Contrarian.
You fight trends instead of flowing with them.
You trade “sentiment” instead of structure.
You chase “hero trades” for clout, not consistent profit.
Publicity > profits = guaranteed burnout.
2️⃣ Always Decoding.
Complexity bias.
You think watching more factors = more control.
You drown in confluences and miss clean entries.
You don’t need to “decode” the matrix — just trade what the chart shows.
3️⃣ Always Mocking the Herd.
You fear being “exit liquidity,” so you never pull the trigger.
Every trade becomes a battle with shame and self-doubt.
Your judgments of others turn into self-paralysis.
You can’t grow if you’re trading from fear of looking stupid.
4️⃣ Always Expecting Evil.
This one runs deep.
It’s the residue of being rekt before — by bad calls, fake mentors, or shady projects.
You built a wall around your trust, thinking it keeps you safe…
but it also blocks opportunity, mentorship, and community.
You start believing every red candle is manipulation, every loss is someone’s fault.
Yes, do your due diligence — but not everything is a trap.
Markets test you, not target you.
At some point, you must drop the armour and engage with life again.
Because success is a shared sport — you rise faster when you invest in people, not just positions.
The market rewards those who can stay sharp and stay open.
5️⃣ Always Idolising Others.
You can respect mentors, but don’t worship them.
You’re meant to stand on their shoulders, not hide in their shadows.
Stop copy-trading confidence — build it.
Mastery > mimicry.
Asking questions > pretending to understand.
If you want to be consistently profitable, your #1 priority isn’t a new indicator — it’s trusting yourself.
Every trade should come from your own conviction, not borrowed belief.
When you respect your own analysis, even your losses become lessons — not proof that you “can’t do it.”
Until you build confidence, trust, and self-respect, you’ll always outsource your success to someone else.
And no one — no mentor, no signal, no strategy — can give you that.
True financial freedom starts when you stop seeking permission and start acting from inner authority.
👁️ In short:
• Most fail not from lack of knowledge — but from lack of self-trust.
• Your chart won’t save you if your mindset keeps sabotaging every click.
• The biggest manipulation you face is not market makers but your own self.
Pay attention because this example is highly educational and completes this post.
As I was mentioning, when you start looking beyond the surface of supply and demand zones, what truly separates a fleeting reaction from a sustainable move is the quality of absorption taking place inside the zone.
On the $ALGO chart I shared, you can see how price pushed deeply into the discount area, hovered there, and then began climbing.
This is the type of behavior that tells a different story compared to a quick spike and rejection.
Absorption is essentially the invisible tug-of-war between aggressive orders (market participants trying to push price through the zone) and passive resting liquidity (limit orders waiting to be filled inside the zone).
For instance, in the demand zone highlighted, notice how the market dipped into the blue area and stayed there rather than instantly bouncing out.
This behavior suggests that significant buy-side interest was resting in that region, patiently filling orders while sellers were throwing volume at the bid.
On a footprint, you would expect to see imbalances with sellers hitting hard but absorption capping the downside.
This is what builds the foundation for a more sustainable rally, because it means large participants have positioned themselves without tipping the market prematurely.
The quality of absorption can be judged by how much volume the zone manages to handle without breaking.
If you see repeated stacked imbalances where aggressive orders are being absorbed, followed by delta stabilizing or even flipping, it indicates that the passive side is winning.
The longer this process continues, the stronger the base becomes.
When price finally leaves such a zone, it does so with conviction, because a genuine shift in positioning has occurred beneath the surface.
By contrast, if price simply tags the edge of a zone and springs away immediately, the footprint usually shows a thinner interaction: only a small set of resting orders being triggered, not a deep exchange.
That kind of reaction lacks staying power, which is why markets often revisit those areas and eventually consume them.
Sustainable demand or supply zones are not created by dramatic wicks alone: they are born from absorption, from volume doing its job quietly while the chart consolidates.
This is why “time spent” inside a zone is not dead time but it is evidence of absorption at work.
Every print, every lot filled inside the zone contributes to a shift in order flow.
On the chart, you can see how the 0.2000–0.2050 region functioned not just as a place where buyers stepped in once, but as an area where they could steadily build positions.
The impulsive reaction that followed carried more weight because it wasn’t a "knee-jerk" bounce, it was the result of liquidity being patiently digested.
Understanding this nuance changes how you view supply and demand.
You stop chasing instant rejections and start appreciating the grind of order flow inside the zone.
The footprint doesn’t just confirm whether absorption happened; it allows you to grade its quality, showing whether the move that follows is likely a shallow reaction or the start of a meaningful shift, like in this case.
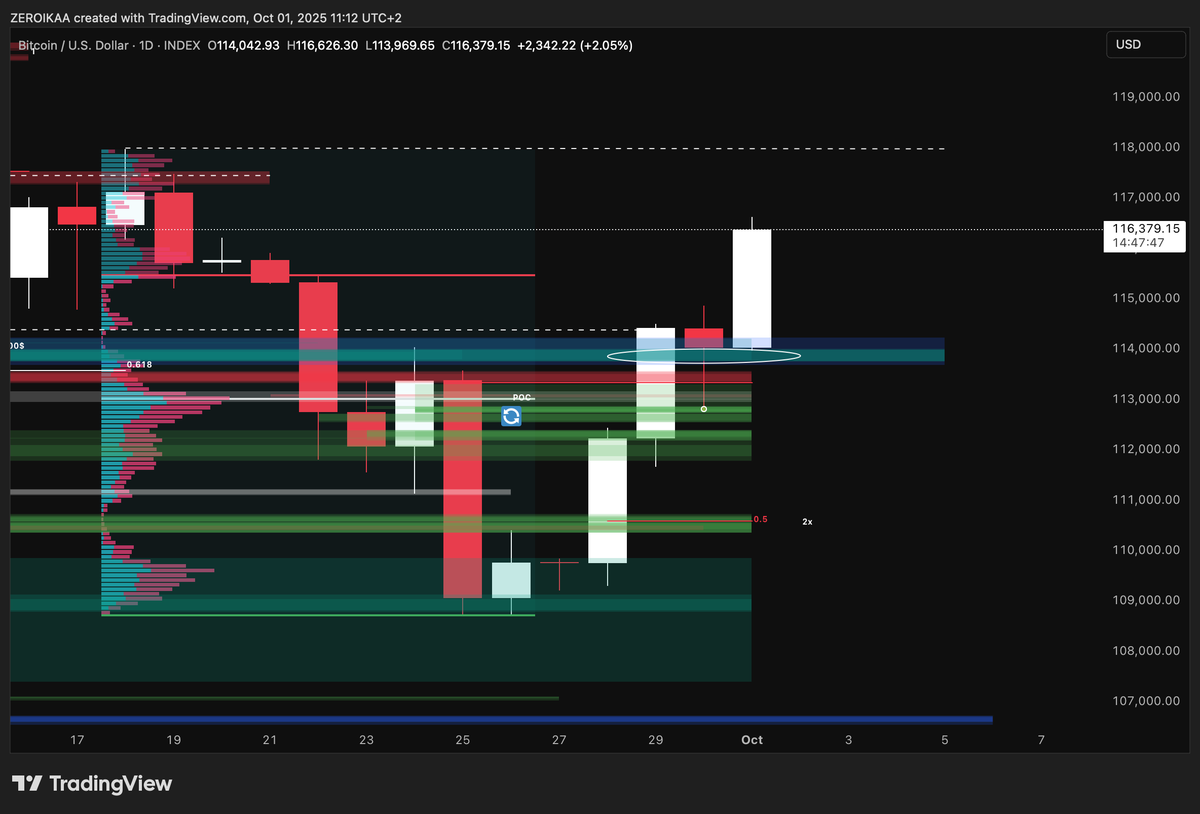
One of the most complicated things in the market is the ability to contextualize different pieces of information distilling them for developing a thesis, in this case a bullish one.
As highlighted in this post a few days ago, I was tracking a clean bearish Wolfe wave on the USDT D which would have caused a proportional bullish movement on BTC.
One necessary condition to have the confirmation of a Wolfe, together with the sub-waves, is the deviation above the trendline which clearly shows a liquidity grab. (and this often coincides with an institutional area, supply in this case).
In this example you saw how these things aren't just "patterns" but reflections of smart money actions.
Another confluence for not being bearish was the 1W closure on BTC that was able to sustain the 112.000$ key area, suggesting clean manipulation during the past daily sessions.
From there, based on my HTF bullish "bias", I monitored the recent supply formed at 112.600$, melted and utilized as a breaker to shot higher in confluence with the POC, and that's where I entered a long. (also watched at the order flow signaling stacked imbalances at the level)
Now it's crystal clear that we have some key areas on the USDT D, especially the 4.42% one, so I would be patient there monitoring a closure below it in order to potentially reach the EPA targeted at the beginning of this post.
However, at the moment, things look promising.
Hello guys.
During the last days I’ve been bombed with supportive and positive messages from people from the other side of the world, miles and kilometers away, telling me that I’m helping them to achieve financial freedom or even smaller personal goals, and I have to say, it truly makes me feel fulfilled.
Never in my wildest dreams, not even when I took my very first steps on this path, did I imagine being able to reach so many souls and have such a profound impact.
Back then, all I had was a strong will, a burning curiosity, and the desire to change my own circumstances.
What I didn’t know was that, along the way, I’d find myself helping others transform theirs too and honestly, there is no greater reward than knowing that what you love doing most can ripple out and spark change in people’s lives you may never meet in person.
Through all of this, I’ve always tried to remind myself of one simple truth: before being a good trader or analyst, I want to be a good human being.
That principle has guided me through everything: through the way I share my insights, the way I connect with you all, and the way I show up every single day.
Because at the end of the day, numbers, charts, and strategies mean nothing if you forget kindness, empathy, and authenticity.
So, to everyone who’s been walking this path with me, whether you’ve been here since the beginning or you’ve only just joined, I want to say thank you because these things
And if there’s one thing I want you to take from my story, it’s this: never underestimate where you can go if you lead with intention, with passion, and with heart.
You may think your dream is too far, too big, too unrealistic, but step by step, day by day, it becomes possible.
If I could grow into this, if I could create impact just by staying true to what I love, then so can you.
Hey, we're looking for a top tier meme artist for $Bucky ⏰⏰🚨🚨
The art needs to keep the same nostalgic internet vibe that Bucky already has — his “terrible MS paint art” style is intentional.
The character is simple:
Nonchalant face with very slight but key expressions: emotionless, slightly smirking, angry, etc.
What we want:
Someone super creative who can put Bucky in unique environments, settings, and angles.
Nostalgic crossovers: either Bucky visiting their world (DBZ, Naruto, Mario, Sonic, Gaming worlds etc.) where the environment is tuned to their art style — or them entering Bucky’s world/art style environment (like the picture I shared).
And crossovers with real life scenarios/people in Bucky's art style.
Not every piece has to be complex — some can just be simple white-background “wonky MS Paint” style sketches to keep that raw original vibe.
Consistency in his look/expressions is essential, but the environments and creative contexts should tap into the humour of the character to bring the most out of the vibes.
If you know anyone who can pull this off (or you are that person), DM me. Paid work.
We're also looking for video content with the above context ^^


![Trader_Vantage's tweet photo. $BTC [Post Weekly Close Update]
BTC hasn’t just closed the week below its weekly 88K support – it’s also smashed through the key 80K level on the weekly, properly breaking structure to the downside and carrying on with the HTF downtrend.
Price is now rolling into that HTF support zone around 74K-ish, and we’re seeing it front-run the liquidity base, which can make it look like the bottom’s already in. But imho, we’re going to sweep that level properly – it’s coming, no two ways about it. The bounce we’re getting right now is textbook behaviour at these major HTF support points; we saw exactly the same thing off the 100K HTF S/R zone before that eventually gave way.
On the daily, our key SH is sitting at 90,596.2 – that’s the pivotal level now. A clean break above it would give us our first proper daily BOS. Until then, the bias stays firmly lower.
On the LTF/MTF, price isn’t really doing a great deal. One scenario I’m keeping an eye on is a bounce up into the 83K–84K region without taking out the 74K lows – that would set up a nice short entry targeting 72K at minimum. If that doesn’t materialise, we’re likely heading for a sweep of 74K down into the 67K–70K area, and then we can start looking at getting long and picking up a few spot plays.
Have a great trading week everyone :)](https://pbs.twimg.com/media/HANe7qqbIAAbadr.jpg)


![Trader_Vantage's tweet photo. $BTC [Post Weekly Close Update]
BTC hasn’t just closed the week below its weekly 88K support – it’s also smashed through the key 80K level on the weekly, properly breaking structure to the downside and carrying on with the HTF downtrend.
Price is now rolling into that HTF support zone around 74K-ish, and we’re seeing it front-run the liquidity base, which can make it look like the bottom’s already in. But imho, we’re going to sweep that level properly – it’s coming, no two ways about it. The bounce we’re getting right now is textbook behaviour at these major HTF support points; we saw exactly the same thing off the 100K HTF S/R zone before that eventually gave way.
On the daily, our key SH is sitting at 90,596.2 – that’s the pivotal level now. A clean break above it would give us our first proper daily BOS. Until then, the bias stays firmly lower.
On the LTF/MTF, price isn’t really doing a great deal. One scenario I’m keeping an eye on is a bounce up into the 83K–84K region without taking out the 74K lows – that would set up a nice short entry targeting 72K at minimum. If that doesn’t materialise, we’re likely heading for a sweep of 74K down into the 67K–70K area, and then we can start looking at getting long and picking up a few spot plays.
Have a great trading week everyone :)](https://pbs.twimg.com/media/HANpWd2asAEH4I1.jpg)