Displayr turns your survey data into analysis, reports, and answers - with every number traced back to the tables, tests, weights, variables, and source so you
Register: https://t.co/ZC8oTrNwLB
What should you actually hand over to AI? Tim Bock will show where AI can save time in analysis, where it can go wrong, and how to build a smarter workflow around it.
The goal: hand over the right half.
New: export from Displayr straight to Google Slides.
Charts stay editable and linked to the data. Tables stay editable too.
Data changed? Export again and the same deck updates.
See how it works:
https://t.co/bgxLoHEGyH
#Displayr#GoogleSlides
You can now run Displayr Chat on your company's approved AI provider, including OpenAI, Claude and Gemini. More choice, more control, with the same trusted, verifiable analysis.
Learn more: https://t.co/gjqvuUJcB1
Build a custom US state tile map just by prompting Displayr's AI.
Add a margin-of-error control, edit it and reuse it. No coding needed.
Try it yourself (prompt included): https://t.co/b5QLpLdPxN
Displayr in MRWeb this week → https://t.co/qhsi8rXZg5
Describe the chart you want, have Displayr build it, then reuse it with new data, filters, weights and rules.
Thanks to MRWeb for the coverage.
#MRX#DataViz#Displayr
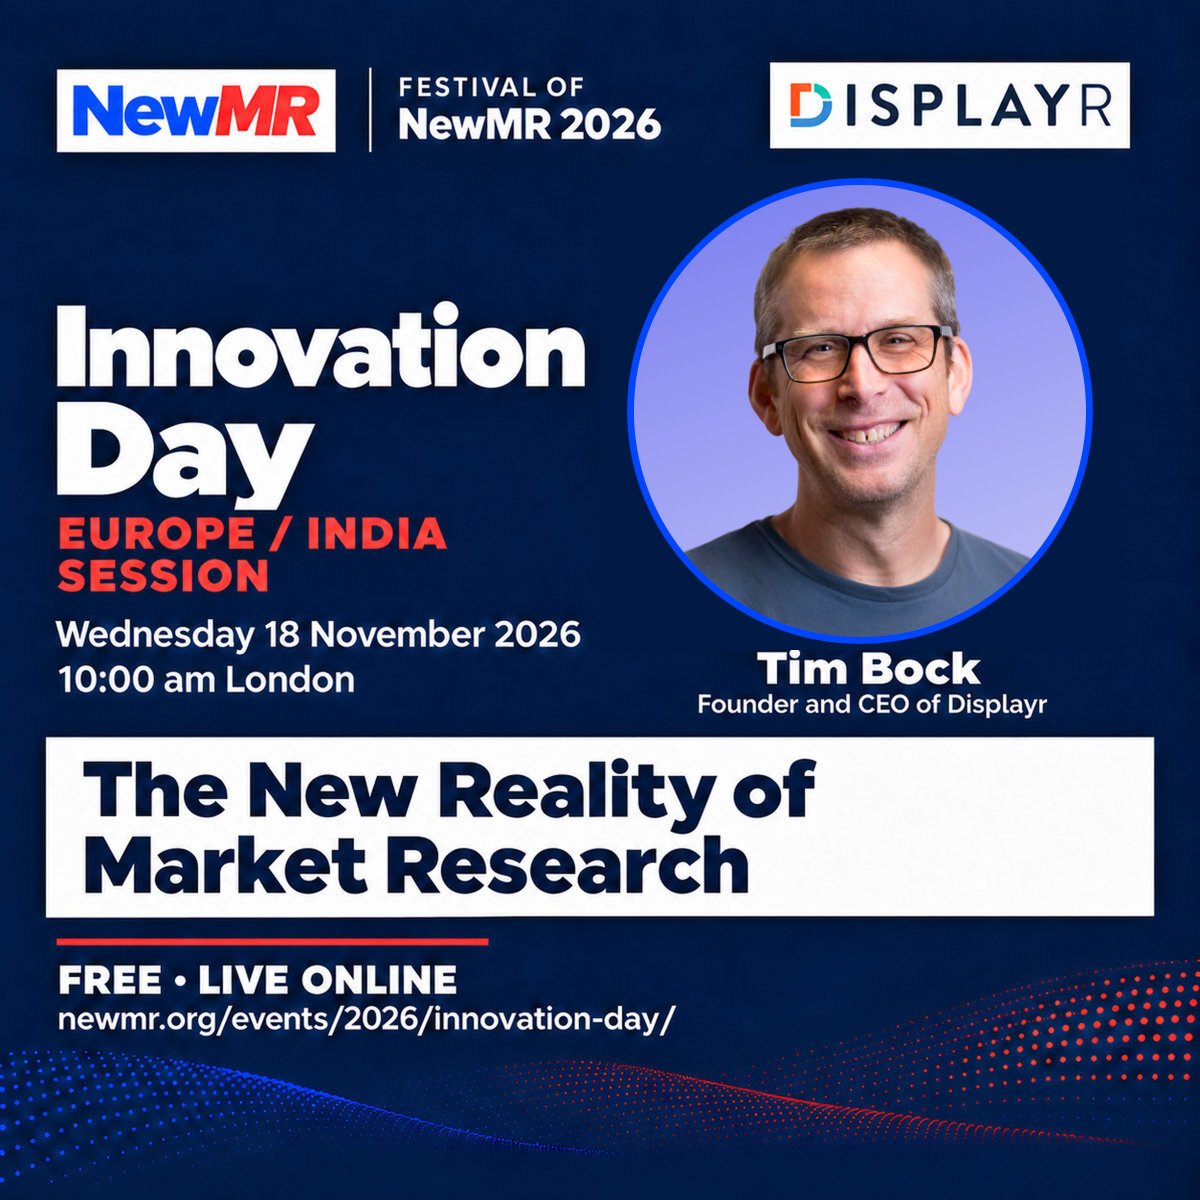
When anyone can create a convincing-looking analysis in minutes, what makes professional research valuable?
Tim Bock tackles that question at NewMR Innovation Day next week.
Free + live online, Nov 18:
https://t.co/4LJ4BWqyKX
#NewMR#MRX#Displayr
You need a chart that isn't in any menu. Now you describe it and Displayr's AI builds it.
Reusable. Customizable. Linked to your data. Trustworthy.
Book a demo: https://t.co/k9ItPaSBmK #MRX
Still rebuilding the same chart for every new wave or dataset? This webinar is for you: https://t.co/qHxMgZ90eM
Join Displayr CEO Tim Bock on November 5 to see how AI can help you build the chart you want once, then reuse it on new data.
Find out where you stand with AI: https://t.co/Bf3iwlq94s
Using AI for summaries or the odd task is one thing. Building it into the way research actually gets done is another.
Take the 2-minute quiz to see where you sit on the AI curve and what to focus on next.
Ask your report what you need to know.
Report Chat lets you ask follow-up questions and get answers grounded in the underlying analysis, so you can explore beyond what made it onto the page.
https://t.co/0olOO0j0NM
Create, change and explain your analysis just by asking.
With Chat in Displayr, you can build tables, charts and analysis in plain English, directly in your document, with the work there for you to check and keep editing.
https://t.co/R72gIGA3UM
See how your survey analysis compares: https://t.co/MOlhTfQr9c
Two market researchers both say they’re “using AI” and mean different things. A few prompts here and there? Regular automation? Or AI built into the way survey analysis actually gets done?
Take the 2-minute quiz.
Find the story hiding in your survey data.
Give Displayr’s Research Agent your data and research questions. It investigates the results, builds the analysis and brings the key findings together in a report you can review and edit.
https://t.co/otM2WvPkWX
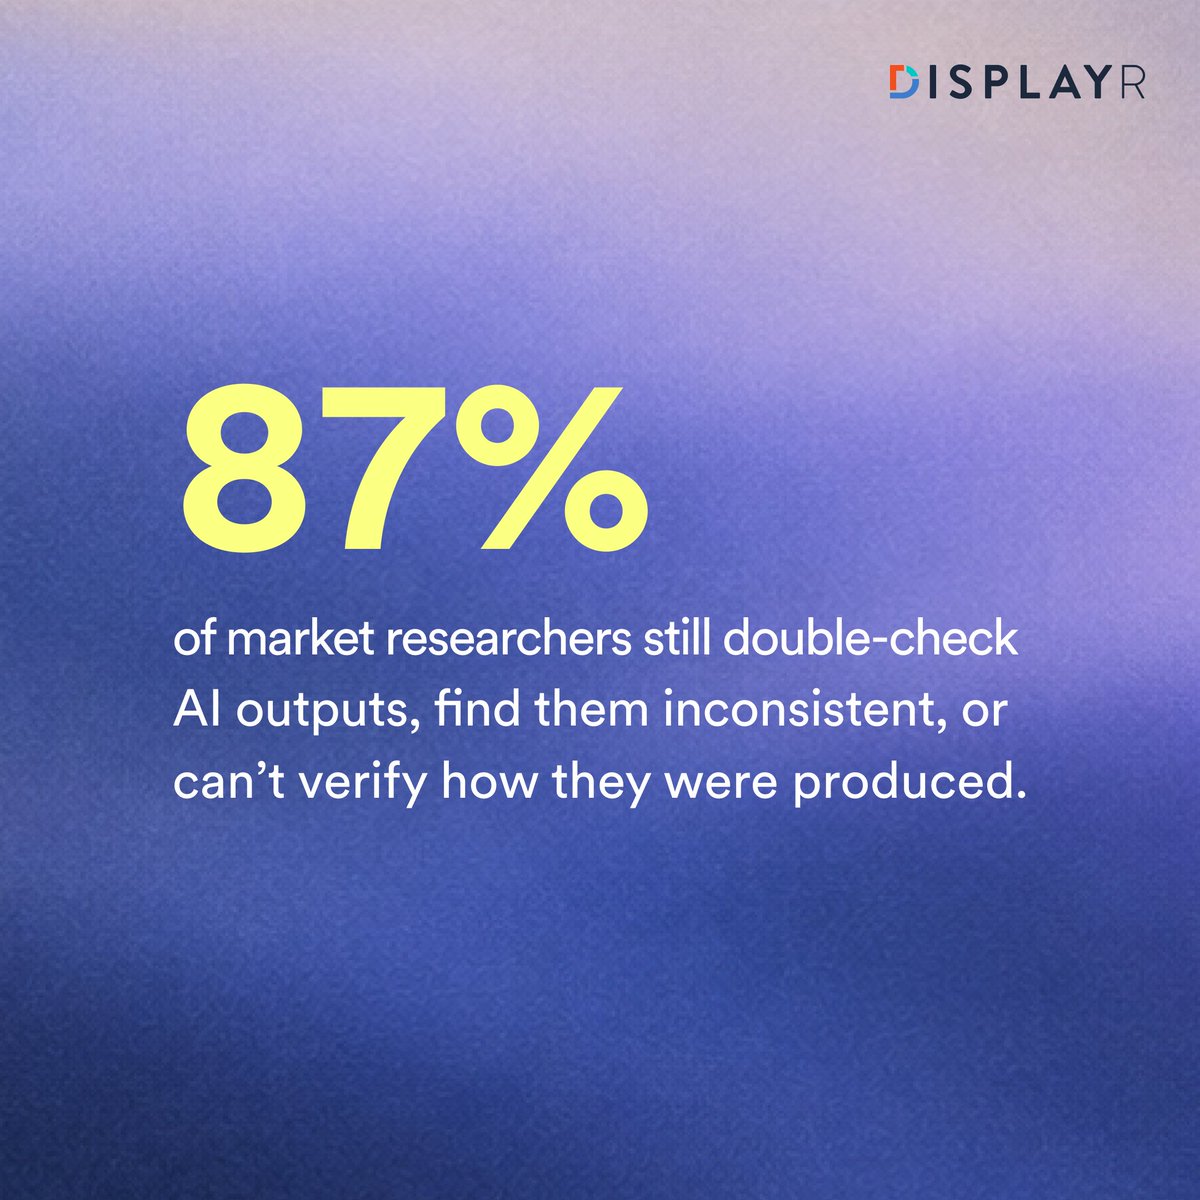
87% of market researchers still double-check AI outputs, find inconsistencies, or can’t verify how results were produced.
In Displayr, the maths is done by a stats engine built for survey analysis, with the work there to check.
Read more: https://t.co/tw0cndE8wf
Start with clean, analysis-ready survey data.
Displayr’s Data Preparation Agent checks and prepares your data automatically, then shows you exactly what changed so you can review it.
https://t.co/jCDo34ydbh (https://t.co/AViIkZJ9bA)
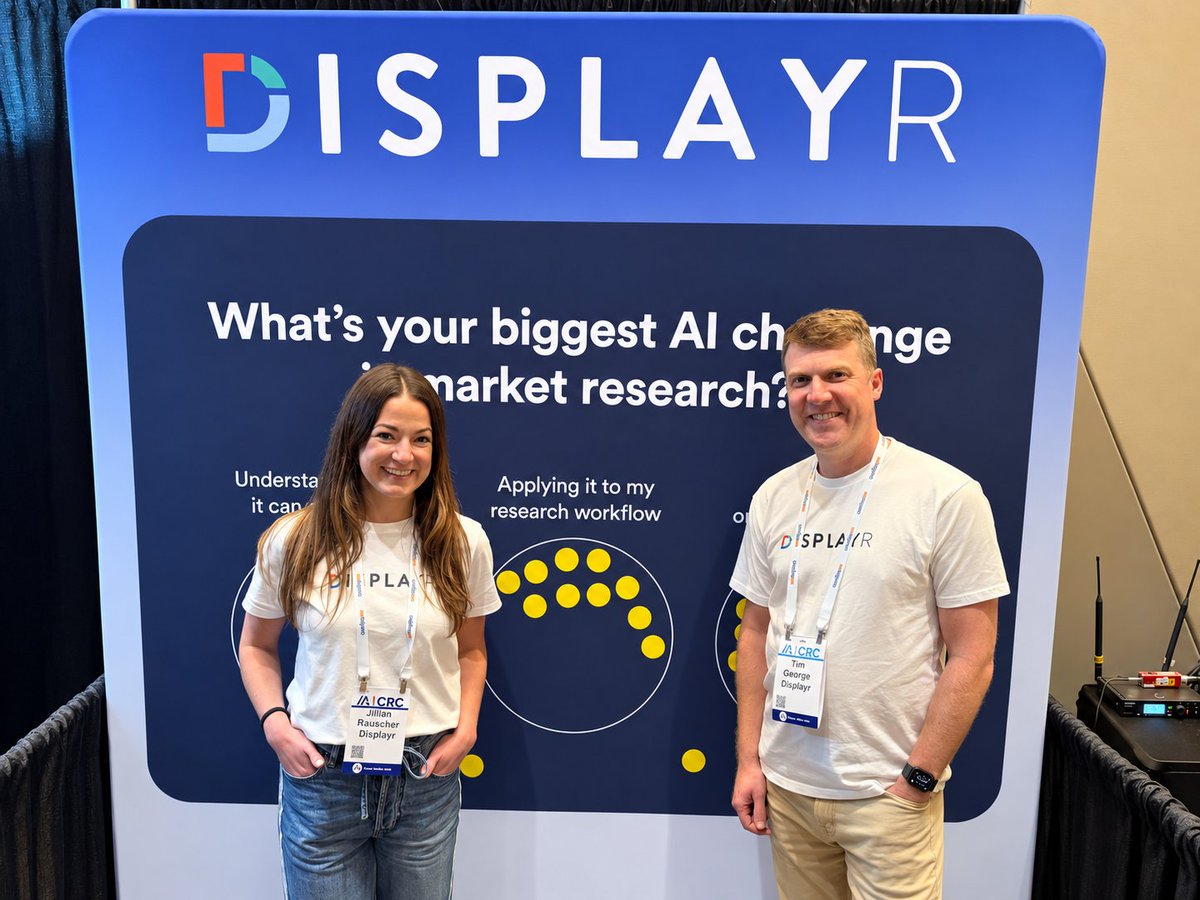
Two great days at CRC Chicago 🙌
Two challenges keep coming up: trusting AI outputs, and making AI work in the research workflow.
That’s where Displayr comes in: AI in survey analysis, with the analysis visible and checkable.
At CRC? Find Jillian + Tim at Booth 400. #IACRC2026
Heading to CRC Chicago? Bring us the survey analysis project that’s eating your week. Meet Jillian and Tim at Booth 400 to see how Displayr helps you prepare, analyze and report faster, with every result transparent and easy to check.
#CRC2026#Displayr
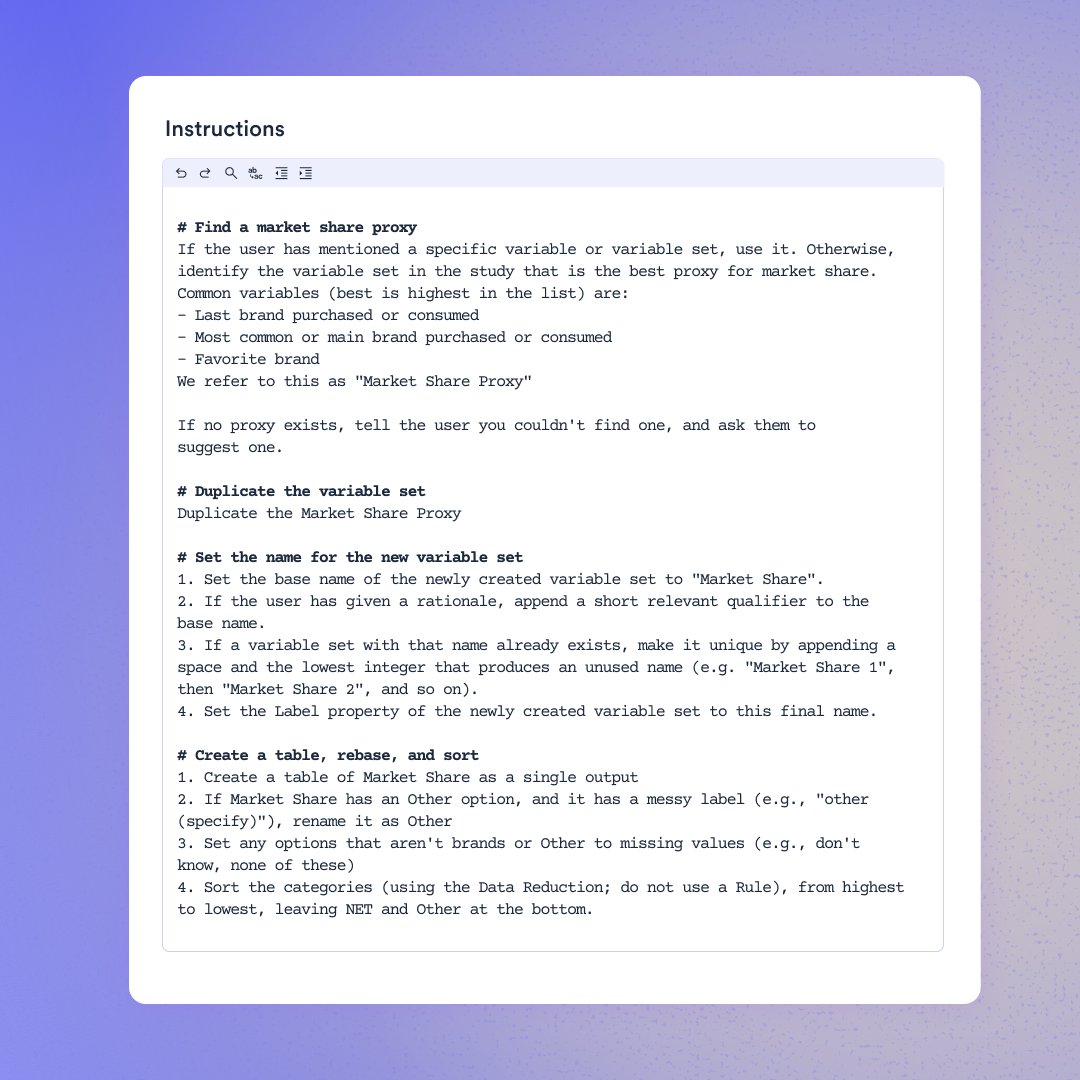
Most research teams have tasks they want done a particular way.
Skills in Displayr let you save that approach and reuse it when the task comes up again.
See how it works with our Market Share Skill example:
https://t.co/B6xJiSRS5y