cha-ching! 💸 Just locked in $4,706.32 in dividends this week from the early retirement/brokerage portfolio.
The cash is sitting tight for now. Waiting patiently to redeploy and scoop up more shares the next time the market goes on sale. 🛒📉
How’s your cash flow looking this month?
#FIRE #FinancialIndependence #RetireEarly #DividendInvesting #PassiveIncome #StockMarket #WealthBuilding
Collected dividends today from $BTCI, $FEPI, $IWMI, $MLPI, $QQQI, $SPYI, $TDAX, and $TSYX 💰🔥
The cash flow engine never sleeps. Reinvesting every dollar back into the machine to compound that future freedom.
#FIRE#Income#PassiveIncome#Dividends
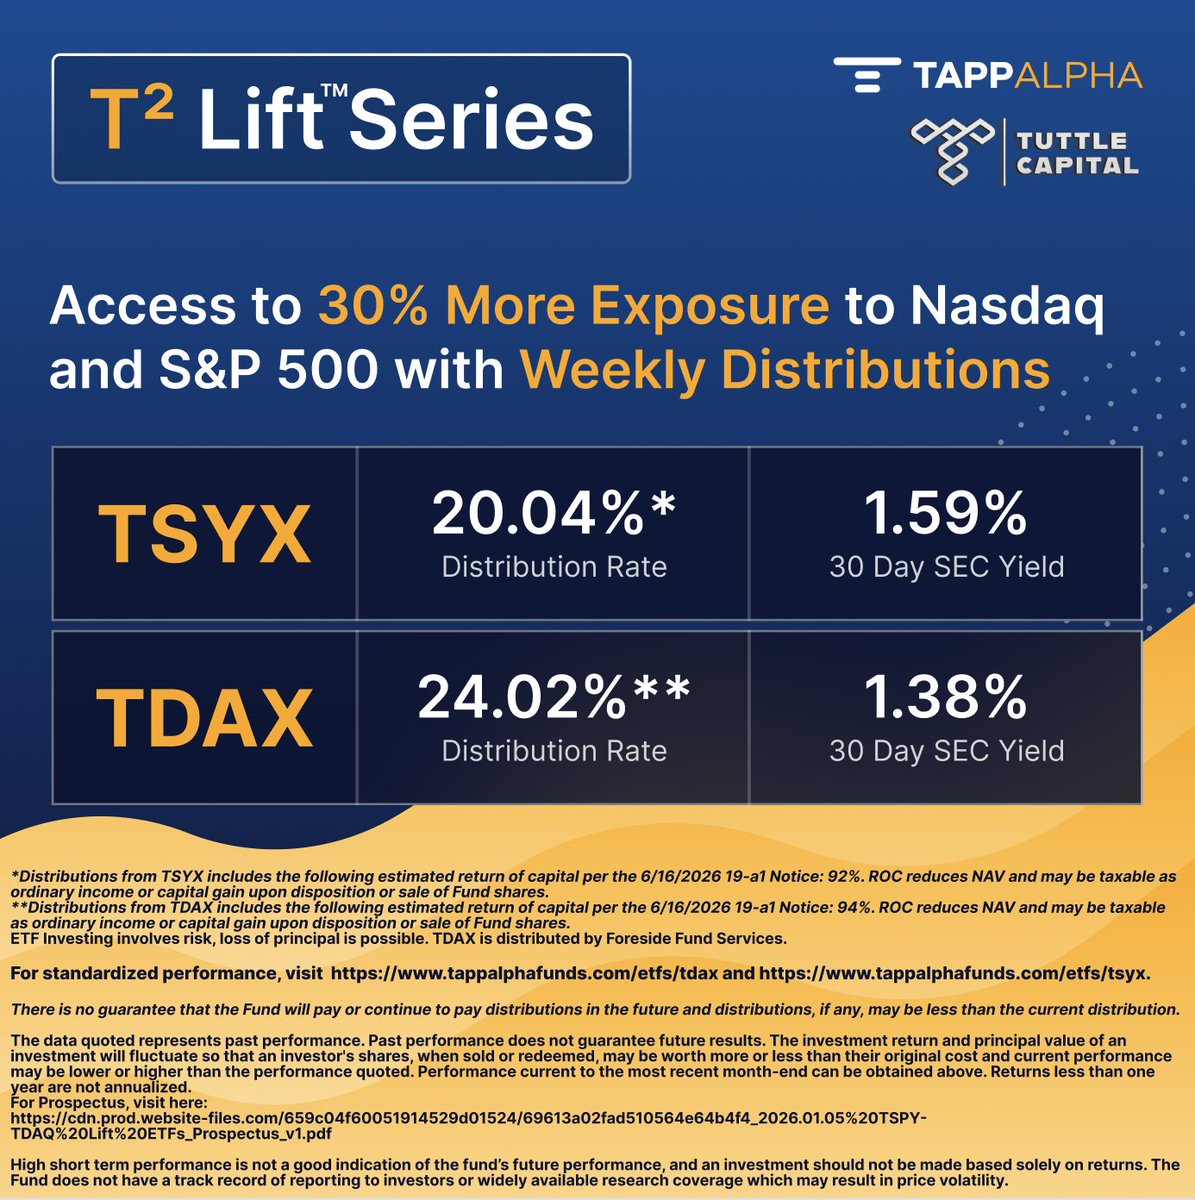
$TSYX & $TDAX announce 6/16 distributions ✔️
The T² Lift™ Series Powered by TappAlpha + Tuttle Capital
More income. More growth. Same strategy — Lifted.
The T² Lift™ Series offers light-leverage versions of TSPY and TDAQ — built to deliver 30% more exposure to the growth and income strategies investors already trust.
Learn more here: https://t.co/jBdEtsuJkw
TSYX
Distribution Amount: $0.08978 per share
Distribution Rate (as of 6/17/26): 20.04%
30-day SEC Yield (as of 5/29/26): 1.59%
TDAX
Distribution Amount: $0.11638 per share
Distribution Rate (as of 6/17/26): 24.02%
30-day SEC Yield (as of 5/29/26): 1.38%
Ex-Date - Wednesday, 6/17/2026
Payable Date - Thursday, 6/18/2026
The return of capital for TSYX’s most recent distribution was estimated to be 92%.
The return of capital for TDAX’s most recent distribution was estimated to be 94%.
ROC reduces NAV and may be taxable as ordinary income or capital gain upon disposition or sale of Fund shares.
#TSYX #TDAX @TappAlphaFunds@TuttleCap
Disclosures:
For prospectus, click here: https://t.co/zNC9xrOB9b
For standardized performance, visit:
https://t.co/gPwex6gusv
https://t.co/28Te61hhIn
The data quoted represents past performance. Past performance does not guarantee future results. The investment return and principal value of an investment will fluctuate so that an investor’s shares, when sold or redeemed, may be worth more or less than their original cost and current performance may be lower or higher than the performance quoted. Performance current to the most recent month-end can be obtained above. Returns less than one year are not annualized.
June 2026 Monthly Distribution Information for the NEOS High Income ETF Suite
Important Disclosures:
This material must be preceded or accompanied by a prospectus. To view the prospectus for each ETF, visit: https://t.co/HNR52pWYyV
ETF Fund Pages with Standardized Performance:
https://t.co/arKaU7anNg
https://t.co/xBRqCSMATZ
https://t.co/F7dMpmbVCa
https://t.co/7IzScNQwwr
https://t.co/dRJaPHVVS8
https://t.co/YBJha5TP5E
https://t.co/7bvIk1CRkH
https://t.co/oC0LST5Ydl
https://t.co/YOnRuAFaM2
Distributions made by the Funds have been classified as a return of capital and may be comprised of option premiums, dividends, capital gains, and interest payments. Please see the 19a-1 notices for an estimated breakdown of monthly distributions on each Fund's page. Distributions are not guaranteed.
*The Advisor has contractually agreed to keep the net expenses of IWMI from exceeding 0.68% of the Fund's average daily net assets through September 30, 2026 and the net expenses of NIHI from exceeding 0.68% of the Fund's average daily net assets through September 10, 2026 subject to approval of the agreement by the Board. Without the fee waiver IWMI’s expenses would be 0.76% and NIHI’s expenses would be 0.75%. BTCI’s total annual fund operating expenses are 0.99%.
**30-day SEC Yield is calculation based on a formula mandated by the Securities and Exchange Commission (SEC) that calculates a fund's hypothetical annualized income, as a percentage of its assets. A security's income, for the purposes of this calculation, is based on the current market yield to maturity (in the case of bonds) or projected dividend yield (for stocks) of the fund's holdings over a trailing 30-day period. This hypothetical income will differ (at times, significantly) from the fund's actual experience; as a result, income distributions from the fund may be higher or lower than implied by the SEC yield. It is important to note that 30-Day SEC Yield does not include income received from option selling. The data reflects the most recent month-end (5/31/2026). The Unsubsidized 30-day SEC Yield represents what a fund’s 30-day SEC yield would be had no fee waiver been in place over the reporting period. IWMI = 0.46% and NIHI = 2.64%.
Distribution Rate: The annualized rate an investor would receive if the Fund’s most recent distribution remained constant. It reflects a single distribution, not the Fund’s total return, and is calculated by annualizing the most recent distribution (multiplying by 12) and dividing by the Fund’s most recent ex-date NAV.
Added a little $MLPI to the retire early account today—always love buying the dip! 📉🔥 Building that passive income stream brick by brick to make that early retirement dream a reality.
Compound interest, do your thing! 💸✨
#Investing#RetireEarly#FIRECommunity#MLPI#Stocks #PassiveIncome #FinancialFreedom #FIRE
Weekly Distribution News for $FEPI $AIPI & $CEPI Holders!
Payout Date: 6/18/26
Distribution for $FEPI
Amount: $0.2129
Distribution for $AIPI
Amount: $0.2495
Distribution for $CEPI
Amount: $0.2844
FEPI Prospectus: https://t.co/Q3b1OGwlB0
FEPI Fund Info and Standardized Performance: https://t.co/dX3CHx30PN
AIPI Prospectus: https://t.co/dE1gJCpOH8
AIPI Fund Info and Standardized Performance: https://t.co/Kf10iPZu8V
CEPI Prospectus: https://t.co/64WogEFqIE
CEPI Fund Info and Standardized Performance: https://t.co/3pm6F6E1z4
Distribution News for REX Growth & Income ETF Holders!
Pay date: 06/17/2026
REX NVDA Growth & Income ETF $NVII
Amount: $0.2707
REX TSLA Growth & Income ETF $TSII
Amount: $0.2316
REX WMT Growth & Income ETF $WMTI
Amount: $0.1054
*As of 6/15/26. The Distribution Rate is the annual yield an investor would receive if the most recently declared distribution, which includes option income, remained the same going forward. The Distribution Rate is calculated by multiplying an ETF's Distribution per Share by fifty-two (52), and dividing the resulting amount by the ETF's most recent NAV. The Distribution Rate represents a single distribution from the ETF and does not represent its total return.
**As of 5/31/26. The 30-Day SEC Yield represents net investment income, which excludes option income, earned by such ETF over the 30-Day period, expressed as an annual percentage rate based on such ETF's share price at the end of the 30-Day period.
***NVII, TSII, & WMTI's current distributions consist of estimated return of capital (ROC). For full details on the composition of distributions, please refer to the latest 19a-1 notices. The REX NVDA Growth & Income ETF, the REX TSLA Growth & Income ETF, and the REX WMT Growth & Income ETF have a gross expense ratio of 0.99%. There is no guarantee that the Funds will be successful in their attempt to provide leveraged exposure to the underlying stocks or pay weekly distributions.
The Funds are not suitable for all investors. These distribution rates caused by unusually favorable market conditions may not be sustainable. Such conditions may not continue to exist and there should be no expectation that this performance may be repeated in the future. The performance data quoted represents past performance. Past performance does not guarantee future results. The investment return their original cost and current performance may be lower or higher than the performance quoted. Performance current to the most recent month-end can be obtained by calling 1-844-802-4004. Short term performance, in particular, is not a good indication of the fund's future performance, and an investment should not be made based solely on returns.
Keep it simple: OVL and Chill.
The Overlay Shares Large Cap Equity ETF ($OVL) is a systematic approach to equity exposure with option overlays.
For standardized performance and a link to the prospectus, see this thread.
$TDAQ announces its June distribution ✔️
You’re already in the Nasdaq 100. Why not add a way to access its income potential...with TDAQ?
Stay tuned for more and get additional information here: https://t.co/7oYYAi5GFf.
Distribution Amount: $0.39547 per share
Distribution Rate (as of 6/16/26): 16.98%
30-day SEC Yield (as of 5/29/26): -0.24%
Ex-Date - Tuesday, 6/16/2026
Payable Date - Wednesday, 6/17/2026
The return of capital for this most recent distribution was estimated to be 100%. ROC reduces NAV and may be taxable as ordinary income or capital gain upon disposition or sale of Fund shares.
#Investing #CoveredCalls #Fintech #CboeListed
Disclosures:
For prospectus, click here: https://t.co/M1bjcAhCDz
For standardized performance, visit https://t.co/7oYYAi5GFf
The data quoted represents past performance. Past performance does not guarantee future results. The investment return and principal value of an investment will fluctuate so that an investor’s shares, when sold or redeemed, may be worth more or less than their original cost and current performance may be lower or higher than the performance quoted. Performance current to the most recent month-end can be obtained above. Returns less than one year are not annualized.
Another Wednesday. Another payout.
Our Growth & Income Suite offers access to ETFs with the potential for income on a weekly distribution schedule.
Annualized Distribution Rates:
$NVII – 54.28%
30-Day SEC Yield: 3.81%
Return of Capital (ROC): 97.50%
$TSII – 67.08%
30-Day SEC Yield: 3.46%
Return of Capital (ROC): 97.80%
$WMTI – 22.70%
30-Day SEC Yield: 3.09%
Return of Capital (ROC): 94.10%
View each fund’s prospectus here:
NVII & TSII Prospectus:
https://t.co/DxdJDBADqK
WMTI Prospectus:
https://t.co/t92ViUJE6R
NVII Fund Info and Standardized Performance: https://t.co/k3KDL8T1ql
TSII Fund Info and Standardized Performance: https://t.co/RgB8ohIH0O
WMTI Fund Info and Standardized Performance: https://t.co/VNgvmC0Wxy
*As of 6/15/26. The Distribution Rate is the annual yield an investor would receive if the most recently declared distribution, which includes option income, remained the same going forward. The Distribution Rate is calculated by multiplying an ETF’s Distribution per Share by fifty-two (52), and dividing the resulting amount by the ETF’s most recent NAV. The Distribution Rate represents a single distribution from the ETF and does not represent its total return.
**As of 5/31/26. The 30-Day SEC Yield represents net investment income, which excludes option income, earned by such ETF over the 30-Day period, expressed as an annual percentage rate based on such ETF’s share price at the end of the 30-Day period.
NVII, TSII, MSII, COII, HOII, LLII, CWII, PLTI, & WMTI's current distributions consist of 100% estimated return of capital (ROC). For full details on the composition of distributions, please refer to the latest 19a-1 notices. The REX NVDA Growth & Income ETF, the REX TSLA Growth & Income ETF, the REX MSTR Growth & Income ETF, the REX COIN Growth & Income ETF, the REX HOOD Growth & Income ETF, the REX LLY Growth & Income ETF, the REX CRWV Growth & Income ETF, the REX PLTR Growth & Income ETF, and the REX WMT Growth & Income ETF have a gross expense ratio of 0.99%. There is no guarantee that the Funds will be successful in their attempt to provide leveraged exposure to the underlying stocks or pay weekly distributions.
The Funds are not suitable for all investors. These distribution rates caused by unusually favorable market conditions may not be sustainable. Such conditions may not continue to exist and there should be no expectation that this performance may be repeated in the future. The performance data quoted represents past performance. Past performance does not guarantee future results. The investment return their original cost and current performance may be lower or higher than the performance quoted. Performance current to the most recent month-end can be obtained by calling 1-844-802-4004. Short term performance, in particular, is not a good indication of the fund’s future performance, and an investment should not be made based solely on returns.