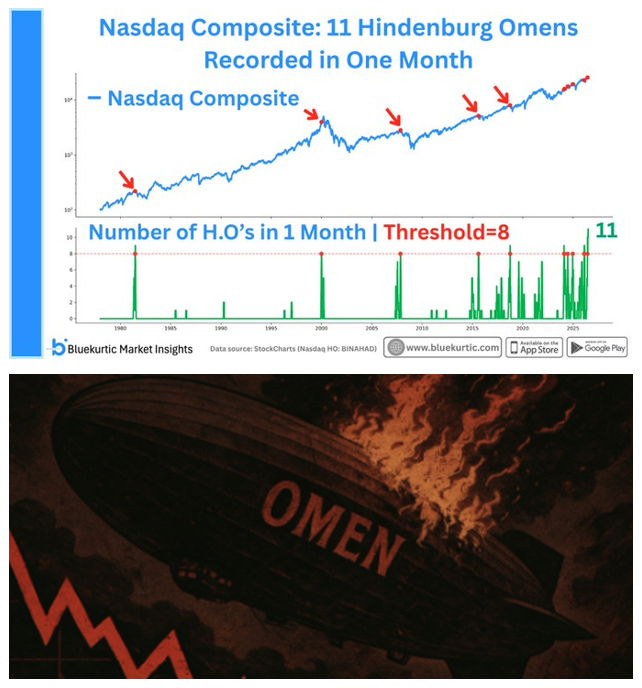
Stock Market Crash "Hindenburg Omen" Triggered 🚨
The Hindenburg Omen, an indicator that correctly detected the 1987 and 2008 stock market crashes, has been triggered 11 times over the last month for the Nasdaq, the most in history 🤯👀
The S&P put/call skew just collapsed to 0.71. Not a low. The lowest reading on record.
The 10-year average is 12. The 2020 panic peaked at 34. We're at 0.71.
What this measures: how much investors pay to protect against a crash versus betting on a rally. At 0.71, crash protection is essentially free. Nobody wants it.
Think about what that means. After two years of gains, at record concentration, with households at record equity exposure, the options market has priced hedging like insurance on a house that cannot burn.
History's lesson is consistent: markets don't crash when everyone fears a crash. Fear is the hedge. This chart says the hedge is gone.
Nobody buys insurance at the top.
That's what makes it the top?
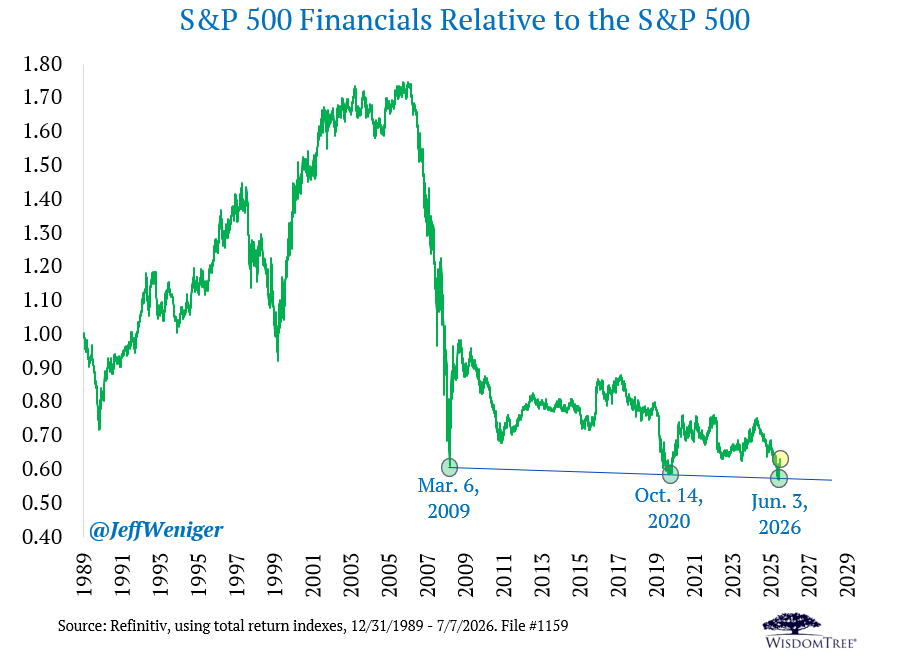
This is very promising action for Financials. Relative to the S&P 500, the Financials sector has bounced off the important support line from 3/6/2009 to 10/14/2020. This has been going on for 5 weeks.
Financials weight:
S&P 500 Value: 16.6%
S&P 500 Growth: 9.4%
S&P 500: 12.8%
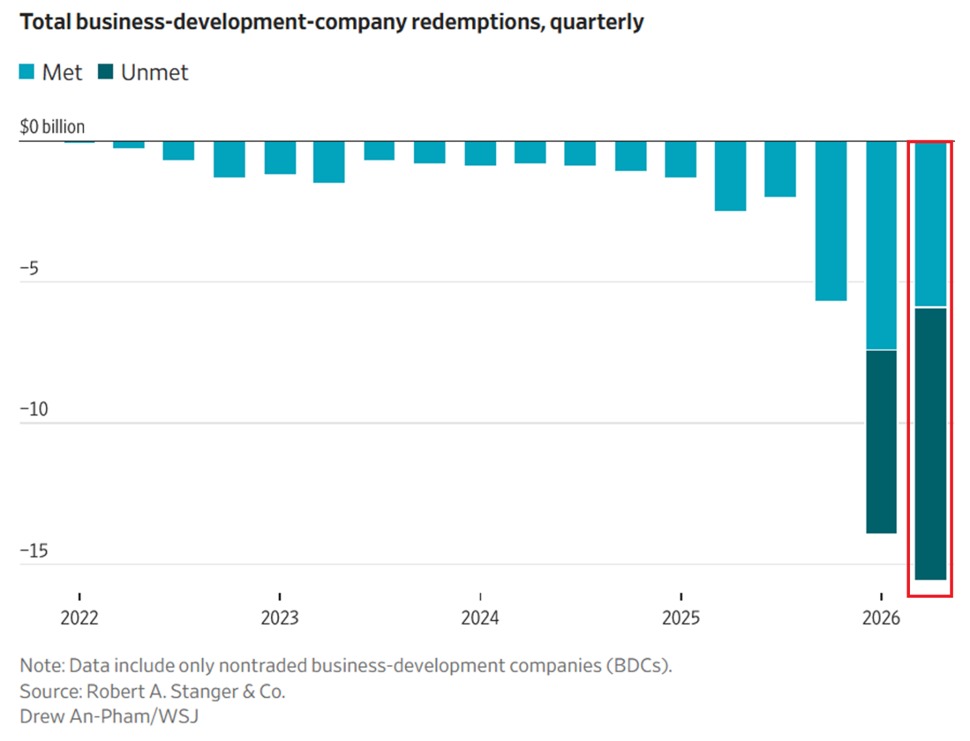
Stress in the US private credit market is intensifying:
Investors requested a record -$15.6 billion in redemptions from private credit funds in Q2 2026.
This marks the 3rd consecutive quarterly increase by a total of +$13 billion, or +500%.
Furthermore, just 38% of these requests were met, down from 53% in Q1 2026, leaving $9.7 billion in unmet redemptions, the largest backlog on record.
Blue Owl's flagship fund, Blue Owl Credit Income, was the most impacted at 19% of shares outstanding, with 14% unmet, the highest redemption rate among its large competitors.
This was followed by Apollo, at 16% requested with 11% unmet, and Ares, at 14% requested with 9% unmet.
Meanwhile, inflows into the private credit industry declined -75% since January to ~$500 million in May, the smallest monthly intake in at least 18 months.
The private credit crisis shows no signs of slowing.
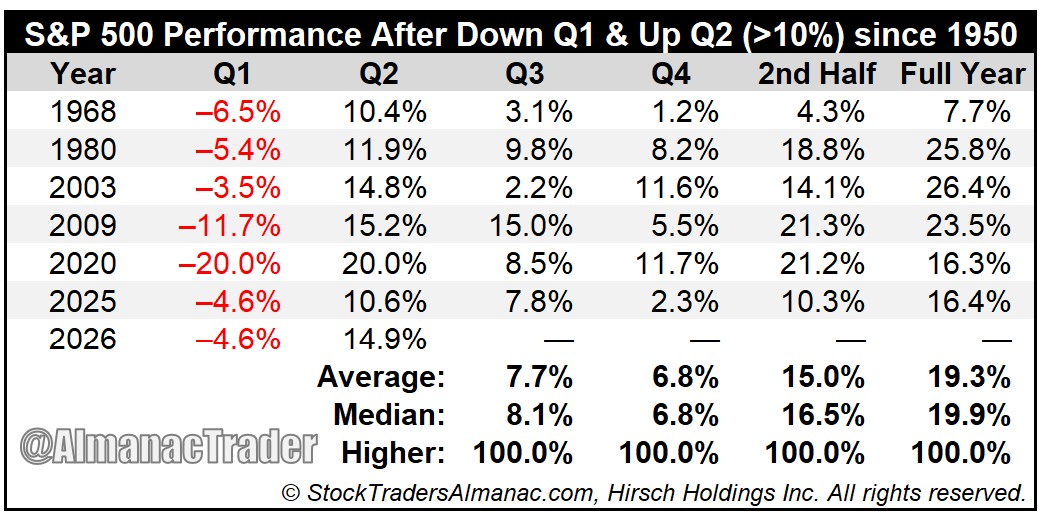
After a down Q1 and a 10%+ Q2, the S&P 500 is 6-for-6 the rest of the year since 1950.
6 prior years market finished higher in Q3, Q4, 2nd half, and full year.
Small sample, powerful setup. Doesn't rule out August/September pullback—but odds favor gains thru year-end.
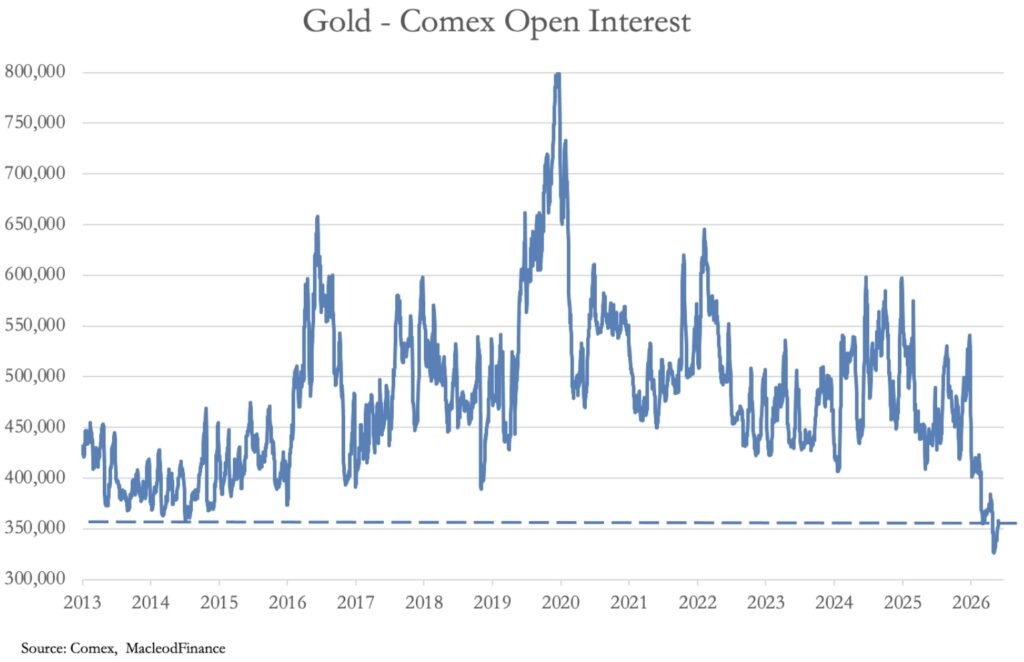
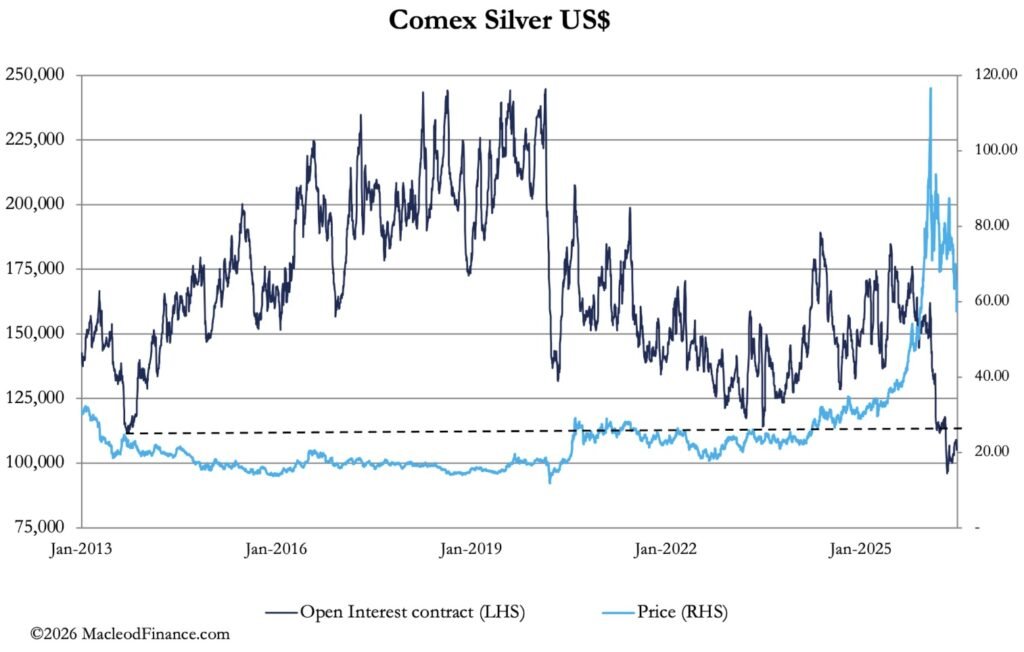
Gold open interest on COMEX is plunging to the lowest level in a decade… and silver open interest is doing the same.
At the same time, 448t of gold and ~6,000t of silver have left COMEX.
Paper exposure is collapsing while physical metal is leaving the exchange.
COMEX silver open interest is in free fall.
Open interest is now below the levels seen when silver bottomed in 2016 after a brutal 5-year decline.
Positioning has been washed out.
When gold resumes its uptrend, I expect silver to outperform once again.
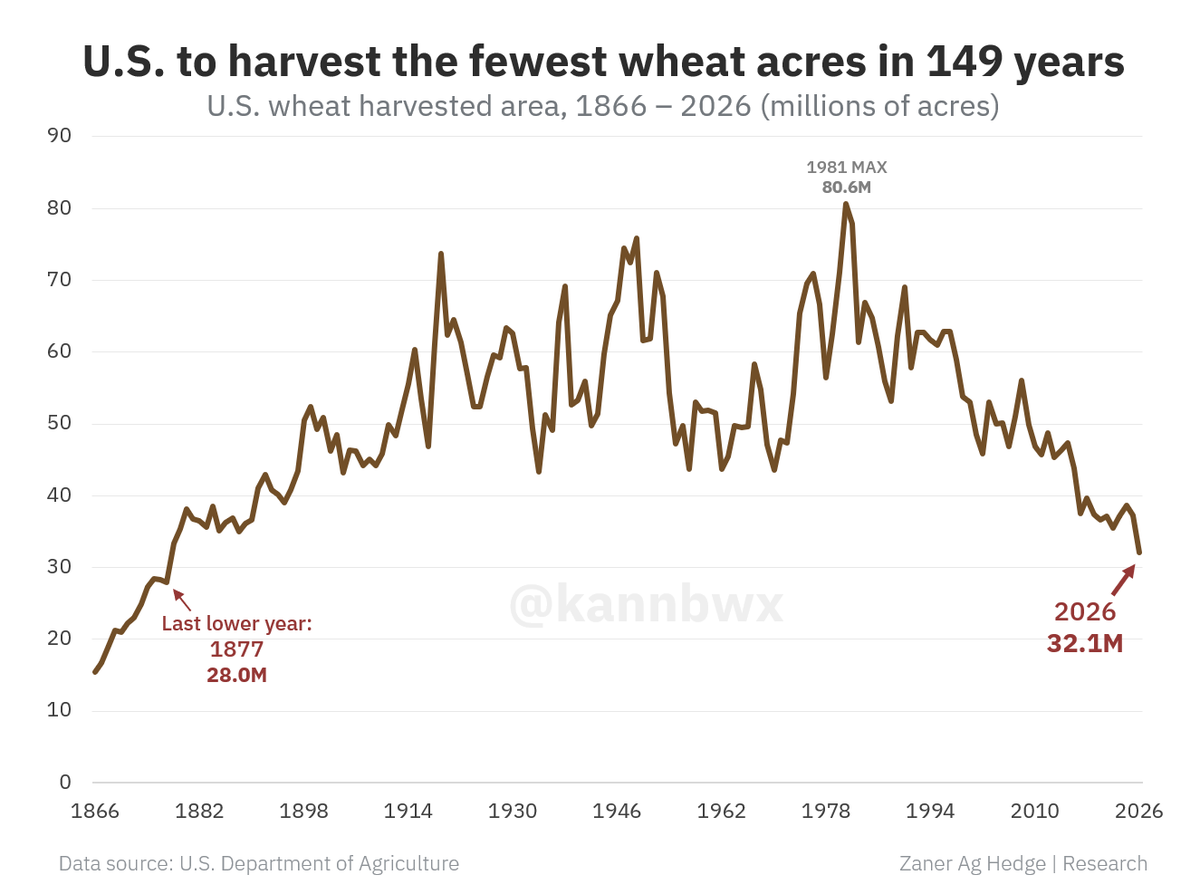
🌾USDA projects U.S. farmers will harvest just 32.1 million acres of wheat in 2026.
That would be a 149-year low, the smallest harvested area since 1877.
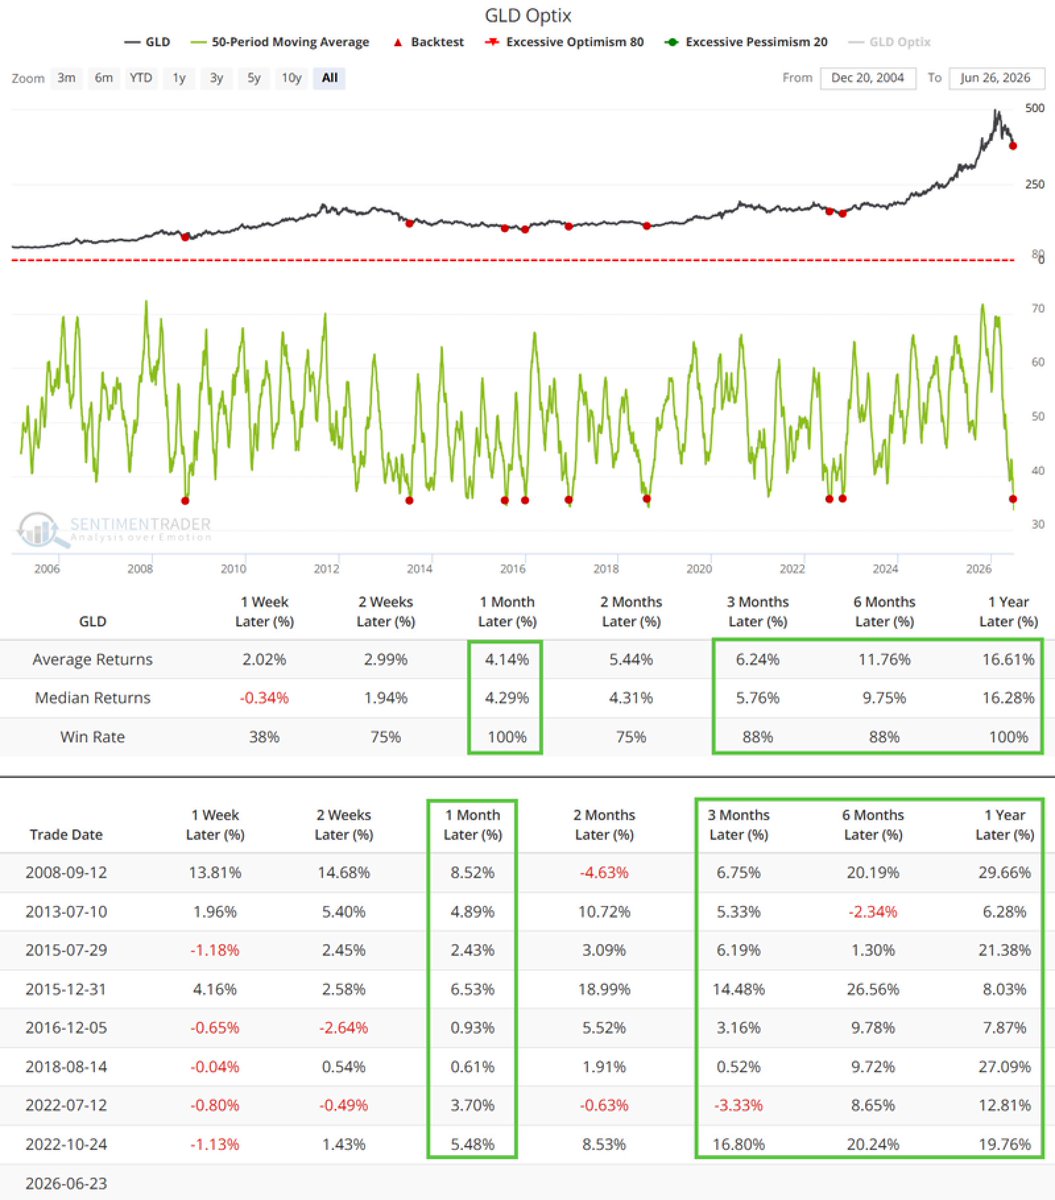
Gold traders got this gloomy after $GLD shed nearly 30%.
The last 8 times sentiment got this washed out since 2008, it was higher 1 month later. Every one of them.
A year out, same story.
Read full analysis: https://t.co/yKRjEsuvMu
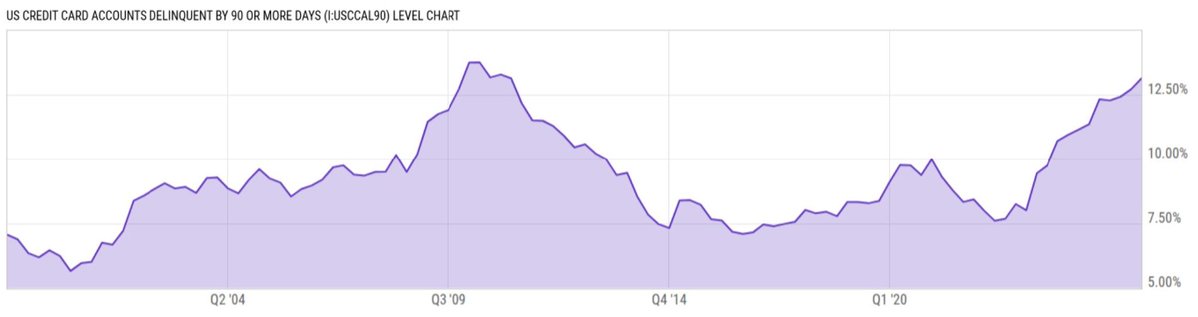
U.S. Credit Card Accounts delinquent by 90+ days have jumped to 13.1%, the highest level in 15 years and closing in on the highest level in history 🚨🚨🚨
China’s AI playbook: kill OpenAI and anthropic with free great models. Make it free. Then use cheap electricity to export compute as well. Currently the blocker is chip but Hauwei would catch up soon. Imagine a world where instead of paying hundreds of billions to OpenAI and anthropic, you pay almost zero to similar level of intelligence with cheap cheap inference. What’s gonna happen?
Relevant divergence between small caps IWM (candlestick in the chart) and High Yield / High Grade bond ratio (blue line).
In addition, RSI(14) is also presenting a bearish divergence, suggesting at least a short term pause/pullback.
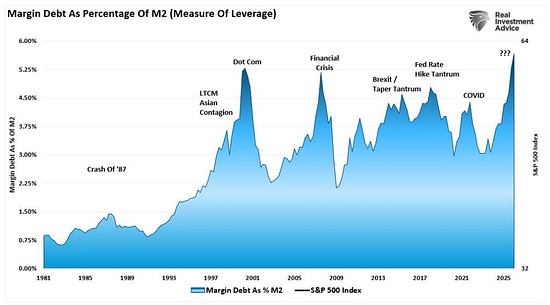
Margin debt as a percentage of M2 is at an all-time high.
Leverage feels awesome when stocks go up, but it's brutal when they go down.
Everyone's a genius on margin in a bull market.
This Indicator called the 3 major market peaks over the past 3 decades, and has just sounded the alarm once again.
Margin debt acceleration has reached warning levels.
As discussed in the Weekly ChartStorm: https://t.co/43IGrNHnwe
What's going on with $STRC? Let us explain:
$STRC is a product Michael Saylor's Strategy sells to raise cash. You pay $100 for a share, and they pay you back roughly 11.5% a year in cash. Think of it like a high-yield account, not a normal stock. They then use that cash to buy Bitcoin $BTC.
The deal only works if the price stays near $100. That's the promise: park your money here, collect the yield, and your $100 stays worth about $100.
Strategy keeps it near $100 using one lever: the dividend. If the price slips below $100, they raise the payout to attract buyers and lift it back up.
The reason Strategy cares so much? When $STRC sits at $100, Strategy can issue new shares and use the cash to buy more Bitcoin. That's a big part of how the whole machine is funded.
But below $100, the machine stalls. Every $STRC share carries a $100 obligation no matter what it sells for, so issuing at $90 means collecting $90 while still owing dividends on the full $100. They'd be taking on a dollar of obligation to raise ninety cents. So they stop issuing and wait for the price to climb back toward par.
And right now, that machine is breaking. $STRC hit a new low today at ~$82. Bitcoin has been weak, and Strategy's cash pile has dropped from $2.25B to around $1B .
Two problems hit at once: Below $100, Strategy stops selling new shares, so that funding source dries up. And the dividend still has to be paid in cash every couple of weeks no matter what. So they reached into the Bitcoin...
In late May, Saylor sold 32 BTC to cover obligations on $STRC. First bitcoin sale since 2022, and the first sign the system was being truly tested.
That sale is the spark... it told the market Strategy was tapping its bitcoin to make payments, confidence cracked, and buyers started demanding a higher yield to hold $STRC. The price slid, and the loop kicked in.
The loop summarized: Price drops, so they need a higher dividend payout to defend $100. A higher payout means more cash owed to investors. More cash owed means dipping into cash reserves or selling bitcoin. Selling bitcoin pushes its price down and erodes investor confidence in the entire structure. A lower bitcoin price pushes $STRC down again. The death spiral begins.
Each step makes the next one worse. That's why the market is watching $STRC so closely right now.
$MSTR $BTC
We could definitely be entering a new market paradigm shift.
The US 10Y yield is now trading above its 5-year MA for 52 consecutive months, the longest period in at least 4 decades.
A similar situation happened in the late 1960s, followed by a very difficult period of stagflation.
Is this time different? I have no idea. I hope A.I. can help solve this challenge; otherwise..