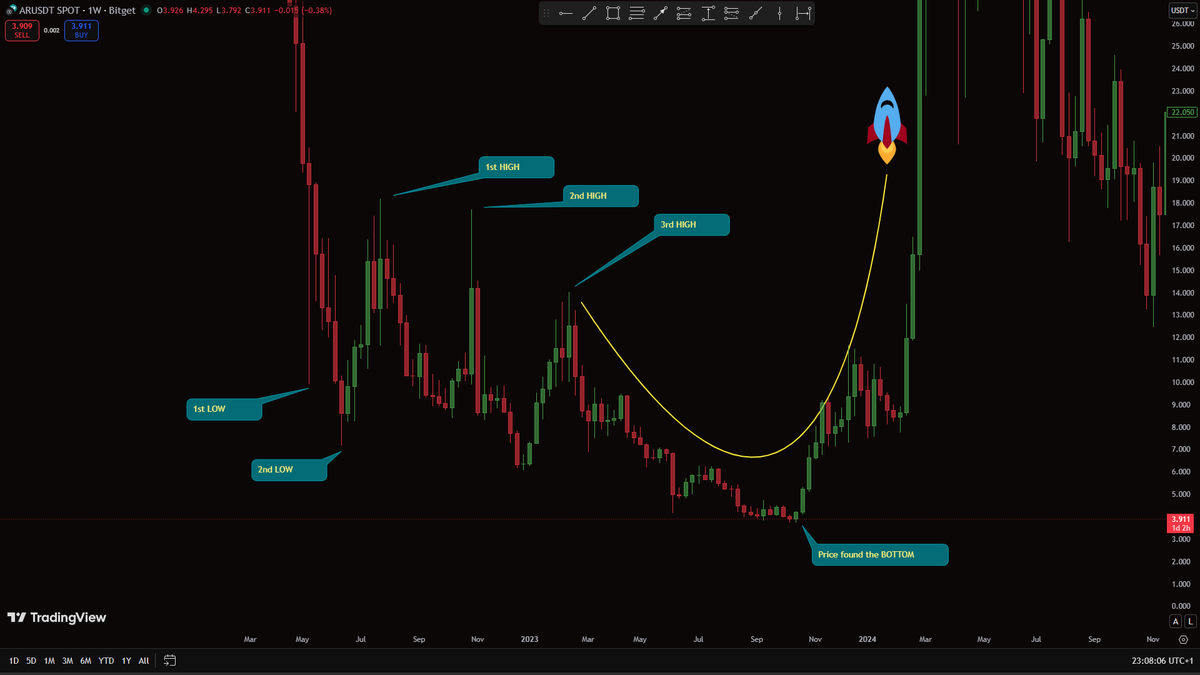
#NEAR 1st pick monthly chart where price swept liquidity
2nd pick (weekly) after monthly sweep of liq. price left fresh demand zone with FVG above and liquidity sitting above mentioned demand zone. If price will close above 1.89$ it could be perfect buying opportunity 0,95$-1,1$
Beautiful virgin monthly demand zone has been spotted at level from 1145$ to 1355$ . I also painted liquidity zone for you . Demand zone is also with FVG above. Set your buy order slightly below 1355$ and thank me later 😎😉😘
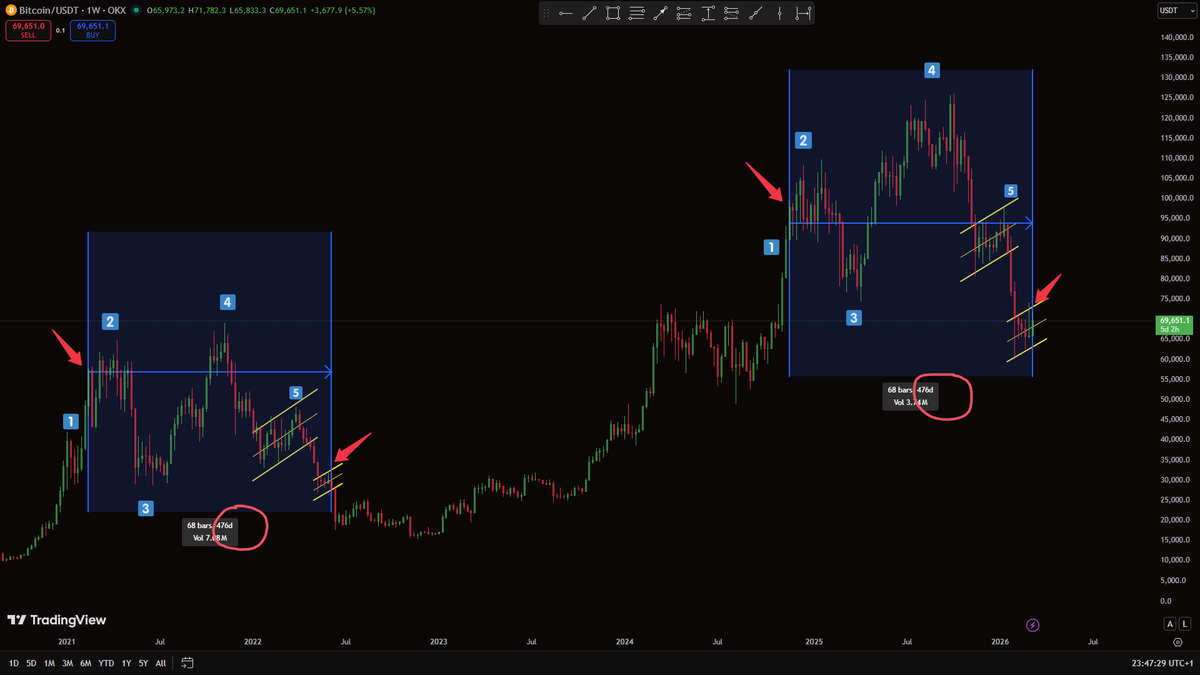
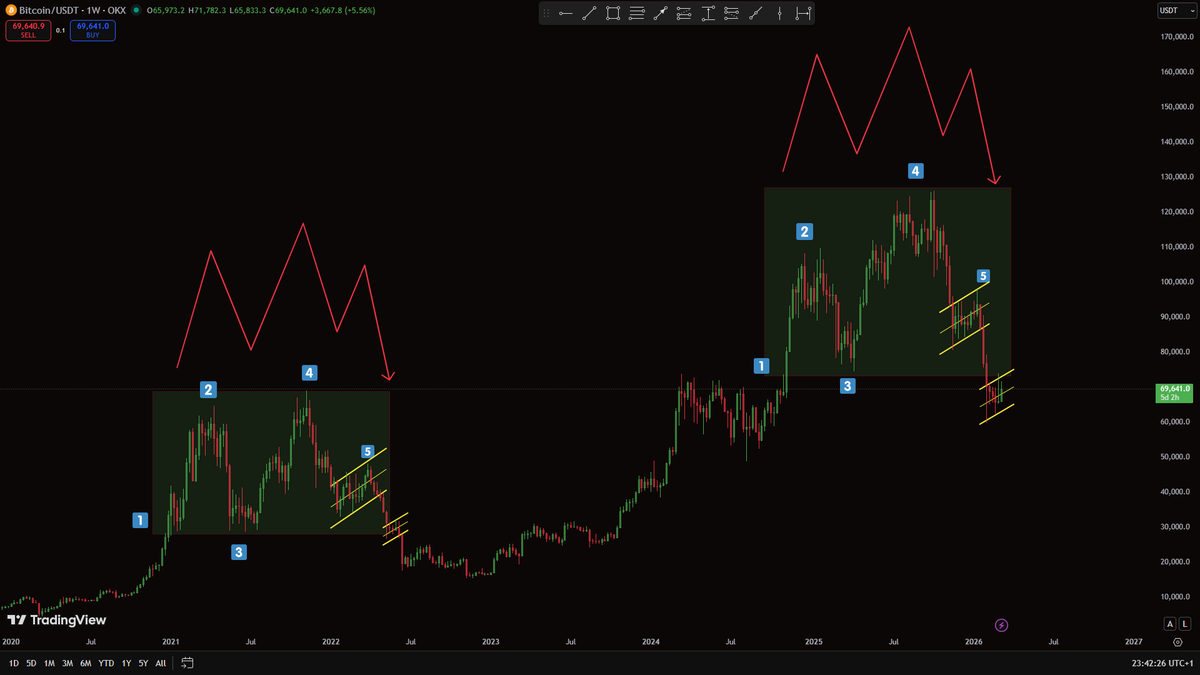
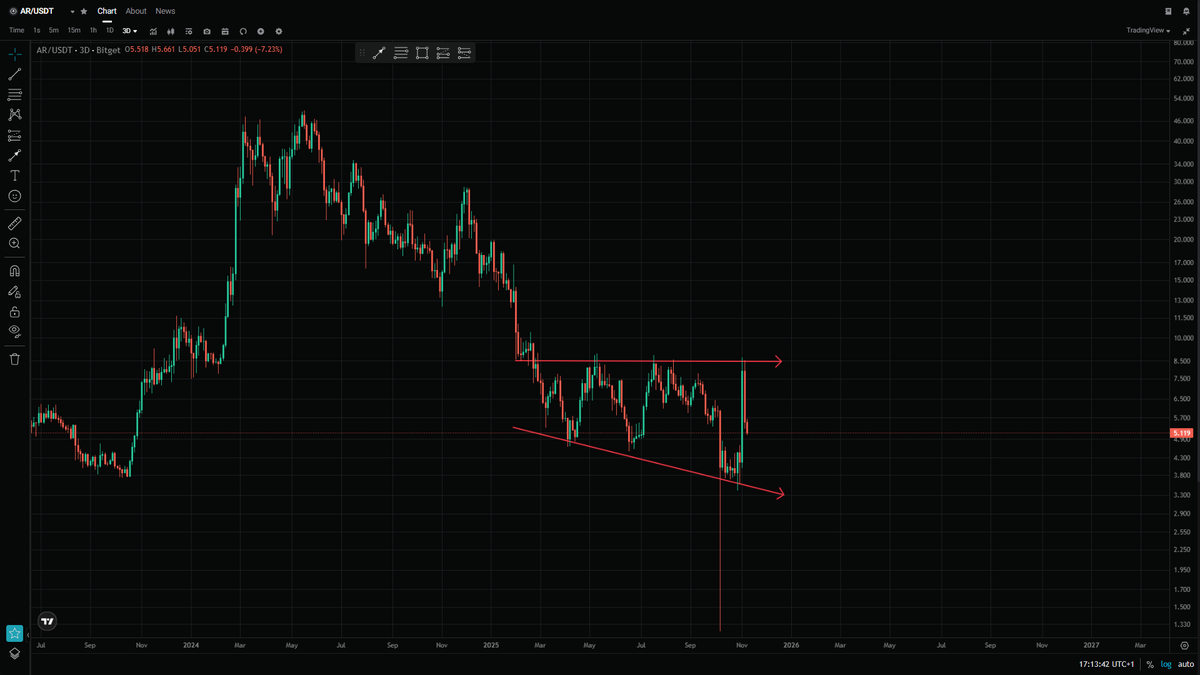
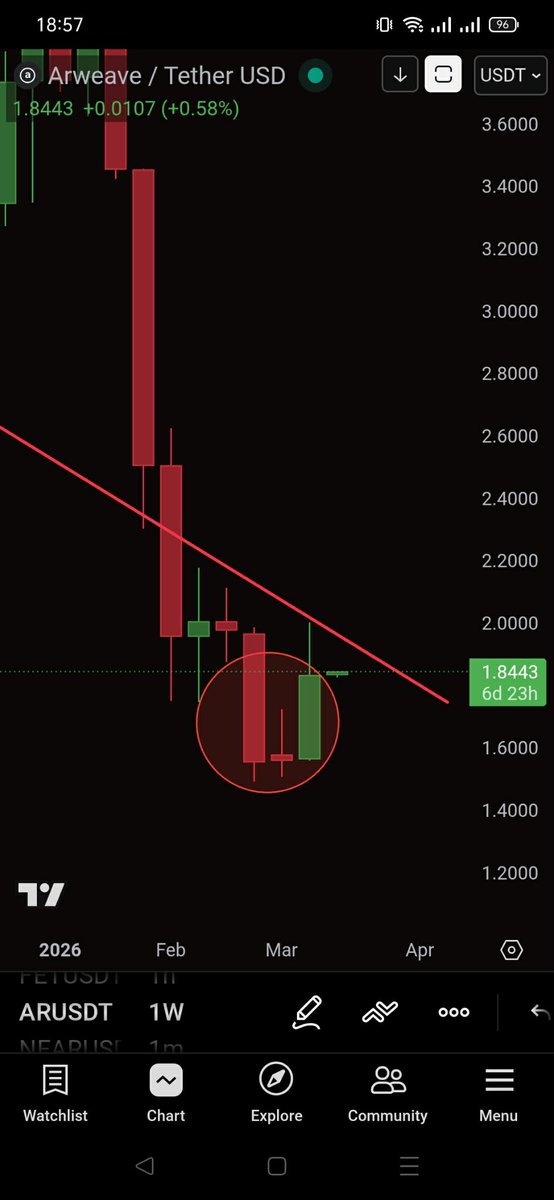
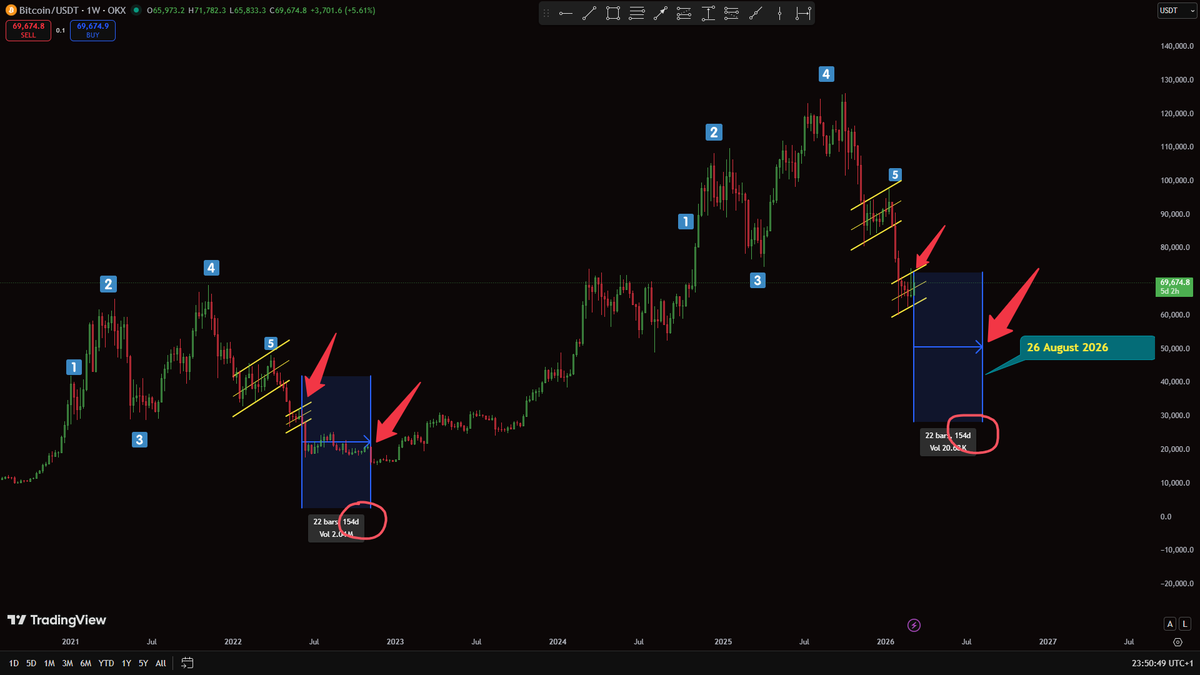
Another ARWEAVE update.
1st picture is representing priceaction from 9th May ´22 to 26th Feb. ´24. 2nd picture representing priceaction from 10th March ´25 to the present. I can see a lot of similarities , don´t you ?
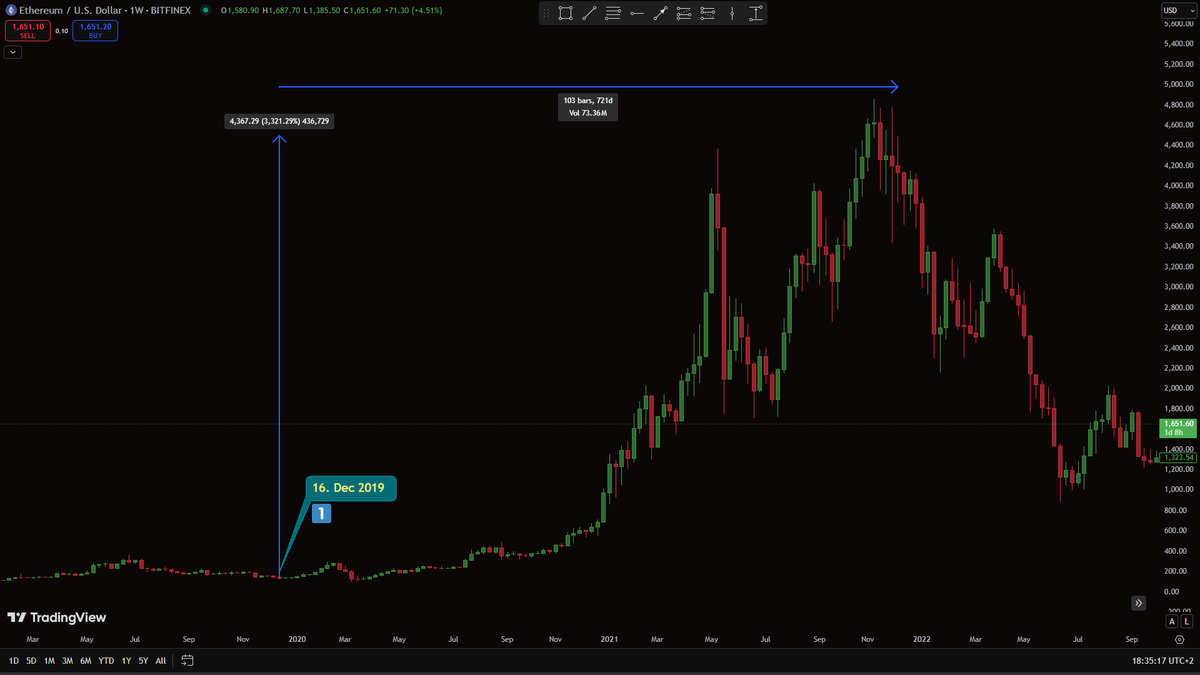
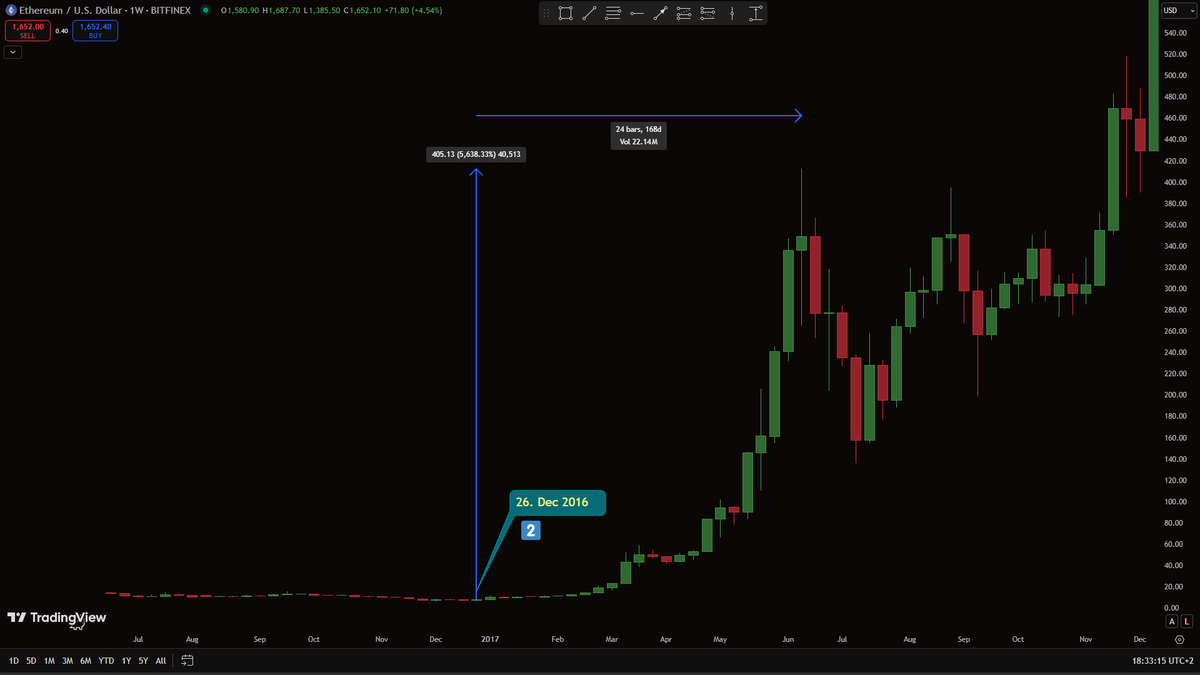
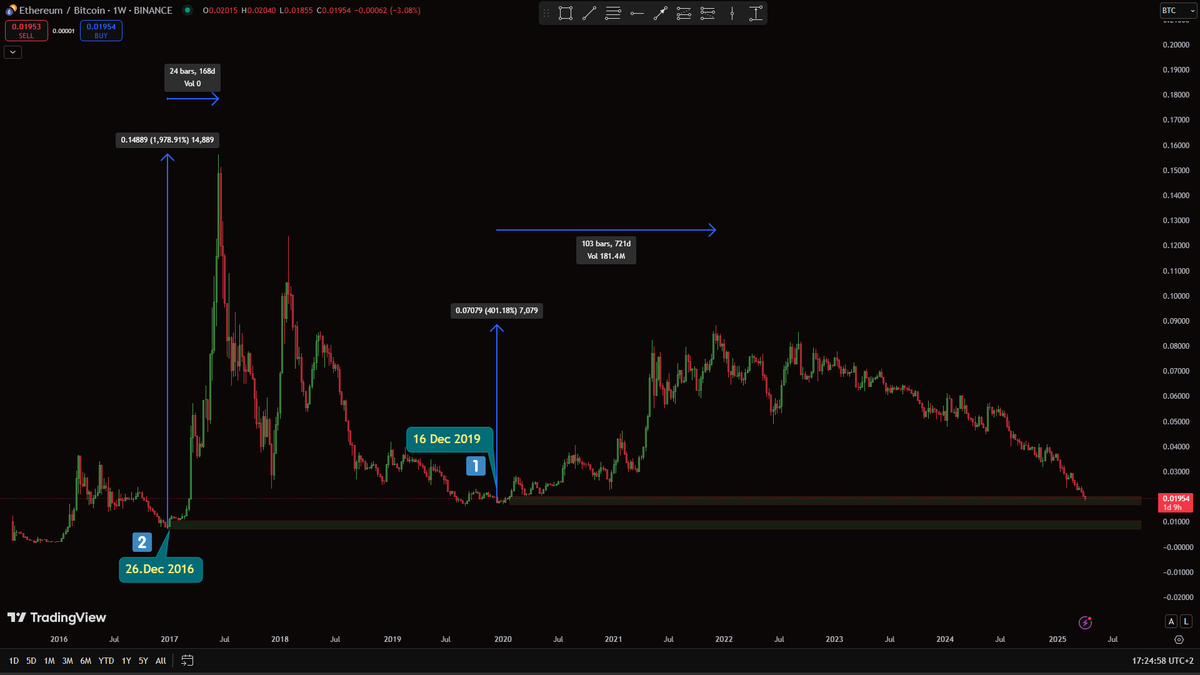
1 pic. ETH/BTC (representing key lvls /1 ,2 / where ETH started rise against BTC significantly. Price is currently sitting exactly at scenario 1.
2 pic. price of ETH went from 7,18 USDT at 412,8 USDT
3 pic. 131,75 at 4498
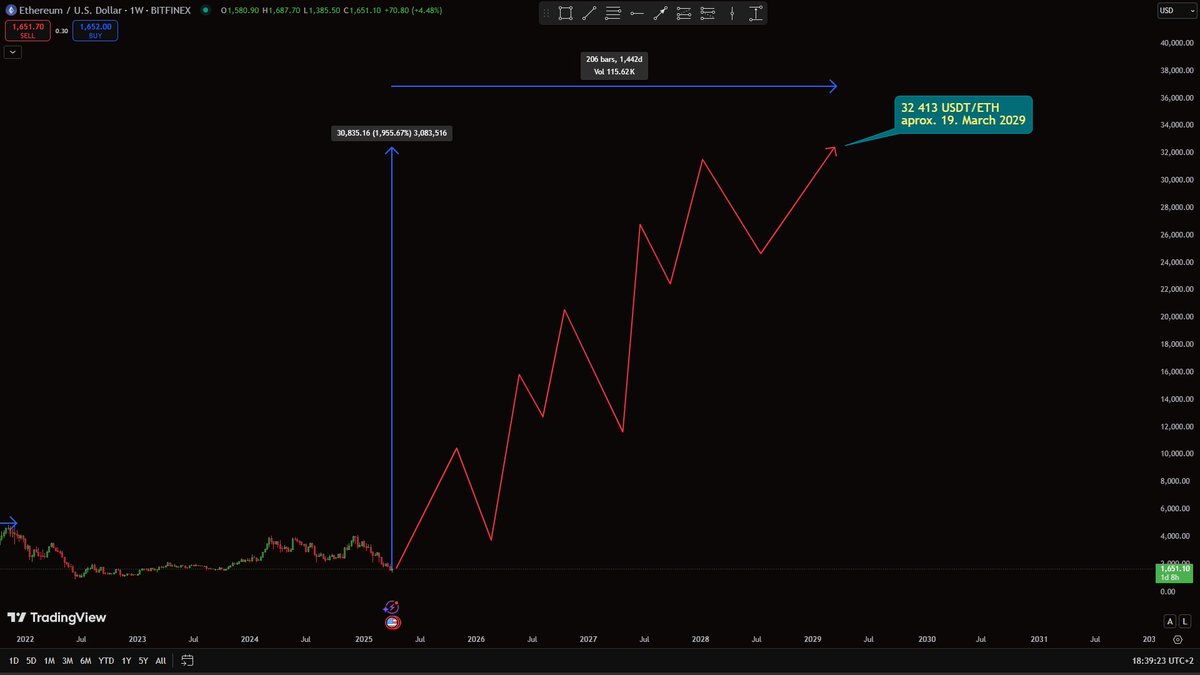
4 pic. chat GPT created current scenario based on history