Experienced technical analyst with a passion for deciphering market trends. Using charts and indicators to navigate the world of finance. #TechnicalAnalysis
Disclaimer: The content shared on this account is for informational purposes only and should not be considered as financial advice. Always do your own research and consult with a professional before making any investment decisions. #NotFinancialAdvice
I completely missed the mark on my $MSTR (MicroStrategy) call, and sometimes that's just part of trading. When you're putting your analysis out there publicly, you're going to get some right and some wrong. This one definitely falls into the latter category.
Looking at the chart now, the 4-hour timeframe appears to be trying to establish some support around the $127 area. Personally, I don't see that level as a major support zone. It sits in an area that doesn't have much significance based on the levels I'm tracking, which makes it difficult for me to have a high degree of confidence in it.
Because of that, I think the possibility of continued downside remains on the table. The next area I'm watching is a lower trend line that comes in just below $105. That's a region where Strategy has previously found support, so it would not surprise me to see price gravitate toward that level. If it gets there, a temporary breakdown or wick below the trend line followed by a recovery back above it could potentially create a stronger support signal.
Below that area, the next meaningful support zone I'm watching doesn't really begin to appear until around $80 and lower.
For now, I'm treating this chart cautiously. Until price proves it can establish and defend a meaningful support level, I think it makes sense to remain defensive and let the chart show its hand before making any strong assumptions about a bottom being in place.
Major resistance in play for $MSTR.
Price has now filled the gap near my top red zone, and there is a wedge structure that aligns with this resistance area.
If price continues higher from here, I’d be targeting the white zone next.
There is a pocket between the red and white zones that I consider a “low resistance” area. It has acted as a reversal point in the past, but it’s not something I heavily factor into my analysis.
On the higher timeframe, the monthly doesn’t show a strong trend, but it does highlight that the recent bounce came from a common momentum reversal zone. Combined with the MACD, this leans toward continued upside.
That said, continuation doesn’t mean straight up — pullbacks are still on the table, but as long as lows hold, the structure remains intact.
For now, it’s a waiting game. Price will tell the story.
It's been a little while since I last looked at $MSFT on one of my live streams, but the last time I analyzed it, I had drawn a Fibonacci retracement from the major low up to the peak around $445. At that time, I was looking for price to pull back and hold the 0.382 to 0.50 Fibonacci retracement zone as support.
That's exactly what happened. Microsoft found support in that area and produced a solid bounce. Once price reclaimed the channel, it looked like there was a legitimate opportunity for continuation to the upside. However, the rally eventually ran into one of the key levels I was watching—a major pivot and rejection zone around 467.
Right now, on the 4-hour timeframe, Microsoft is trading within a rising formation, but the chart doesn't look particularly healthy. In fact, that same $467 area is beginning to resemble the potential right shoulder of a developing head-and-shoulders pattern. The price action feels very sticky here, and momentum appears to be fading.
What concerns me even more is the weekly chart. The weekly candle structure looks rough, and if Microsoft loses its current support area and breaks back below the channel formation, the downside could accelerate quickly.
For now, this is a chart I'll be watching closely. As long as support holds, the bulls still have a chance to regain control. But if the channel fails and sellers push price back below that structure, things could get ugly for Microsoft in a hurry.
Here's what that short setup would look like if it plays out on $GOOG .
If you look at the upper portion of the 4-hour timeframe, you'll notice a small head-and-shoulders formation that developed. The measured move from that pattern was essentially fulfilled when price declined into the 0.382 Fibonacci retracement level, which is where we're currently seeing buyers step in and produce a bounce.
As price moves higher from here, I'll be paying close attention to the neckline of that head-and-shoulders pattern. Ideally, I would like to see price rally back into that area, get rejected, and fail to reclaim the level. More importantly, I would not want to see price break above the right shoulder, as that would weaken the bearish setup considerably.
If the neckline acts as resistance and the lower-high scenario develops, then the downside targets around the 320 to 308 area remain in play. That would align with the broader bearish structure I'm watching and provide the type of confirmation I'd like to see before becoming more aggressive on the short side.
For now, the bounce off the 0.382 retracement is constructive for the bulls in the near term, but the real test will be whether price can reclaim key resistance levels or if sellers step back in and defend the neckline.
The $GOOG bounce may just be getting started. On the 4-hour timeframe, price has reacted nicely off the 0.382 Fibonacci retracement level, which is generally a bullish development in the short term.
That said, there is still a descending trend line overhead that could act as resistance or break. My preference would be to see Google struggle in this area, fail to take out the recent high, and ultimately put in a lower high before continuing lower.
I have a more attractive entry zone in mind if that scenario plays out. Specifically, I'm watching the ascending trend line below current price as a potential area of interest. If price retraces back toward that trend line, I would be looking for a possible entry with downside targets in the 320 to 308 range.
For now, keep a close eye on this move. It is entirely possible that the current bounce develops into a more meaningful reversal. The 4-hour chart certainly looks constructive from a bullish perspective. However, until resistance is cleared decisively, I'm still hoping to see a rejection that provides an opportunity for an entry at lower levels.
I opened a long position on $SOFI yesterday with a target around $17, and we got there. Once price reached my objective, I decided to close the trade.
To be completely transparent, I felt a lot of anxiety around the position as it was developing. Even though the setup ultimately worked out, I wasn't comfortable holding it any longer once my target was achieved. Sometimes protecting your peace of mind is just as important as squeezing every last dollar out of a trade.
For those of you who are still in the position, I wish you the best of luck. We are approaching an area of resistance, and while the stock may continue higher, I felt it was the right decision for me to step aside and lock in the gain.
I'll continue monitoring the chart, and if the setup presents itself again under better conditions, I may look to revisit the trade at a later time.
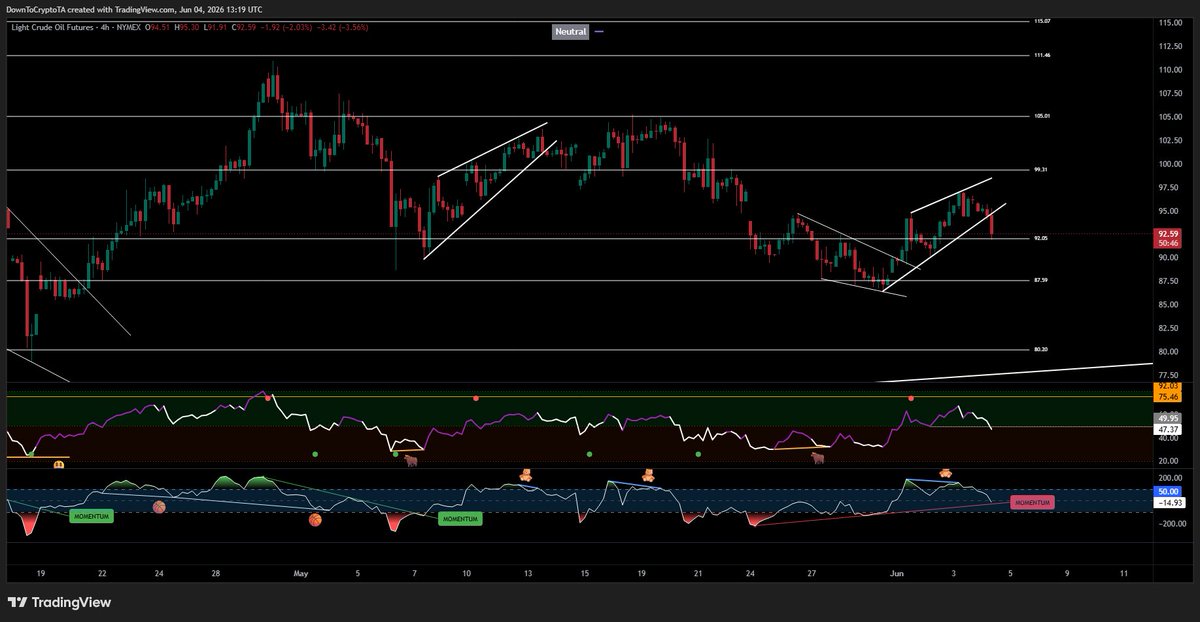
I shared an update on #oil $CL yesterday, highlighting a rising structure on the 4-hour timeframe along with bearish divergence beginning to develop. During today's livestream, I mentioned the possibility of a spring effect around the 92.05 level now that price has finally broken below the lower boundary of that rising formation.
If buyers are able to step in and defend this area, we could see a short-term reaction bounce from these levels. However, if the spring setup fails to materialize, then 87.59 remains a key area to watch. Historically, price has shown a tendency to revisit that level, making it a logical downside target should weakness continue.
For now, the breakdown from the rising structure shifts the focus toward downside risk, while the 92.05 area serves as the first line of defense for the bulls.
I gave a short setup on $AMZN during my live stream a while back, and so far it's been playing out fairly well. The move has been a bit more sideways than I initially expected, but the overall thesis remains intact.
If you move to the weekly timeframe, you'll notice Amazon has been trading within a rising formation. We recently pushed into the upper boundary of that structure and even saw a deviation above it, which was the primary basis for my short thesis.
At the moment, we're hovering around a support area on the 4-hour timeframe. The 4-hour chart appears capable of producing a relief bounce from here, and that could be driven more by short-term news flow than anything else.
What has my attention is the daily timeframe. The daily chart is beginning to show signs of expansion. If that expansion follows through to the downside, it could lead to an accelerated decline in Amazon's price, regardless of whatever narrative ultimately gets attached to the move.
For now, I would remain defensive.
@the_real_CJ Another overreaction from retail on the Sailor disposal which took place last week. Yet, some influencers are convincing there followers it took place today.
$SPY hit the topside of the trendline in our previous discussions. Price displayed a short reaction, but will we stall out longer at this resistance is the question. So far nothing is broken.
I want to correct some information I shared in today's video regarding the purchase of #IBIT shares #Bitcoin in late March.
While researching the filing, the SEC database did not properly refresh my search query, which resulted in information from a different company being displayed. Unfortunately, I relied on that incorrect data when discussing the transaction.
I sincerely apologize for the oversight. Accuracy is extremely important to me.
Thank you for your understanding.