Measured futures data and prop firm rules in plain English. No signals, no screenshots, no claims about your results. The method comes with every number.
We are a lab, not a signal service.
We measure how futures actually behave, we take prop firm rules apart in plain English, and we publish the method next to every number.
1,464,070 one-minute bars of NQ and ES. No win rates. No screenshots.
@SimJTrades Stopped and then it goes is the worst flavour of being right. Calling it there instead of going out to win it back is the part that actually keeps the account alive. Tomorrow gets its own open.
That is the stop doing what a stop is, not a flaw in your plan. Once it is touched it turns into a market order, so you get whatever the book has at that second, and it is worst when your stop sits where everyone else's sits.
The lever that moves it is contracts, not stop distance. Fewer contracts for the same dollar risk buys more points of room, and more room means fewer trips through the thin patch. For scale, NQ median 1 minute candle is 12.25 points high to low, 09:30 to 16:00 New York.
@dijonnnn1 Honest answer, we have not measured that one, so we would not claim it either way. Worth logging for a month. What we have measured is the bar the morning has to clear: NQ median 5 minute candle is 28.00 points high to low, 09:30 to 16:00 New York, Jun 2024 to Sep 2026.
@G_U_S_O To be precise about what that does and does not show: it measures how much room a position needs as the horizon grows, inside one session. It is not evidence that a four day limit is necessary. Your original point still stands on its own.
We went and measured your question.
Hypothetical entries every 5 minutes, each counted long and short. How far NQ travels against the entry before the horizon ends:
5 min: 12.94 pts
30 min: 31.06
120 min: 64.19
Same drawdown, same position risk. Time on its own asks for 5x the room.
@Robleytrades Trimming to widen the stop is the part most people skip. They keep the size and shrink the room instead, which is the same trade with less chance of surviving the wiggle on the way. Good call.
@MSroad2millions Confluence gets you the where. It cannot promise the session will hand over the distance. Taking it off flat when it stalls is a decision, not a miss, even if it reads like one an hour later.
@azrael_options@jkleinburger Yeah, you put it better than we did. And it is a path question more than an endpoint one. The tape can finish well inside the range they charged for and still travel far enough on the way there to hurt whoever is short it.
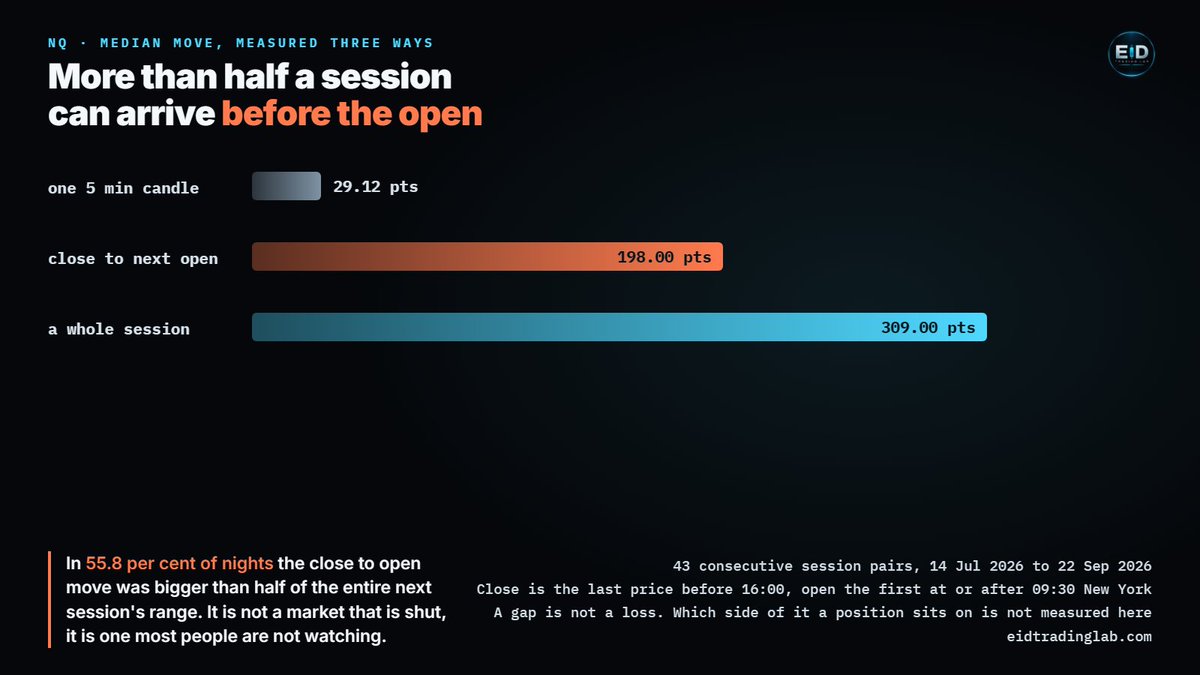
You were flat overnight. The chart was not.
We measured the NQ move from one session's close to the next session's open. Median 198.00 points. A whole session, open to close, has a median range of 309.00. One 5 minute candle in the same sample is 29.12.
On 55.8% of nights that overnight move was bigger than half of the entire next session's range.
43 session pairs, 14 Jul 2026 to 22 Sep 2026. It says nothing about direction, and a gap is not a loss. It just means the price you look at in the morning got there while you were asleep.
@jkleinburger@azrael_options Short version while you wait: implied is how much movement the options market was charging for in advance, realized is how much actually showed up. The gap is the difference between the price of expected movement and the movement you got.
@PatternProfits Publishing the N is the part almost nobody does. 75 setups inside 250 days also tells people the regime is only there about a third of the time, which matters as much as the hit rate does.
@medic2stars@TradingLucid Congrats. The first one is the one that counts, because passing is a market problem and getting paid is a rules problem, and you had to clear both. Plenty of people never get past the second.
@Stroodey Rude is the word. Right direction on a counter trend one and still taken out at BE is its own special annoyance. The read was there, the exit just got nervous before the move did.
@JCinvests365 Cheap to get into is true. The part that catches people coming from options is that the eval can end your day before the market does, so a trade that is still fine on the chart can be over for the account. Worth reading your firm's drawdown wording properly in week one.
@seanlibbert@MrZincx Consistency rules work backwards from your best day. That 1,700 has to stay under the allowed share of total profit, so one day quietly sets how much total you need before anything comes out. Check your firm's exact percentage, they vary.
@MaheerSir@daytradingrauf Nobody can call a loss in advance. What you can see early is whether the session is offering enough movement to pay for the risk you take. On a narrow day the stop costs the same and there is less move to collect, so sitting out is a size decision, not a prediction.
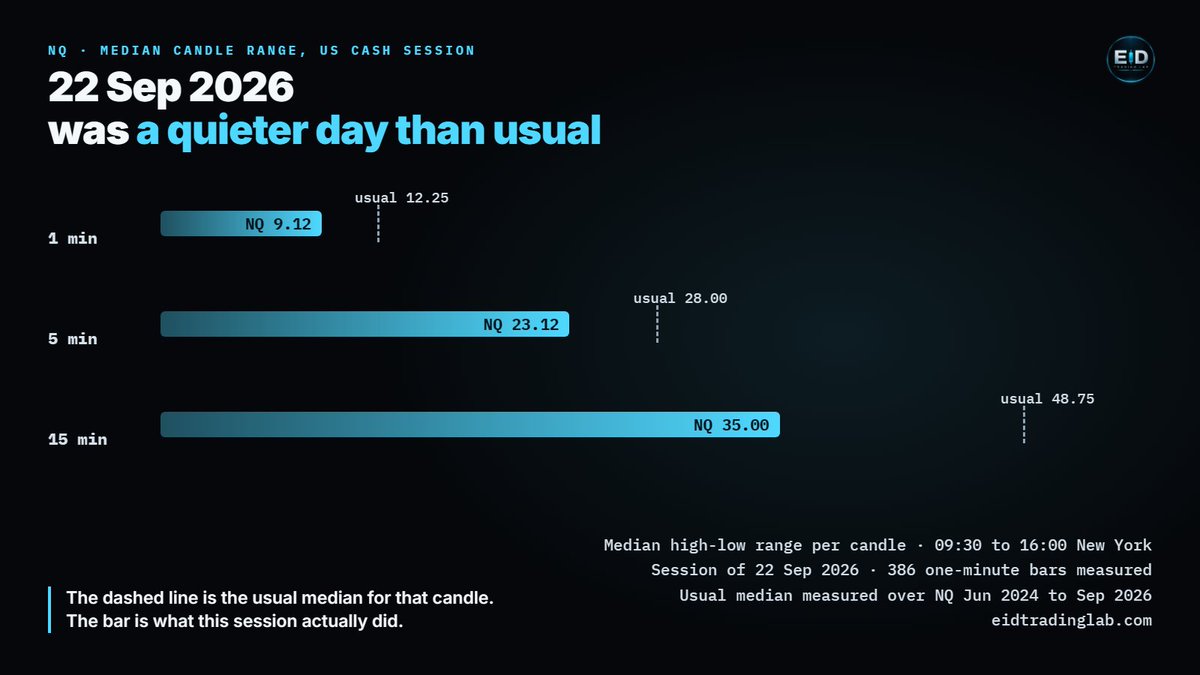
Yesterday was a quieter session than usual on NQ.
Median 5 minute candle: 23.12 points. The usual median is 28.00, so about 17% below it.
The 15 minute candle came in at 35.00 against a usual 48.75.
Same instrument, same hours, smaller candles. The usual figure is measured over Jun 2024 to Sep 2026. It describes the sample, not the day in front of you.
Session of 22 Sep 2026, 386 one-minute bars, 09:30 to 16:00 New York.
@SimJTrades Asia is brutal on a stop that was sized for the New York session. Same distance on the chart, completely different amount of movement happening around it.