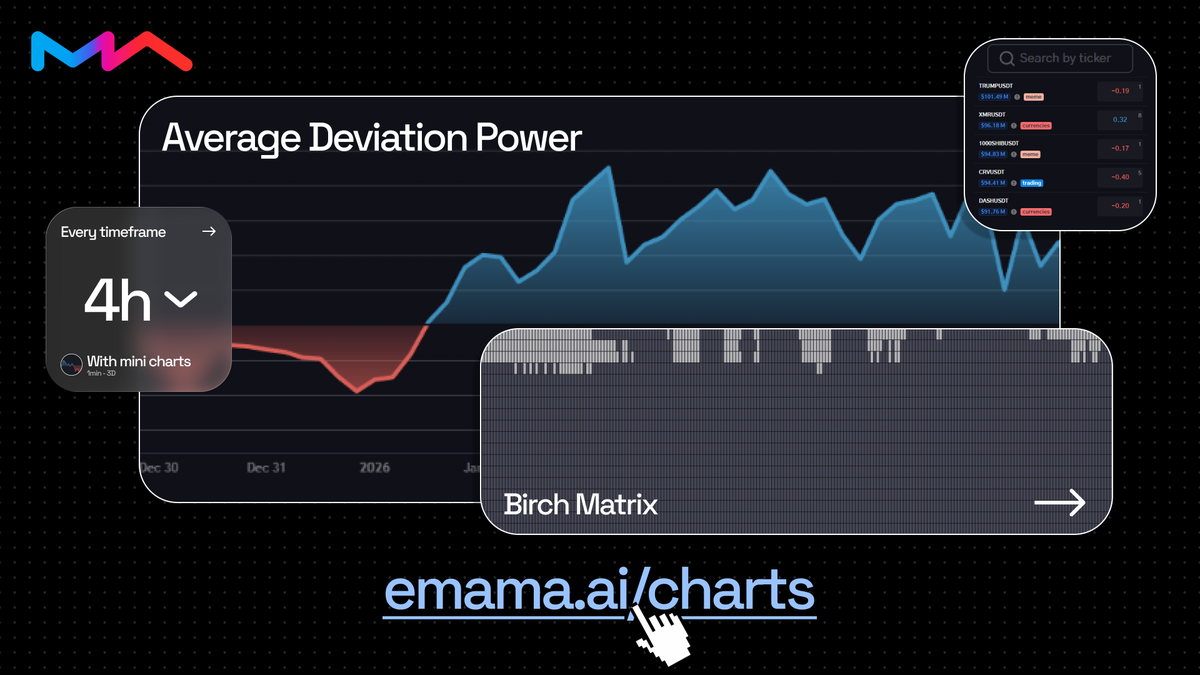
Now anyone can analyze the market with EMAMA!
The new Charts section is open without registration:
- 600+ tickers
- Individual Birch Matrix
- ADP from 1min to 3D
👉 Try it right now: https://t.co/UYjEXxfY9P
New Medium article is live
⠀
Best Free Crypto Analytics Platforms in 2026
⠀
Most “free” tools aren’t actually free — just limited previews.
⠀
We break down 5 platforms:
• TradingView
• Coinglass
• Glassnode
• Coinalyze
• EMAMA (full Pro access free in beta)
⠀
One of them is currently giving away full Pro access.
⠀
Read here:
https://t.co/E9pQQ8MxaA
⠀
#Crypto #Trading #CryptoAnalysis #Bitcoin #DeFi #Altcoins
bitcoin:native — An Opportunity That Hasn’t Been Missed Yet. Just not the one everyone is looking for.
⠀
Last week in Bitcoin was brutal. Every channel is filled with attempts to catch the bottom. Everyone is hitting “BUY” on every bounce. Everyone is waiting for a reversal. We are looking the other way. And here is why.
⠀
First, Saylor
⠀
May 26–31: Strategy (formerly MicroStrategy) sells BTC for the first time in 4 years. 32 coins at an average price of $77,135. The amount is negligible — $2.5M out of a total balance of 800,000+ BTC. But the news shook the entire market.
⠀
After that, BTC drops 15% in a week, falling below $60,000. Panic, liquidations, “end of Bitcoin”.
⠀
June 1–7: Saylor buys 1,550 BTC at an average price of $65,332. $101.3M total. 48 times more than he sold, and significantly cheaper. For the first time since 2020 — purchases below their average entry price.
⠀
One sentence summary: he shook the market with a small sell, waited for the dump, then bought back heavily at lower prices. Coincidence? Maybe. But the fact is clear — a large player is accumulating, not panicking. And Bitcoin’s structure confirms it.
⠀
Structure reads the drop
⠀
12H ADP shows the strongest breakdown since February this year. This is not local noise — this is a structural shift after months of holding above zero.
⠀
3D, 1D, 12H — all higher timeframes show the same thing: a clear and developing downtrend structure. Not spikes, not range, not uncertainty — a trend.
⠀
While everyone is trying to catch the bottom, we trade with the trend. We do not guess reversals. We follow confirmations.
⠀
Where the entries are
⠀
Opportunities appear on the 4H and 2H charts. But with important context.
⠀
When, in a broader downtrend on higher timeframes, lower timeframes move above zero — this is not a reversal. It is accumulation by a large player. A liquidity grab from those trying to catch bottoms or press shorts below obvious levels.
⠀
Saylor just showed how this works at scale.
⠀
At the moment, 4H has printed a “bad close” near the zero line and is moving below it. If 4H holds below zero, that becomes a signal to look for shorts in the direction of the higher timeframe trend.
⠀
2H confirms the picture. There was a breakout above zero, now a reversal back toward it with renewed downside momentum.
⠀
How to enter precisely
⠀
Higher timeframes set direction (down). 4H gives confirmation (holding below zero). Precise entries come from lower timeframes — 5m and 15m.
⠀
When lower timeframes show a downside reversal in the same zone where 4H prints weakness, that is the entry moment. Same mechanics as INJ longs, just inverted.
⠀
Warning signal for the short: 4H reclaiming above zero with 12H confirmation. If that happens, we exit and wait for a new structure.
⠀
Main idea
⠀
In previous posts in this series, we covered assets waking up into bullish cycles: CRV, HYPER, TRUST, INJ — all long setups.
⠀
BTC today is the same type of setup, just in the opposite direction. Structure changed, direction changed, methodology remains the same.
⠀
This is the advantage of trading deviations. The approach does not change — only the side does. We wrote about this in the TRUST post. Today it is applied in real time.
⠀
No rushing. No illusions. No running against the wind.
⠀
#Bitcoin #CryptoTrading #MarketStructure
There are two types of traders. Those who ALREADY use risk management. And those who STILL don’t.
⠀
Last week was another reminder of the difference between them.
⠀
Bitcoin and the entire market sold off. For one half of traders, the drawdown was expected, within predefined limits. For the other half, it was something painful and unpredictable. The difference is not in knowledge, not in indicators, not in the ability to read charts.
⠀
The difference is that the first group has a system that prevents them from becoming worse versions of themselves.
⠀
What Usually Happens in a Falling Market
⠀
Every scenario is familiar. Each one is a deposit killer:
⠀
• You see a drop - you go long trying to “catch the bottom”
• Stop gets hit - you open another position with double size to “win it back”
• Position is in loss - you average down, “it can’t go lower” (it always can)
• You sit 8 hours in front of the screen - decisions get worse every hour
• You remove the stop - “it’s about to reverse, I can see it”
⠀
These are not knowledge problems. These are behavioral problems. They are not solved by reading more analysis. They are solved only by a system that prevents you from doing them.
⠀
Not Warnings. Blocks.
⠀
The key difference of our Risk Management module compared to other terminals is this:
⠀
Most platforms show “are you sure?”. You click yes - and it happens. That is not protection, that is a checkbox for reporting.
⠀
We do it differently. If a rule is active, the action does not go through. Not a warning, not a flag. A block.
⠀
Set “only trades with stop” - opening a trade without a stop becomes physically impossible. Set a 5% daily drawdown limit - after the threshold is reached, new trades and averaging are blocked until the next day.
⠀
No exceptions in moments of weakness. No exceptions at all.
⠀
Your Pain - Our Solutions
⠀
• Entering against trend → ADP/TD filter blocks longs if macro structure is against it
• Averaging into losses → averaging limit + decreasing size on each add
• Opening trades without stops → mandatory stop-loss on every trade
• Removing stops in the moment → restriction on manual closure while stop/take-profit is active
• Overleveraging emotionally → leverage cap, cannot exceed it
• Sitting in front of screens for hours → daily terminal time limit
• Revenge trading after losses → automatic trading halt at daily loss limit
• Trading illiquid assets → volume-based asset filter
⠀
One Idea in a Single Sentence
⠀
Set the rules when you think clearly. Let them protect you when you don’t.
⠀
This works because the “you” who is calm and the “you” who is in drawdown are two different people. The first knows risk per trade should be 2%. The second is convinced “this one will bounce, I can go 5%”. And he will be right - until the stop takes half the account.
⠀
Rules are not needed because of lack of knowledge. Rules are needed because of yourself.
⠀
#Trading #Crypto #RiskManagement
🫥Bitcoin just had its worst week since November 2022.
⠀
Most traders call it panic.
⠀
The structure says something else.
⠀
New Weekly Analytics covers:
⠀
• $1.5B in liquidations
• why 85% of liquidated positions were longs
• how every major timeframe aligned before the drop
• 4H market-maker price control
• the short setup from the zero line that stayed valid all week
⠀
The move wasn't random.
⠀
The warning signs were there in advance.
⠀
Full breakdown 👇
⠀
#Bitcoin #CryptoTrading #MarketStructure
📡Most traders use one tool for analysis.
⠀
Another for execution.
⠀
And keep risk management in their head.
⠀
That's where things break.
⠀
New article covers:
⠀
• why stop-losses should be enforced, not suggested
• why daily loss limits matter more than most indicators
• what an external position overseer does
• why risk management belongs inside your analytics terminal
• how EMAMA turns discipline into infrastructure
⠀
Good traders find setups.
⠀
Great traders survive long enough to compound them.
⠀
Full article 👇
https://t.co/64DmtFptfv
⠀
#CryptoTrading #RiskManagement #TradingPsychology
injective-protocol:native - An Opportunity That Hasn’t Been Missed Yet. Only in a More Mature Form
⠀
We continue the series of assets showing confirmations of upward cycles. But INJ is different. After the young HYPER and the fresh TRUST, after CRV returning with a heavy history behind it, today we are looking at an established L1 with a cycle, fundamentals, and active development. A mature continuation of an upward move. And the structure confirms it across all timeframes.
⠀
⚪️3D - Preparing the Hold
⠀
The strongest signal. ADP on 3D has confidently moved above zero and continues higher, with the current level almost +39% above its EMA. The chart is holding the green zone methodically, with no signs of an attempt to return below the line.
⠀
The upward arrow from the February low stretches toward new highs. Since winter 2026, there has been a consistent climb.
⠀
⚪️1D - Duration
⠀
The daily chart has been steadily above zero for a long time. Since mid-April, it has been a solid green zone, with no serious breakdowns. This is not a “rocket” with a high risk of a fast reversal. This is a functioning upward trend that is holding.
⠀
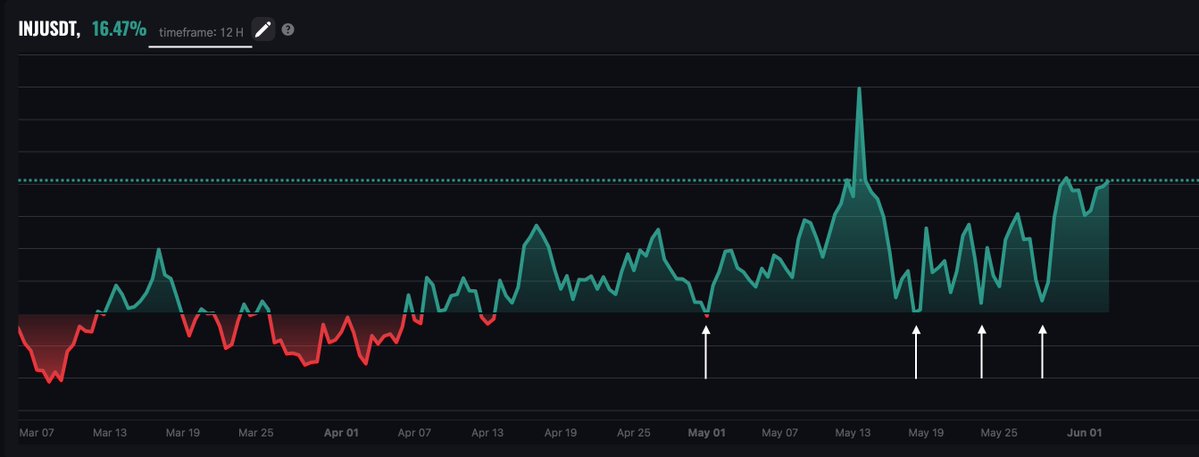
⚪️12H - Entry Points
⠀
This is the most practical part. The 12H chart shows precise touches of the zero line and holding above it. Each touch is an opportunity to enter in the direction of the main trend. Not to jump into something overheated, but to enter on a return to balance.
⠀
The arrows on the chart show examples of these touches over the past weeks.
⠀
How to Enter Precisely
⠀
The zone is defined by 12H, through a touch of the zero line. The exact entry moment is defined by 1H and 2H. When the lower timeframes show an upward reversal in the same zone where 12H is touching the zero boundary, that is the moment. The higher timeframe gives the zone. The lower timeframe gives the point.
⠀
Fundamentals for Context
⠀
INJ is currently one of the most actively developing L1s:
⠀
mainnet upgrade, proposed on June 2, positioning INJ as a settlement layer for on-chain finance
⠀
Binance US launched INJ staking on May 29, which gave the asset a +12% move in one day on the news
⠀
MCP server for AI, making it the first blockchain where AI agents can trade perpetuals through natural language
⠀
58% of the total supply is staked, which compresses the liquid offer
⠀
But as we already wrote in the TON post, structure matters more than news. ADP showed the reversal before most of these catalysts. The news is now confirming what was already visible through deviations.
⠀
How to Work With It
⠀
Without greed. ADP 3D at +39% is already a significant deviation, and part of the move has already happened. This is not the point where you enter with full risk.
⠀
But 12H touches of zero are exactly the moments where you can build the position in parts. Each such touch is a return to balance inside an upward trend. Confirmation comes through 1H/2H. The stop goes below the last significant 12H low, not too close. And yes, on our platform, stops can be set not by price, but by deviation.
⠀
The warning signal is 12H holding below zero. Not a one-time flush, but a proper hold with several candles. If that happens, we exit until a new picture forms.
⠀
#INJ #EMAMA #CRYPTO
The Most Unusual Thing About Our Platform Is Not the Signals. It Is the Statistics
⠀
Most traders look at two numbers: Total P&L and win rate. “How much did I make, and how often was I right?” That is enough to understand whether you are in profit. It is not enough to understand whether it will last.
⠀
In our Stats module, the metrics are from a different league. The same type of metrics used by quant teams, hedge funds, and professional managers. On retail platforms, they are usually not available at all.
⠀
Let’s show the strongest ones.
⠀
Kelly %
⠀
The Kelly Criterion. The formula answers one very specific question: what percentage of your deposit should you risk on one trade to maximize long-term capital growth, based on your real historical edge?
⠀
A positive Kelly means the strategy has a statistical advantage. Zero or negative means the math says, “do not trade this.” Experienced traders usually use half Kelly to reduce volatility. You will not see this on most retail platforms. On ours, it is in the main panel.
⠀
R²
⠀
The coefficient of determination applied to the equity curve. In simple terms, it shows how smooth your profit curve is, or whether it is just random noise.
⠀
Above 0.7 - results are systematic
0.3-0.7 - there is a trend, but with a lot of turbulence
Below 0.3 - the result is noise, with no repeatability
This is one of the key indicators quant teams use to separate a working strategy from a lucky run. You can have +30% for the year and an R² of 0.2, which means you got the result, but it is not reproducible.
PCI HHI
⠀
The Herfindahl-Hirschman Index. The same formula used by antitrust regulators to measure market concentration. We applied it to your winning trades.
⠀
The question it answers is this: how many trades does your profit really depend on? Not how many winning trades you have in total, but how many of them actually carry the result.
⠀
If you have 100 profitable trades, but only 8 of them are “effective,” the strategy depends on a few lucky outcomes. Remove the top 5, and you get zero. That is a lottery, not a system.
⠀
Professionals know this about themselves. Most retail traders do not, because they have nowhere to see it.
⠀
ECR
⠀
A composite index: capital efficiency, result consistency, and risk control. One number for a weekly check-up. If it grows, the strategy is improving. If it falls, something has broken and needs investigation.
⠀
Why All of This Matters
⠀
Knowing that you are in profit is the basic level. Knowing why you are in profit, whether it is repeatable, and what will break first is the professional level.
⠀
Retail platforms show win rate because it is simple and does not scare anyone. We show Kelly, R², and HHI because without them, you are not managing capital. You are hoping.
⠀
Full guide to the metrics, with screenshots and interpretation: https://t.co/qbGfU5dvwn
💼BTC finally joined the market.
⠀
The uncertainty from last week is gone.
⠀
For the first time in weeks:
⠀
• BTC agrees with the market
• Daily and 12H agree with 2H
• Structure points in one direction
⠀
New Weekly Analytics covers:
→ the May accumulation/distribution pattern
→ the exact 2H short setup
→ why catching bottoms is the trap this week
→ how double control points filter false reversals
⠀
Full breakdown 👇
⠀
#Bitcoin #CryptoTrading #MarketStructure
📰Most crypto platforms treat mean reversion as a strategy you assemble yourself.
⠀
EMAMA was built around it from the ground up.
⠀
New article covers:
⠀
• why EMA25 is the core signal
• why TradingView fails at market-wide mean reversion
• scanning 500+ coins across 27 timeframes
• multi-timeframe deviation convergence
• Smart Terminal execution without visible intent
• statistical extremes vs price action noise
⠀
Mean reversion is not a feature here.
It’s the architecture.
⠀
Full article 👇
https://t.co/kv5feCIn4g
⠀
#CryptoTrading #Bitcoin #Altcoins
🌟 One Click. Fifty Trades. Smart Order in Our Terminal
⠀
In most terminals, a trader lives inside one trade. Open it, watch it, close it. Want diversification? Repeat the same process ten times manually. Configure every position, enter every parameter, monitor each one.
⠀
With us, it works differently. And this “differently” is exactly what we want to talk about.
⠀
What Smart Order Does
Smart Order is a group trade based on a filter. One action, dozens of positions opened simultaneously using smart criteria. The principle of index-style trading is built directly into the “Buy” button.
⠀
When a signal for a broad market move appears, for example the same Scalp All Market we wrote about earlier, you do not have to choose between BTC, ETH, SOL, and fifty other tickers. You set the filter, and the platform selects the candidates automatically:
⠀
Frame - which timeframe to evaluate
Type - which metric to rank by: DP, DUR, or a combination of both
Condition - top candidates by strength or weakness
Max orders - how many positions to open in the group
⠀
⚪️Click the button, and 25, 50, or however many positions you specified are opened. All under one logic, with the same risk parameters: leverage, size, stop, and take profit.
⠀
Where the Real Advantage Is
When you trade one coin, you are betting on one specific outcome. If you are right, you win. If you are wrong, you take the hit.
⠀
When you trade a group of 50 assets under one shared criterion, statistical distribution starts working for you. Not all 50 will perform perfectly, but if your overall hypothesis is correct, for example “the market has reversed upward and continuation is starting” the average result can be positive even if several individual positions end in a loss.
⠀
This is the approach used by professional managers. Instead of betting on one coin, you make a distributed bet on a group trend. Hedge funds and quant teams need entire development teams and infrastructure costing tens of thousands per month to do this. You get it as a button.
⠀
Group Management - Where It Gets Interesting
⠀
Opening 50 trades is only the beginning. Then you need to manage them. And this is where things get unusual.
⠀
The terminal works on three levels:
💠Entire position - all open trades at once
💠Group - the specific batch opened by your filter
💠Individual trade - precise control over one position
⠀
And each level supports operations:
Averaging - add a percentage to all profitable trades, all losing trades, all longs, or all shorts
Partial closing - take part of the position off all profitable or all losing trades
Closing - close only profitable trades, losing trades, longs, shorts, or everything at once
⠀
In practice, it works like this. The market starts to turn, and you close all losing positions in one click, freeing up capital. The group moves into profit, and you take 30% profit from all positions at once. One trade in the group fails, so you close it individually while the rest continue working.
⠀
You are not dealing with every trade separately. You are managing portfolio states.
⠀
💬 When It Works Best
A broad market movement alert triggers - you open a trend-based group in one click
⠀
The market moves into overheating - you take partial profit from all profitable positions at once
⠀
The picture breaks - you close the losing positions and leave the profitable ones running
⠀
A counter-structure appears - you open a second group in the opposite direction, and both run in parallel
⠀
And every close is then displayed on the asset chart: where you entered, where you averaged, where you exited. So you can review everything after the fact and understand what worked, and what was an execution mistake.
⠀
One click. Dozens of trades. This is how you read the market as a system, not as a list of tickers.
⠀
#CryptoTrading #AltcoinSeason #TradingTools
$TRUST - Another Opportunity That Hasn’t Been Missed Yet
⠀
We continue the series of assets showing their first signs of emerging from the shadows. Last week, we covered HYPER. Today, the focus is on $TRUST. A similar phase of the cycle, a similar nature of awakening, but with its own specifics. And with its own risk-management mechanics, which we will discuss separately. Let’s break it down.
⠀
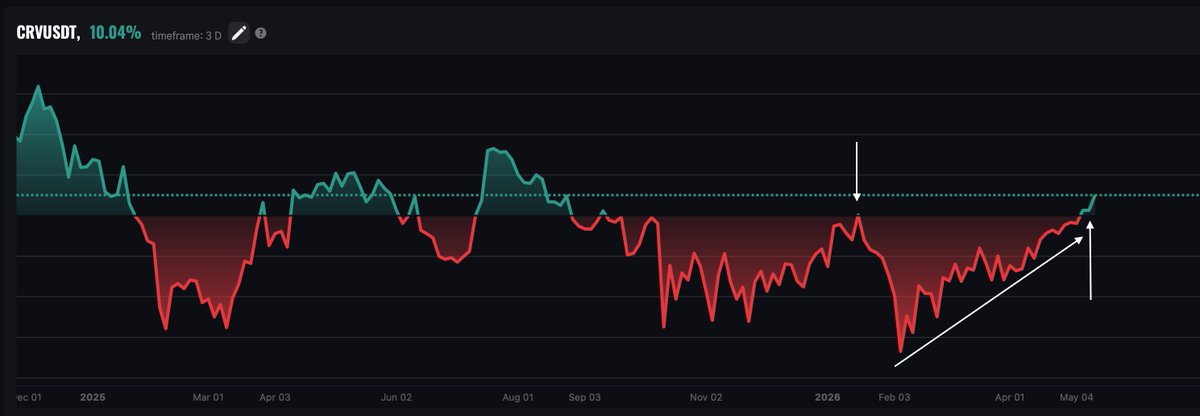
3D - For the First Time Since Launch
⠀
$TRUST appeared on Binance in early November 2025. Since then, the 3D chart has not produced more than one close above the zero line. Every attempt was rejected, and the asset returned below its EMA. The scenario repeated methodically.
⠀
Now the picture is different.
⠀
The ascending white line below shows that the preparation lasted several months. Lows were rising methodically, and the panic at the end of February remained the final one. After that came a gradual climb toward the zero boundary. And now, the first successful move into the green zone, which is still holding.
⠀
An important nuance: confirmation that this is indeed “more than one close above zero” will come in two days, when the current deviation closes on the 3D chart. Until then, the picture is live, but not finalized. On the 3D chart, closes happen once every three days, and this one is decisive.
⠀
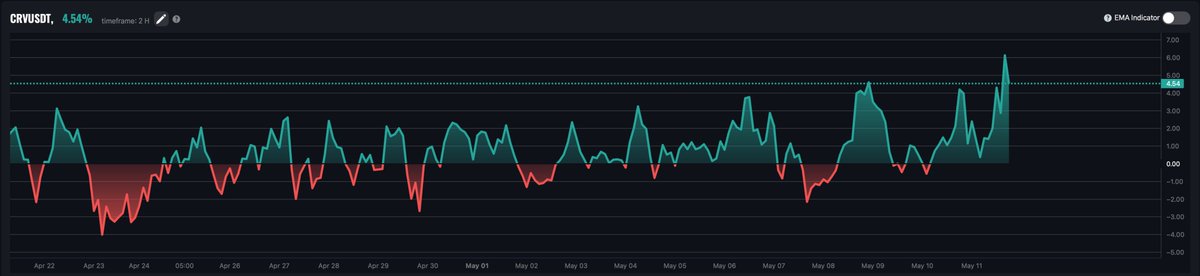
2H - Where We Look for Entry Points
⠀
While 3D is still maturing, we work with the 2-hour chart. It shows clean reactions to the zero boundary: touches, bounces, and holding above it. This is the zone where the position can be built gradually.
⠀
The logic is simple. The higher timeframe, 3D, sets the direction. The lower timeframe, 2H, gives entry points. The area around the zero-line touch on 2H remains the working zone as long as the structure is not broken.
⠀
What If the Structure Breaks
⠀
This is the most interesting part of working with TRUST. The 2H chart will be the first to show if something is going off-script. It is more sensitive than the other timeframes to MM activity. And if 2H breaks the structure and holds below the zero boundary, that becomes a signal of a possible shift in direction.
⠀
And here is the key feature of this setup: the position simply flips.
⠀
Entry points remain in the same area, near the zero-line touches. Only now, it is no longer support, but resistance. A touch from below becomes a short entry using the same logic, just mirrored.
⠀
That is the advantage of working with deviations. The structure is read the same way in both directions. The approach does not change. Only the side changes.
⠀
How to Work With It
⠀
Without greed. Build the position in parts, not in one entry. Do not place stops too close to zero, because that is exactly where MM aims first.
⠀
The control point is the nearest close on the 3D chart. If it confirms holding above zero, the accumulation scenario remains the base case. If it moves below the line and holds there, we flip short using the same touches, but now from below upward. The structure can be read in both directions. That gives clarity.
⠀
TRUST is similar to HYPER: a young asset, crossing its 3D zero boundary for the first time, but not yet fully confirming it. The entry window is still comfortable.
⠀
We work both sides. Without greed. With respect for the structure.
#crypto #emama #trust
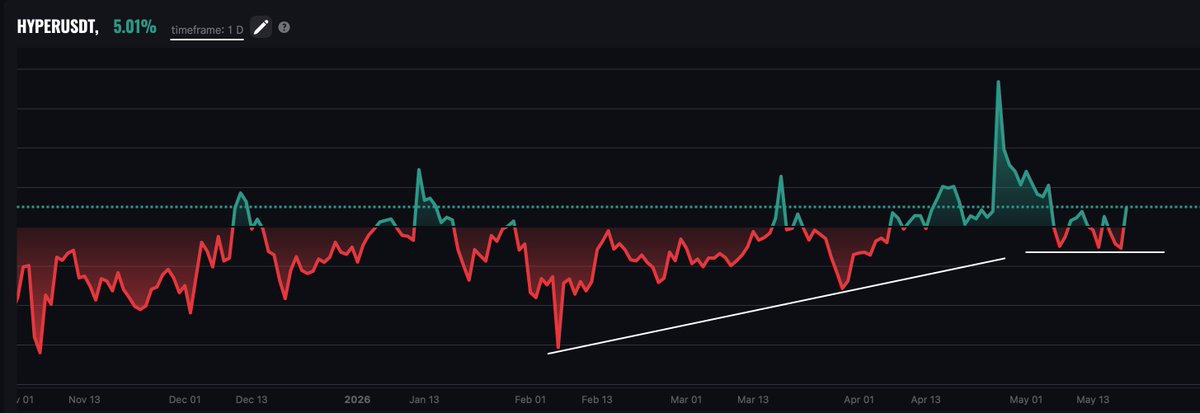
$HYPER - An Opportunity That Hasn't Been Missed Yet
⠀
In the previous post, we wrote that the market is waking up: Scalp All Market alerts have become more frequent, MM is working more actively than usual, and capital is moving. And here is the first concrete confirmation of that thesis. HYPER, the Hyperliquid exchange token, seems to be waking up too. Surprisingly on time.
⠀
The overlap with the broader market is not random. When capital starts moving more actively, the assets that have been standing in the shadows for a long time are often the ones that come alive first. This is both an opportunity and a reminder: where movement appears, volatility appears too. There is no movement without it.
⠀
Let’s break it down.
⠀
3D - Key Breakout
⠀
On the three-day chart, something happened that we have not seen since September 2025. ADP moved above the zero boundary and held there. Not a one-time spike, not a local impulse, but a real consolidation. Several touches above the line, holding the level, and returning into the green zone during attempts to move lower.
⠀
For six months, this zone worked against the asset. Every breakout attempt was rejected, and price returned below the line. Now the picture is different. And that changes the structure.
⠀
Ascending lows have been forming since winter 2026, shown by the white line below. That was the preparation. The three arrows on the chart mark the breakout itself. The exact moment.
⠀
And this is the most important part to understand. A missed opportunity is when the move has already happened. Confirmation is when the move is only beginning. Anyone looking at HYPER now and thinking “it’s too late” is reading the picture incorrectly. This is exactly the moment when the structure confirms that the asset may continue to stay in a growth phase. Before this point, there was hope. Now there is confirmation.
⠀
1D - The Nature of the Move
⠀
On the daily chart, there is a beautiful detail. Every move below the zero line is not allowed to go deep. Each retest ends around the same level, after which price returns to the green zone.
⠀
The ascending white line is the same sequence of higher lows seen on 3D, only in more detail. The horizontal white line is the level that downside moves reach, but do not go below.
⠀
This pattern usually suggests one thing: accumulation is still ongoing. MM is keeping the asset above the zero boundary, not allowing it to move deeply lower, and collecting liquidity from those who short the breakdown or place their stops too close. This is not an exit from the position. This is holding the position before the next phase.
⠀
How to Work With It
⠀
Without greed. We do not build the position in one entry. We do not place stops too close, remembering that MM collects liquidity on every retest, and some of these retests are deliberately designed to shake out cautious participants.
⠀
The opportunity is there. It makes sense to allocate part of the risk to this asset. Not all of it, exactly part of it. The structure is good, the confirmations are fresh, but the market is only waking up, which means sharp moves in both directions are more than likely ahead.
⠀
The warning signal would be 1D moving back below zero and holding below the line, followed by a break of these local lows on the chart. As long as that does not happen, the accumulation scenario remains the base case.
⠀
We work calmly. Without greed. With respect for the market.
⠀
#HYPER #CryptoTrading #Altcoins
📰 Scalp All Market is firing more often — and that means something
⠀
Over the past few days, the Scalp All Market signal has been triggering noticeably more often in our system. The same one we wrote about last time: an alert for manipulation inside a trend, when an imbalance rolls across the entire market at the same time.
⠀
When these signals start appearing more frequently, it usually points to one thing. The market is waking up.
⠀
Here’s what makes it interesting. Every signal is a market maker at work. Fresh liquidity is being collected: stops from those who moved too close, longs from those who entered emotionally, shorts from those who decided the top was already in. Everything gets swept, then comes the impulse. And then the cycle repeats.
⠀
An active harvest is happening in the market. Something is being prepared.
⠀
The market itself is acting nervous.
⠀
Bitcoin has returned to its typical sharp spikes. First a move in one direction, then a sudden move in the opposite direction, completely erasing the previous leg. This is not a trend. This is liquidity work at every local level.
⠀
Why now? There are enough possible reasons.
⠀
On May 13, Kevin Warsh was approved as the new Fed chair. On Wednesday, of course. Warsh is considered a hawk, has his own agenda, and promised “noisier” meetings. Under him, the market does not expect the base rate to fall. The setup has changed, and it is visible in the movements.
⠀
At the same time, there is the Hormuz story. The strait has effectively been closed since early March. Nobody expects full traffic to resume before August. For now, the market does not believe in the worst-case scenario and is still living on hopes of a quick resolution. Once it starts pricing in a prolonged supply shock, the consequences will be harsher.
⠀
We won’t go deep into the news background. That is not our format. But this is the context, and it explains why the character of current market movements looks exactly like this.
⠀
What matters for traders is different.
⠀
You can read all this news, or you can ignore it. You can follow Warsh, oil, and headlines. Or you can ignore them completely.
⠀
In our system, all of this is already drawn on the chart. Any nervousness in capital, any harvest, any manipulation leaves a trace in deviations. If price moved away from its average, someone pushed it there. ADP does not show why. ADP shows what. And that is enough to see entry moments.
⠀
So for us, Scalp All Market triggering more often is not news about Iran and not news about Warsh. It is a specific signal that capital is moving, the MM is working more actively than usual, and entry points are becoming more frequent.
⠀
Alert settings, same as last time:
🔹5m: ADP cross up -2%
🔹4h: ADP above +0.1%
🔹12h: ADP above +0.1%
⠀
And a group of trades in one click through Smart Order. Not one coin, but 25–50 assets with a suitable signal structure.
⠀
Previous post about Scalp All Market and Smart Order, with the mechanics explained in more detail
⠀
#bitcoin #emama #platform
⚡️Two signals fired this week.
⠀
No manual setup was taken.
That alone says a lot.
⠀
New Weekly Analytics covers:
⠀
• the math behind both signals
• bearish daily vs bullish BTC weekly
• why Thursday had no fakeouts
• what big money likely already decided
• the key levels for next week
⠀
BTC 4H tilt + daily zero line matter now.
Full breakdown 👇
https://t.co/RaFx9Y6nGx
⠀
#bitcoin #crypto #trading #EMAMA
📃New Medium article:
⠀
Crypto Deviation Alerts
⠀
• why price alerts miss the real signal
• how to track EMA extremes automatically
• monitor 500+ coins across 27 timeframes
• multi-timeframe alerts with structural logic
The market moves while you sleep.
The terminal keeps watching.
⠀
Full article: 👇
https://t.co/mqjPidmjX2
⠀
#crypto #trading #bitcoin #EMAMA #altcoins
How a boring mean reversion strategy caught the $TON +100% move
⠀
What’s in this one:
👉Why TON’s +100% was visible on the chart 18 months before Durov said anything
⠀
👉How mean reversion catches setups news traders miss every time
⠀
👉The MM playbook: how stop sweeps at the zero line signal continuation, not reversal
⠀
👉BTC is leading strength — what that tells you about where smart money sits
⠀
👉Setup of the week on bitcoin: where the entry is, and where it isn’t
#TON #EMAMA #CryptoRealtime
ethereum:0xd533a949740bb3306d119cc777fa900ba034cd52 — Back in the Game?
⠀
An asset with a complicated history. Those who have been in crypto for a long time know what this ticker has been through. After a long period of silence, for the first time in a while, the structure is pointing to a possible comeback. Let’s break it down by timeframes.
⠀
Since February, the asset has confidently stopped declining. If you only look at the 2h and 4h timeframes, it may seem like the move has already happened, the opportunity is gone, and it is too late to get involved. But the higher timeframes tell a different story.
⠀
On the 2h and 4h ADP, we are increasingly moving above the zero line. These are not isolated touches. This is systematic behavior. And this is the force that pulls the higher timeframes along with it. When the lower timeframes consistently hold the buyer’s side, the higher ones have no choice but to follow.
⠀
Mid-April: the 1D ADP moved above zero and held there. Not just crossed it, but held and started accelerating upward. This is the first confirmation that the work on the lower timeframes is moving to the next level.
⠀
And the freshest signal: a few days ago, the 3D broke through the zero boundary. The same resistance zone that had held the asset down for six months. The breakout is still holding. Promising.
⠀
Now the most important part.
⠀
If you look at the 3D, since August 2025 the asset has stopped making new lows. Every retest is higher than the previous one, with no deep sell-offs and no panic. This is a classic picture of buying from weak hands — what we call structural accumulation.
⠀
If this hypothesis is confirmed, we are not talking about a single move, but about a prolonged growth cycle. And judging by what we are seeing so far, the hypothesis is still being confirmed.
⠀
And the best part: you are not late yet.
⠀
The first confirmations have only just arrived. 1D — about a month ago. 3D — literally this week. On the 2h and 4h, it may look like the move has already gone too far. The higher timeframes say the opposite: for them, everything is just beginning.
⠀
But.
⠀
Remember the history of this ticker. This is an asset with a heavy past. Too many times it has given hope — and then taken it away. The structure looks good now, but the character of the asset demands respect.
⠀
Work carefully: watch for confirmations on the higher timeframes, do not place stops too tightly, and do not build the position all at once. Weakness on the 1D or a return of the 3D below zero is a signal to fully reassess the position.
⠀
ethereum:0xd533a949740bb3306d119cc777fa900ba034cd52 is potentially the same story, but in an early phase. The advantage of the early phase is greater upside potential. The downside is a higher risk that confirmations may fail. So stay attentive.
⠀
Want to track similar accumulation assets? https://t.co/zo5mYbZsPm
⠀⠀
Want to receive alerts when assets hold above zero? https://t.co/Qf0J1WRNXQ.
⠀
We watch. We do not rush. We remember the character.
⠀
#CRV #Crypto #EMAMA
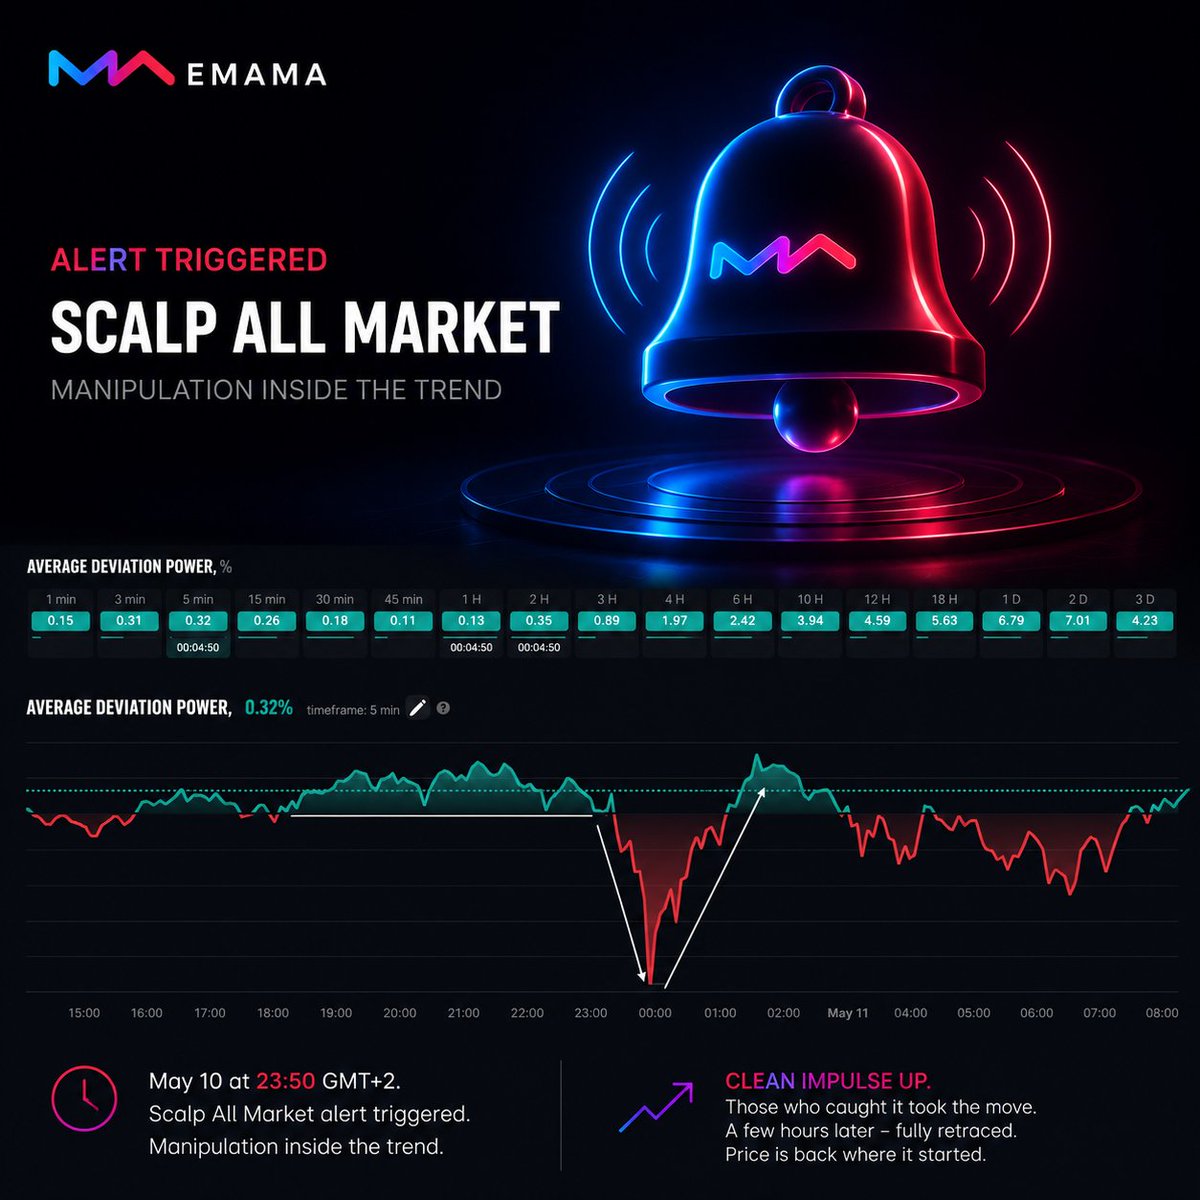
🔔 Saturday, 23:50. While everyone was resting — the alert triggered
⠀
On May 10 at 23:50 GMT+2, our Scalp All Market alert was triggered inside the system.
Signal type: manipulation inside the trend. The moment when the Market Maker sweeps liquidity and prepares the continuation of the move.
⠀
What followed was a clean impulse upward. Those who caught it took the move. Those who were away from the screen missed the opportunity. A few hours later, the entire impulse was fully retraced. Price is now back exactly where it was when the alert triggered.
⠀
The window lasted only a few hours. Saturday night. Nobody sits at the screen at that time.
That’s exactly why we didn’t miss it — because the alert did the work.
⠀
What makes this signal different from previous setups
⠀
In previous posts we analyzed isolated setups 👇
⠀
• BTC at -2% ADP
• SOL at -1.5%
• TON with a year-and-a-half structural preparation
Those were single-asset opportunities.
⠀
💬 Scalp All Market is different.
⠀
Here, the imbalance happens across most of the market simultaneously.
The Market Maker moves dozens of assets together: sweeping liquidity market-wide and then pushing the impulse across the board.
⠀
#️⃣The key detail: this happens inside the existing trend.
⠀
The direction is already established — the signal catches the exact moment when the move resumes after a stop-hunt pause.
⠀
These setups are rare.
But when they appear, it’s not one trade — it’s multiple trades at once.
⠀
How this is traded — Smart Order groups
⠀
When Scalp All Market triggers, we don’t open one position. We open groups of positions with a single click.
⠀
That’s what Smart Order is for.
⠀
The system can execute across 10, 20, 50+ assets simultaneously using structural filters:
⠀
• proper ADP conditions
• Trend Dominance confirmation
• 4H and 12H trend alignment
⠀
One click — dozens of filtered trades 🖱
⠀
Completely different mechanics compared to manual single-ticker trading.
This is not theory.
⠀
Trend manipulation alerts have already proven themselves inside the system.
⠀
Want to try the alert yourself?
⠀
Recommended setup:
• 5m: ADP cross up -2% (extreme)
• 4h: ADP above +0.1%
• 12h: ADP above +0.1%
⠀
The 5m signal gives the entry timing when manipulation ends and the move begins.
The 4h and 12h filters leave only signals aligned with the primary market trend.
⠀
We are not trading random manipulation.
We trade manipulation aligned with capital flow.
⠀
Scalp All Market is the next level:
Not one ticker — the entire market.
Not one trade — a group.
⠀
Never configured alerts before?
⠀
Want to try Smart Order?
Free access. No card required.
⠀
Stop missing high-quality entries just because you weren’t at the screen.
That problem was solved long ago.
⠀
#EMAMA #MarketScalp