This strategy combines Williams %R and EMA to identify potential trend reversals and confirm momentum. It uses overbought and oversold levels alongside price position relative to the EMA to identify long and short trading opportunities.
𝗥𝗘𝗩𝗜𝗦𝗜𝗧 𝗧𝗛𝗜𝗦 𝗙𝗥𝗘𝗘 𝗜𝗡𝗗𝗜𝗖𝗔𝗧𝗢𝗥
Fibonacci Entry Bands
This script plots Fibonacci Entry Bands, a trend-following and mean-reversion hybrid system built around dynamic volatility-adjusted bands scaled using key Fibonacci levels.
5.6k+ TradingView boosts. Add it free:
https://t.co/wPIivp3S0H
DOUBLE BOTTOM POWER MOVE .
Smart traders know the game: markets don’t just reverse , they manipulate before the breakout.
The Double Bottom Manipulation Reversal Entry is where patience meets precision.
✓ Double Bottom: Foundation of reversal strength.
✓ Manipulation: Trap liquidity, shake weak hands.
✓ Bullish Order Block: Institutional footprints guiding the move.
✓ Entry: Timing is everything, catch the surge.
✓ Support: The safety net confirming your bias.
This is not just a chart pattern, it’s a weapon for traders who want to dominate reversals and ride momentum with confidence.
🚨 BREAKING:
Former U.S. intelligence officer Josephine Guilbeau: "I watched Israel burn children alive for a year."
"You don't care about American values. You're destroying this country. You should all be ashamed."
@pamflet86652 Încearcă cu Dan Toma o lună de zile pe us30 și te convingi singur ....
Maxim pierzi 150 euro și tranzacționezi pe demo cu o suma de 1000 și întri cu 20/tranzactie !....
Daca e ok continui daca nu te oprești !
Ceilalți sunt mai mult investitori în crypto !
Succes !
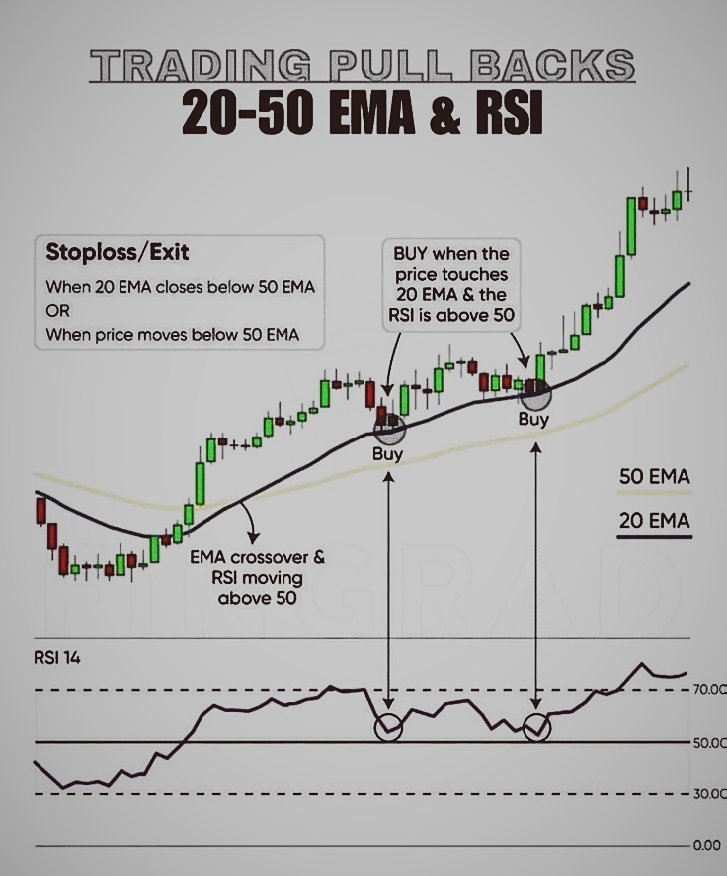
Swing Trading One Setup👇
Entry (Buy) Rules:
Wait for the 20 EMA to cross above the 50 EMA.
Ensure RSI (14) is above 50.
Buy when the price touches the 20 EMA and RSI is still above 50.
Exit (Stoploss) Rules:
Exit if the 20 EMA crosses below the 50 EMA, or
If the price drops below the 50 EMA.
This strategy helps traders catch pullbacks in an uptrend with confirmation from the RSI.
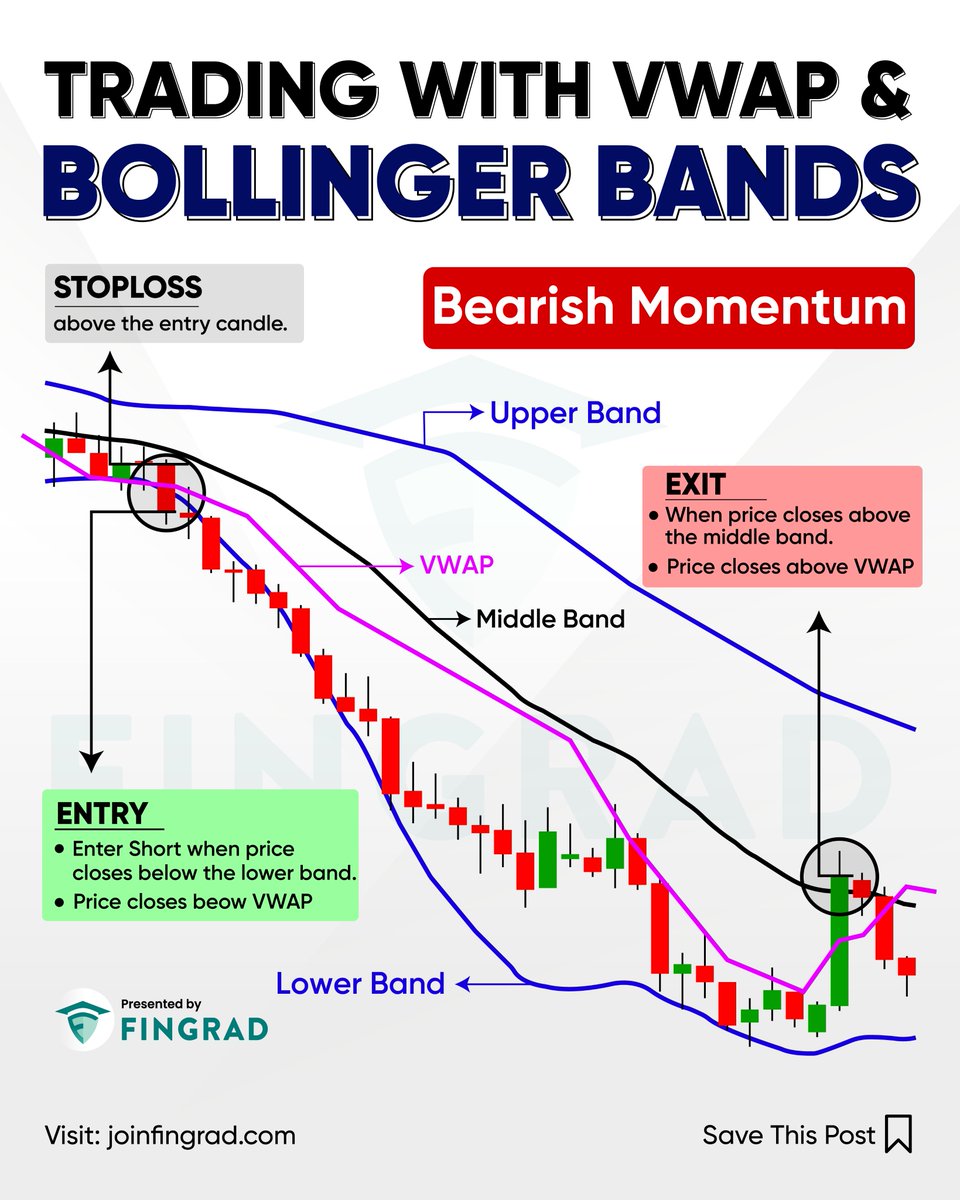
This strategy helps traders identify potential bearish momentum by combining VWAP and Bollinger Bands. It highlights periods of price weakness when the stock trades below key levels, helping traders identify possible short-selling opportunities.
One indicator tells you the trend.
Two indicators together can tell you the context. 📈
One common mistake traders make is using VWAP or Ichimoku Cloud in isolation.
A powerful way to read the market is by combining:
🟢 VWAP → Shows intraday fair value
🟢 Ichimoku Cloud → Shows trend direction & dynamic support/resistance
🟢 Volume → Confirms the strength behind the move
When price is above VWAP and the Ichimoku Cloud, the market structure becomes easier to interpret.
My framework before an intraday trade:
✅ Price above VWAP
✅ Price above the Ichimoku Cloud
✅ Cloud is supporting the trend
✅ Bullish breakout or pullback confirmation
✅ Volume expands on the move
✅ Stop-loss placed below a logical support zone
🚫 Avoid forcing trades when:
❌ Price is trapped around VWAP
❌ Cloud is flat or very thin
❌ Price keeps moving through the Cloud
❌ Breakout happens without volume confirmation
📌 Remember:
VWAP tells you where price stands relative to intraday value.
Ichimoku Cloud helps you understand the broader trend and dynamic levels.
Volume tells you whether the move has participation.
Don't trade the indicator.
Trade the confluence. 🎯
💬 Question for traders:
If you could keep only ONE on your chart, which would you choose?
1️⃣ VWAP
2️⃣ Ichimoku Cloud
3️⃣ Volume
4️⃣ I use all three
Drop your answer below. 👇
❤️ Like • 🔁 Repost • 🔖 Bookmark this for your next chart review.
Educational purposes only | Not a buy/sell advice
SEBI RA INH000025151
Follow @TradesByAnand for daily trading notes, price action education, and high-probability trading strategies.
#StockMarketIndia #Nifty50 #TechnicalAnalysis #IntradayTrading
I just created a new ICT SMT Divergence indicator for TradingView.
Improved the detection logic, new filters, timeframe identification, fully customizable!
I’m giving it away completely FREE.
Like + Comment “SMT” and I’ll send it to you!
Must be following
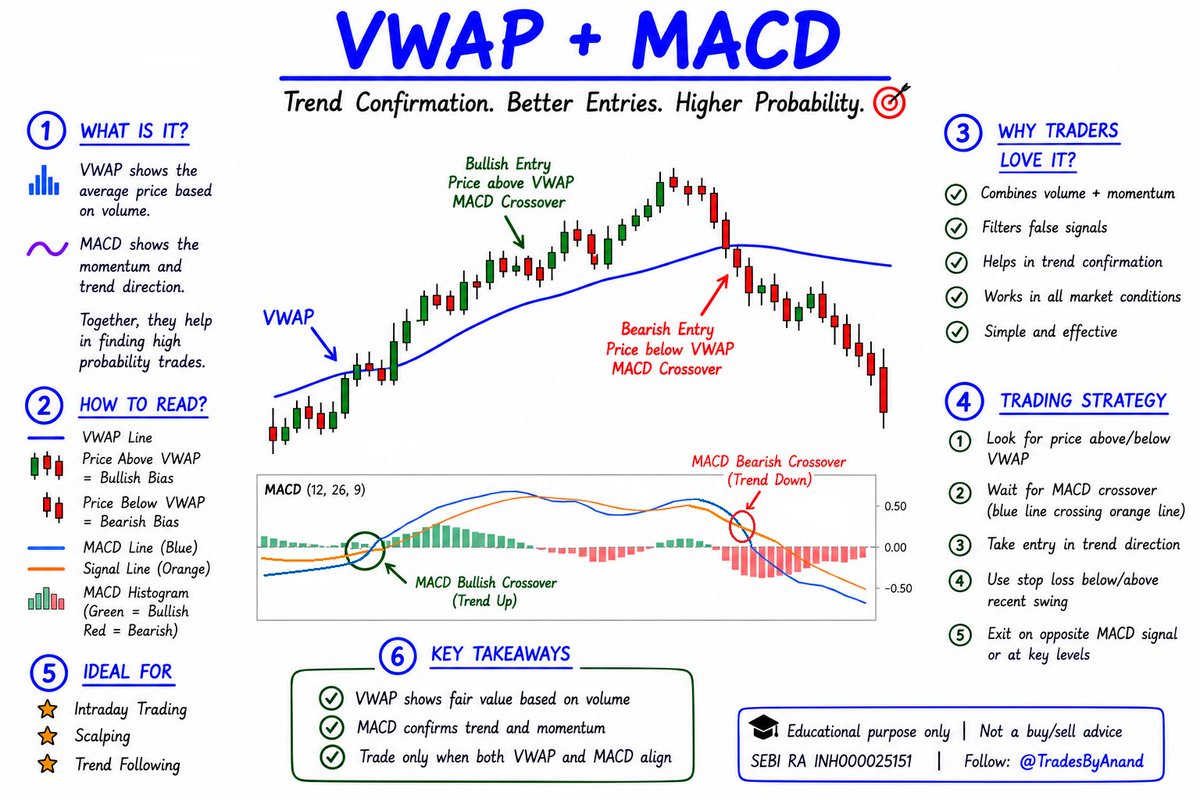
One indicator tells you where price stands.
Another tells you how momentum is moving. 📈
One common mistake traders make is using VWAP or MACD in isolation.
A more structured approach is to combine both:
🟢 VWAP → Defines the intraday price bias
🟢 MACD → Confirms momentum and trend direction
🟢 Price + Momentum → Helps filter weaker setups
My VWAP + MACD framework:
✅ Price above VWAP
✅ MACD bullish crossover
✅ MACD histogram supports upward momentum
✅ Breakout or continuation confirmed by price action
✅ Volume supports the move
✅ Entry taken in the direction of the overall bias
For bearish setups:
❌ Price below VWAP
❌ MACD bearish crossover
❌ Weakening/bearish histogram
❌ Breakdown confirmed by price action
❌ Volume supports the move
📌 Remember:
VWAP tells you where price is trading relative to the session's volume-weighted average.
MACD helps assess momentum and trend changes.
When both signals align, they can provide stronger confirmation—but no indicator guarantees a successful trade.
💬 Question for traders:
Which do you check first for intraday trading?
1️⃣ VWAP
2️⃣ MACD
3️⃣ Both together
4️⃣ Price Action
Drop your answer below. 👇
❤️ Like • 🔁 Repost • 🔖 Bookmark this for your next chart review.
Educational purposes only | Not a buy/sell advice
SEBI RA INH000025151
Follow @TradesByAnand for daily trading notes, price action education, and intraday trading strategies.
#StockMarketIndia #Nifty50 #TechnicalAnalysis #IntradayTrading
🚨 NEW VIDEO
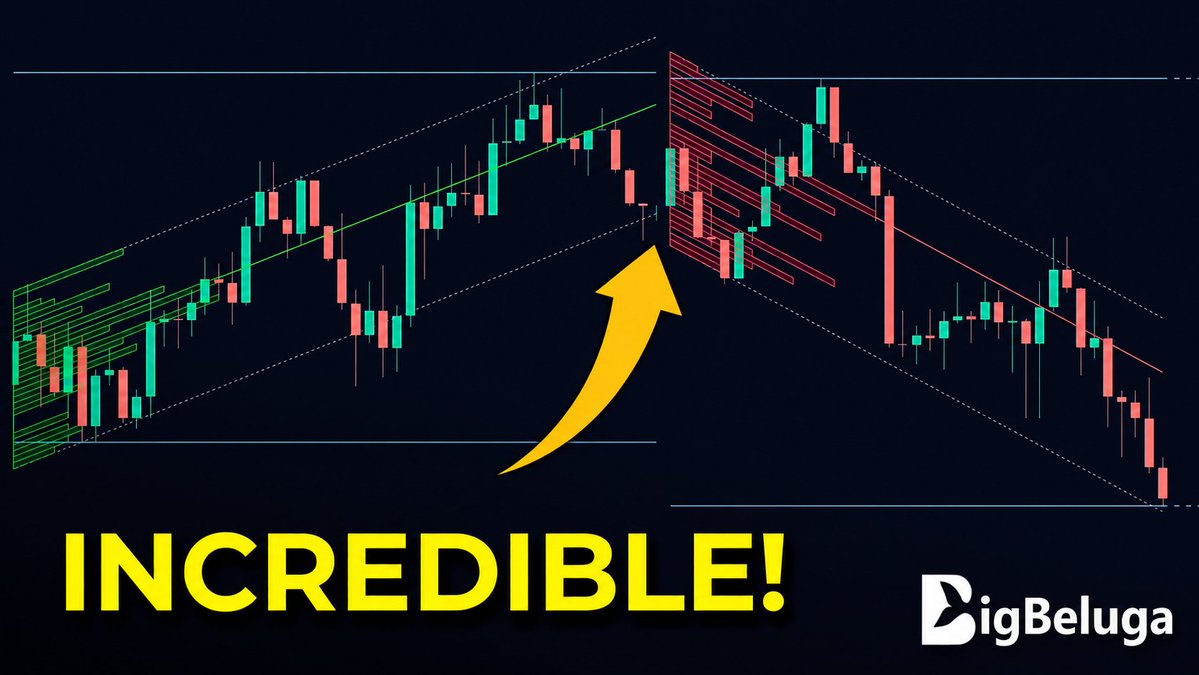
See the FREE Higher Timeframe Log Regression Volume Profile in action — dynamic channels, slanted POC, live delta & a complete trading strategy. 🐳
Watch now 👇
https://t.co/Gyjpzpecko