I’m sorry everyone but I have to be as honest as possible. $NBIS will never be a trillion dollars company. There’s literally 0% chance of that happening . Actually there is negative probability of that happening. $NBIS is running a commodity business. It has no unfair advantage. It buys GPUs and rents them out. Anybody with a little more money than them can become their competitor just by buying more GPUs and renting them out. Be careful following people like this, who have to cope because they put a lot of money in a single stock. The AI trade is over. Jensen said it himself: “there is capital scarcity”. We have to be a little more realistic going forward.
@TejKhaled@mesc101@thedamnintern@grok What else do they do? I honestly only know their neocloud business.
After every bull market there are countless companies with a unique story people fall in love with that ends up being just a story and never turns into a Profitable unique competitive advantage.
@Tylerp270 What else do they do?
What makes them unique that allows them to charge more then anyone else which results in superior margins, ROE, and ROIC?
Not in an easy share format, on the list of things to do.
But honestly it’s nothing too original. % of stocks above 5/10/21/40/50/200 and 30w, stockbee momentum, 52 week highs, with some custom ways to look at sector groups and growth vs defensive along with RS by stock groups.
For the first time in 24+ months, I’m not reviewing charts this weekend.
My trading plan for this week:
Zero buys. Zero new shorts.
I still have 2/3 of my $DRIP (inverse $XLE) position remaining. I’ll manage that, and that’s it.
I did my daily review Friday, but I see zero reason to buy anything right now. And you’d be crazy to initiate new shorts with the market this extended to the downside.
Any rally is exit liquidity. $ORCL is dead money at best (no return for 10 years) or at worst is a bankruptcy.
Look back at history. There are tons of companies “that will never go bankrupt” that went bankrupt and wiped out their shareholders.
There are 2,000 liquid stocks. Why buy one that has so much risk?
The old leaders are not necessarily going to be the new leaders.
Not a single cybersecurity stock made the list, even though cybersecurity ($BUG $HACK $IHACK) is one of the few growth groups holding up during the current bloodbath.
I’m not saying to ignore these 10 stocks. But don’t assume they’ll lead the next bull market just because they led the last one.
They need to prove themselves with relative strength.
Pay attention to where the money is going, not where it used to be.
@MPelletierCIO I’ve been watching closely. Credit market for AI will help understand how deep and how long the correction in AI stocks will be.
$AMZN closed a huge loan for its build out. If/when the big companies can no longer get loans is when we know it’s bad.
A few people were shocked when I said you should have around $1,000,000 in trading capital if you need $100,000 per year to live on.
Others asked how I came up with that number.
Here's my thinking, and the math behind it.
First, if you've proven you can consistently make 50–100% annually through an entire market cycle, you might be able to get by with less.
But be realistic about your track record.
I consider 2022–2026 a pretty good test. We had a prolonged bear market in 2022. Did you make 50% or 100% that year? Did you even make money?
2023–2025 offered some relatively easy opportunities for momentum traders. If you couldn't average 50% during those three years, you need to seriously reconsider any plan that depends on those kinds of returns.
Now, here's why I use 10% of trading capital to determine my annual salary.
#1. Eliminate the NEED to make money.
This is probably the most important part of trading full time.
The last thing you need is the pressure of having to make money to pay your bills. That's when you start forcing trades, taking mediocre setups and trading in market conditions that don't favor your strategy.
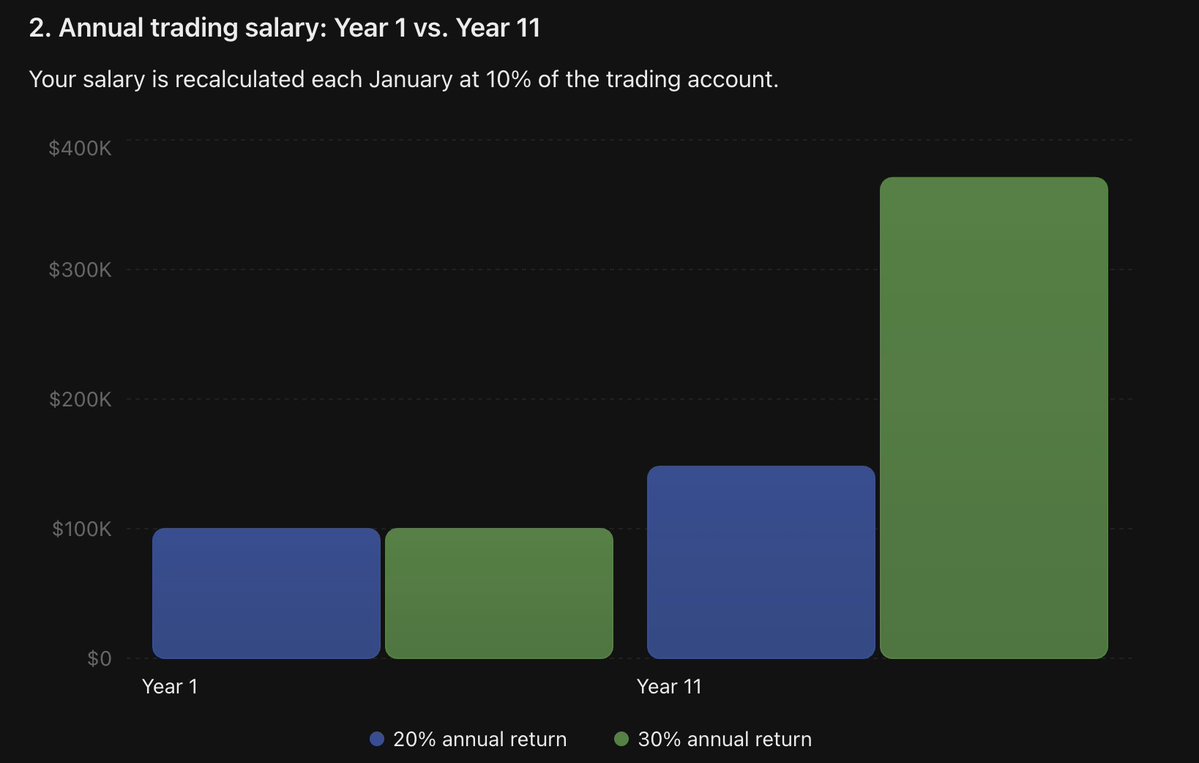
I pay myself an annual salary equal to 10% of my trading account's balance on January 1. That amount is divided into 12 automatic monthly transfers.
Every January, I recalculate my salary based on the new account balance.
#2. You don't need huge returns to grow your account AND your income.
Let's assume you start with $1,000,000. These are hypothetical numbers, not my actual finances. I don't share those publicly.
For simplicity, let's assume an annual tax expense equal to 6% of your starting account balance.
Here's how the math works over 10 years.
Scenario 1: You average 20% annually.
$1,000,000 starting balance
20% trading return = $200,000
10% salary = $100,000
6% taxes = $60,000
Your account grows 4%, or $40,000.
Doesn't sound like much, right?
But here's where compounding gets interesting.
Every year, your salary increases by 10% of your account's new balance, assuming the account grows.
After 10 years:
• Trading account: $1,480,000
• Annual salary entering year 11: $148,000
• Total salary collected over 10 years: approximately $1.2 million
And you still have almost $1.5 million to trade.
Scenario 2: You average 30% annually.
A sustained 30% annual return is exceptional performance. Most traders will never achieve it over a decade.
But let's assume you do.
30% return − 10% salary − 6% taxes = 14% annual account growth.
After 10 years:
• Trading account: $3,707,000
• Annual salary entering year 11: $371,000
• Total salary collected over 10 years: approximately $1.93 million
Your trading account has nearly quadrupled while your annual income has more than tripled.
And you've already paid yourself nearly $2 million along the way.
Of course, these are simplified projections using consistent annual returns. Real trading results aren't linear. You'll have drawdowns, losing years and years when the market gives you very little opportunity. Your actual tax burden will also vary.
That's exactly why I think starting capital matters so much.
The entire point is to build a trading business where you don't need to make 50–100% every year to support your lifestyle.
This thought process is what gave me the confidence to trade full time.
But more importantly, it's what gives me the patience to sit in cash, sometimes for weeks or months, waiting for market conditions that favor my strategy.
I don't need to trade every day. I don't need to catch every rally. And I certainly don't need to force trades in a market that's not cooperating.
That freedom is worth a hell of a lot more than most traders realize.
TRADE REVIEW - 48 small losers, 4 big winners, +7.2% from closed trades
As promised, the reviews on my tech shorts $AMD $MU $SNOW $RBRK. I'm still new to the short side, so here are the numbers and what I can do better.
Final exit: I waited for a gap down, a big washout and the $VIX above 35. Got it on Friday and covered everything.
In total: from 11 to 20 Nov I closed 54 trades in 15 stocks. 48 were losers, costing about 16R (1.8% of the account). 6 were winners, but only these 4 made the difference: 81.4R and +9.0% on the account. The other two made 0.03% and 0.04%. Net result: closed trades made +7.2% of the account.
Still open: short $COST, $WMT, $KO and $DG, all in profit for now. I'll review them when they close.
$AMD
- Setup: 5 days up, 4 gap ups, ~45% off the lows. Shorted the rejection at the resistance gap, with $QQQ and $SPY rejecting key averages.
- 8th try, 7 failed tries cost 2.7R
- Short $591.54, stop $594.08 (-0.43%)
- Size ~20% of account, kept most overnight
- Avg cover $495.46 (+16.2%)
- 37.8R (35.1R after failed tries), +3.7% on the account
- Last shares: 60.7R, +26.1%
- 8 covers over 7 trading days (12-20 Nov)
$MU
- Setup: $QQQ rejected the 21 EMA and semis sold off into the close. $MU was one of the least extended and rejected its old base support. Shorted near the high of day.
- 13th try, 12 failed tries cost 3.9R
- Short $825.33, stop $827.62 (-0.28%)
- Size ~35% of account, ~10% overnight
- Avg cover $774.87 (+6.1%)
- 22.0R (18.2R after failed tries), +2.2% on the account
- Last shares: 93.3R, +25.9%
- 10 covers over 8 trading days (11-20 Nov)
$SNOW
- Setup: short against the 21 EMA. It was moving in tandem with the cybersecurity group.
- 4th try, 3 failed tries cost 0.7R
- Short $308.38, stop $310.12 (-0.56%)
- Size ~25% of account, ~15% overnight
- Avg cover $283.74 (+8.0%)
- 14.2R (13.4R after failed tries), +2.0% on the account
- Last shares: 28.7R, +16.2%
- 10 covers over 8 trading days (11-20 Nov)
$RBRK
- Setup: cybersecurity gapped up into resistance on a weak day. $CRWD and $S stopped me out, $RBRK worked.
- 1st try
- Short $121.62, stop $123.52 (-1.56%)
- Size ~10% of account, all held overnight
- Cover $107.57 (+11.6%)
- 7.4R, +1.1% on the account
- 1 cover, 2 trading days (19-20 Nov)
What worked:
- Small losses. The 48 losers cost 1.8% of the account, and the worst one 0.11%. I move my stop to breakeven fast. So 10 of the 22 failed tries before the winners exited within 0.1% of entry. With an 11% win rate, closed trades still made +7.2%.
- Runners. The last shares made the most R: 60.7R on $AMD, 93.3R on $MU, 28.7R on $SNOW.
What I can do better: manage the winners
- Cutting before the close to reduce overnight risk makes sense. But on $MU I sold more than half on day 1, at 1-2%, to pay for the paper cuts. Those trims paid back about two thirds of them (2.5R of 3.9R). The last shares made 93R.
- Holding everything to the final cover would have made about 190R and +20%, not 81R and +9%. That is hindsight, but it is a gap of 109R. All 48 losers together cost 16R.
Note: all stops above are the high of day 1, which I use as my swing stop. My intraday entry stops were tighter. 1R is about 0.1-0.15% of the account, so the R above is conservative.
@801010athlete Sweet! I figured you had a nice setup with the coffees you post.
I had a ECM Synchronika and a Eureka Atom. Due to health I had to quit drinking coffee so sold it to my brother.
Able to drink coffee again so getting back into a new setup.
The new setup will have the Niche.
@Darwin_candle I think this could work great. Even with fewer stocks especially if you can identify themes that are going to outperform over the next few years.
I’ve thought about doing this but I am too active and there are so many great ETFs to choose from
I feel bad for the number of people on X who got wiped out this past week. And I know it can still get worse.
There are two ways to survive the market long term.
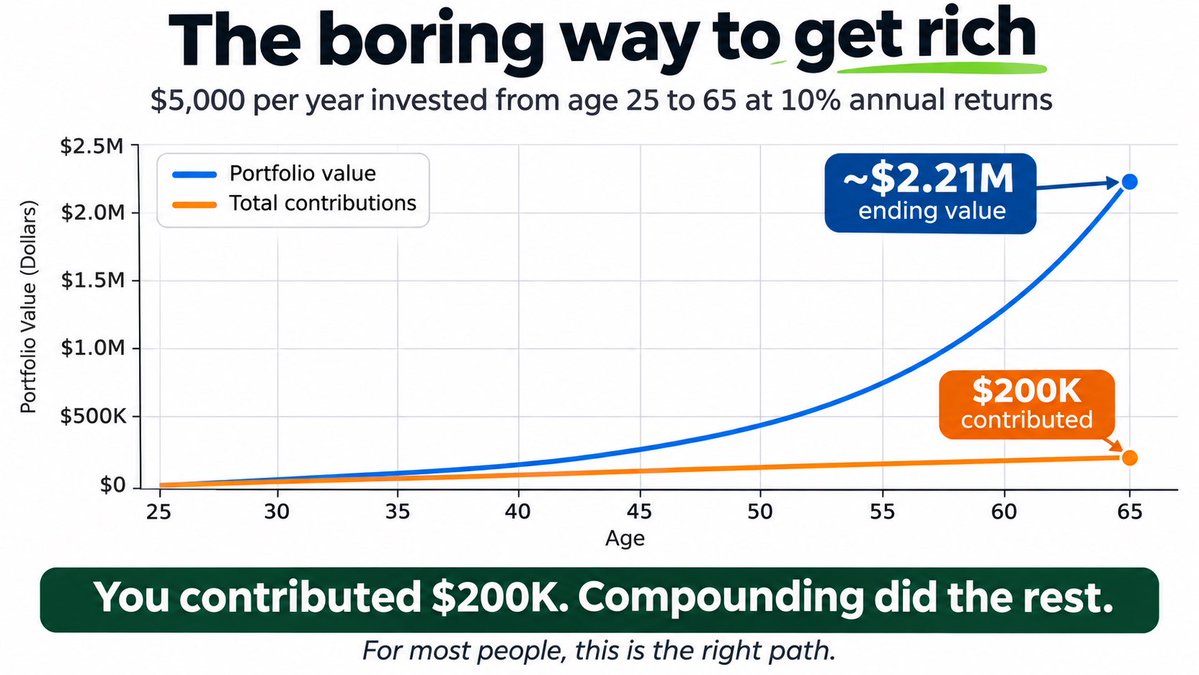
1. Buy an index fund and ignore the noise.
Invest $5,000 a year in an IRA or 401(k) tracking the $SPX, starting at age 25. At a 10% compounded annual return, you’ll have roughly $2.2 million by age 65.
You contributed just $200,000. Compounding did the rest.
I believe this is the right path for 95% of people.
2. If you’re going to trade, risk management is everything.
I’m seeing accounts on X that remind me of the Tulip Mania craze. I have no idea how many are even real.
But who cares if you turn $10,000 into $100,000 in a year if you can’t keep it?
Without strict risk management, it’s only a matter of time before the market takes back your profits.
The goal isn’t to make a fortune in one year. It’s to survive long enough to build one.
I also combine Stage 2 for the ETF with VCP / tight price action to find low risk entries. I also look at the holdings of the ETFs to confirm they aren’t getting extended.
I actually look much deeper and breakout the holdings into industry and confirm the industries are in stage 2 and are showing RS.
Try to stack as many probabilities as I can.
But honestly uptrend with tight price action or buying a pullback to multiple levels of support works very well.
New TradingView indicator. This one is pretty basic, but somehow I couldn’t find exactly what I wanted.
Custom 5 Moving Averages
• Up to 5 moving averages
• Choose EMA or SMA for each
• Different timeframe for each MA
• Designed to make higher-timeframe MAs actually usable on lower-timeframe charts
I can’t stand the jagged/step-like look of a weekly EMA on a daily chart or a daily EMA on an intraday chart.
Instead of simply carrying forward the last completed higher-timeframe MA, this calculates the developing MA using the current price.
For weekly MAs, I also added optional smoothing that blends from the prior confirmed weekly value toward the developing weekly value as the week progresses. At the weekly close, it equals the actual MA.
Simple indicator, but much cleaner charts.
https://t.co/zFwwoKGQld