#BTC
Current structure 4H
BTC is around $64,000.
Short EMAs (6, 12, 20) are almost overlapping, indicating compression and lack of clear direction.
EMA60 (~$64,400) is still above price and acts as resistance.
Bollinger bands have compressed after recent volatility, a sign that a larger movement is being prepared.
Bitcoin remains in a consolidation phase after rejecting the 64,600 resistance area. The 4H structure is still constructive as long as price holds above the 63,600–63,900 support zone.
🔹 Most likely scenario (60%): Sideways movement between 63,900 and 64,500, building momentum
ETH is currently trading inside a consolidation zone after being rejected from the $1,755 resistance level.
The structure remains bullish as long as price holds above the $1,720 support.
A breakout above $1,755 could open the path toward $1,780+ within the next 24 hours.
🚨🔥HISTORIC MOMENT! President Trump SIGNING the historic Iran peace deal at Versailles!
The Memorandum of Understanding is OFFICIAL.
No more nukes. Strait reopening.
47 getting it DONE on the world stage!🇺🇸
🚨BREAKING: Trump just announced oil prices are CRASHING into the $70.00!
Gas already hitting $1.85 in Iowa.
“We’re gonna get around those levels.”
Prices are tumbling thanks to 47!🔥
JUST IN: President Trump confirms that the Great Deal with Iran will bring peace and security to the whole world.
World’s most vital energy choke point is wide open for business, and at the same time, Iran will never have a NUCLEAR weapon.👏
🚨 BREAKING
🇺🇸 TRUMP INSIDER WITH 100% WIN RATE JUST OPENED A $24,000,000.00 $SPCX LONG AHEAD OF THE SPACEX IPO TODAY.
THIS GUY BECAME ACTIVE FOR THE FIRST TIME SINCE JANUARY AND WENT ALL-IN ONCE AGAIN.
HE DEFINITELY KNOWS SOMETHING 👀
🚨 BREAKING
🇺🇸 THE FED WILL OFFICIALLY ANNOUNCE INFLATION DATA TODAY AT 8:30 AM ET!
IF CPI < 3.8% → MARKET GOES PARABOLIC
IF CPI = 3.8%–4.1% → MARKET STAYS FLAT
IF CPI > 4.1% → MARKET DUMPS HARD
ALL EYES ON THE RELEASE!!
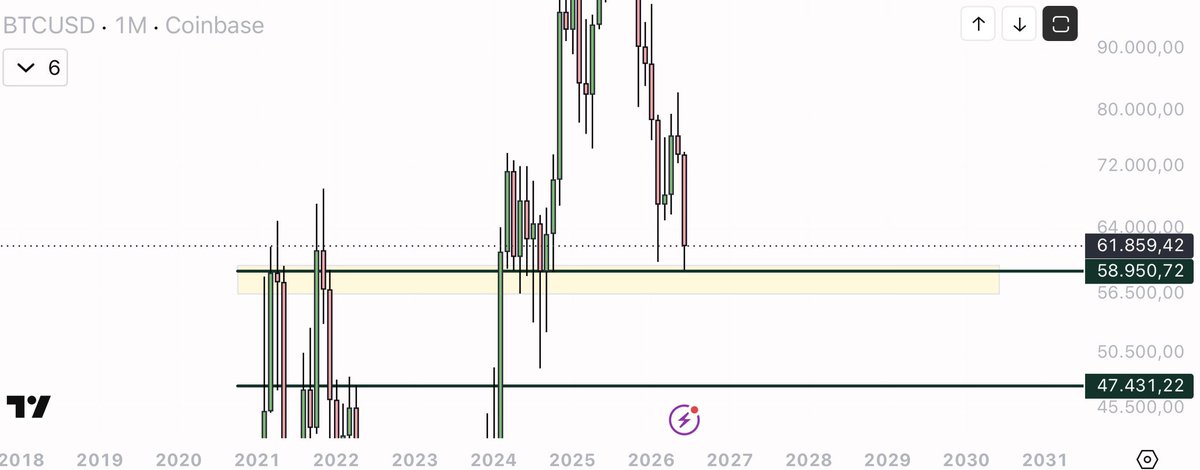
$BTC This level is not merely a support level: on the monthly chart, it represents a historical demand zone that has already held up on several occasions in the past. The same concept is also evident on the weekly chart, which is why I continue to regard it as one of the most important levels in the entire cycle.
As I indicated four days ago, it was reasonable to expect some rebounds, and indeed the market has already started to show them. As long as this area holds at the weekly close, the outlook remains positive in my view, and any weakness falls within the normal range of market volatility.
The situation would be different in the event of a clear break below the level on the weekly chart: at that point, the technical picture would become decidedly more bearish and the likelihood of a decline towards lower liquidity zones would increase.
Until then, however, I simply see a test of a massive support level. The market is deciding its next direction here.
🩸MASSIVE CRASH:
🇰🇷 South Korea's KOSPI stock market halted after 8.4% crash, triggering circuit breaker.
Absolute bloodbath as Samsung and SK Hynix lead the decline.