Such a synoptic pattern contributed to the development of a heatwave across Europe, with the UK breaking its highest May temperature record. The MTG True Colour RGB combines red, green, and blue visible channels to create realistic colours as perceived by the human eye. 2/2
True Colour RGB - 25 May, 10 UTC - MTG satellite imagery shows mostly cloud-free conditions across large parts of Europe. The absence of cloud cover is consistent with stable anticyclonic conditions and subsidence, which suppress cloud development and favour strong heating. 1/2
The Sandwich product is very good at distinguishing deep convection during the day, and it shows the cloud top features well, for example, an overshooting top in the middle in orange. The more the colour leans red, the colder the cloud top. 2/2
FCI 10 min IR Sandwich - 20 May 2026, 15 UTC - Between Finland and Russia, a cold front initiates convection in a warm and moist airmass. This convective multicell system was quite long-lived, with active convection starting at 10 UTC and lightning prevailing until nighttime. 1/2
The recording of the May weather briefing, presented by Andreas Wirth and Liliane Hofer from GeoSphere Austria, is now available online:
https://t.co/Nrieg1jLOD
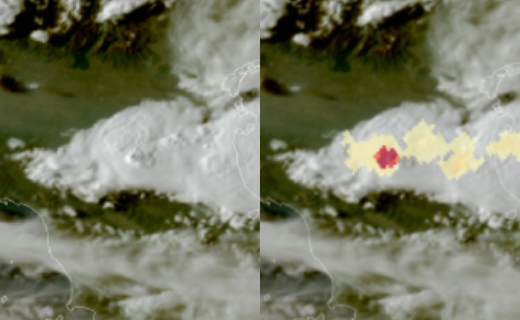
The product uses geostationary (GEO) IR images “calibrated” by precipitation measurements from MW images on Low Earth Orbit (LEO) satellites, making it useful for estimating rainfall rates at high temporal frequency. 3/3
High Rate SEVIRI WV6.2 μm and Blended SEVIRI/LEO MW Precipitation and Morphologic Information – 11 May 2026, 18:30 UTC – Over central Europe, a precipitation area associated with a cold front can be seen, with locally enhanced precipitation within the frontal cloud band. 1/3
High Rate SEVIRI WV6.2 μm focuses on the water vapour absorption band, by showing the area of high humidity with white tones. The highest precipitation amounts are visible in shades of blue in the Blended SEVIRI/LEO MW Precipitation and Morphologic Information product. 2/3
🛰️Advanced Satellite Course 2026🛰️
Deepen your specialist knowledge in satellite meteorology through a course designed for experienced forecasters in aviation and general meteorology.
Register by 26 June: https://t.co/Sdc3Zq4HLR
Invitation letter: https://t.co/BhvLDkrV7N
🔥The registrations for the Forest fire event week are open. 🔥
Save the dates between 1st and 3rd June 2026 and register here:
https://t.co/GwTKCHFyKV
Check out the agenda here:
https://t.co/TVBUjWDgpc
The low‑level circulation is exposed, with limited deep convection over the center. This structure reflects wind shear and the intrusion of drier air, which are inhibiting further organization. The Severe Storms RGB is useful for assessing convective severity and development. 3/3
Himawari Severe Storms RGB – 6 May 2026, 05:40 UTC – Tropical Storm 05W (FIVE) is located around 700 km south‑southeast of Guam and is currently moving west‑southwestward under the steering influence of a subtropical ridge to the northeast. 1/3
In the Severe Storms RGB, deep convection appears in yellow to red colors with small ice crystals present at the cloud top level. The strongest convective activity is displaced to the western side of the circulation, where the strongest wind shear is also present. 2/3
The EUMeTrain Consortium is meeting in Helsinki at FMI from 28-30 April to discuss about the past & future training materials, courses and other project activites related to satellite meteorology.
🛰️⛈️🌨️
In EUMETView, AFA shows the 5-minute flash count within the accumulated flash area by combining 10 half-minute AFA products. An overshooting top of the cumulonimbus can be seen overlapping with the area of the highest flash count, indicating the most active convective core. 2/2
GeoColour RGB and LI Accumulated Flash Area – 19 April 2026, 16:30 UTC – A severe storm is pictured over northern Italy in the GeoColour RGB product and in its composite with the LI Level 2 Accumulated Flash Area (AFA) visualisation product. 1/2
This channel is particularly useful for monitoring developing convection, dry intrusions, and environments supportive of severe weather. White to green shades represent clouds and strong convective updrafts, while yellow to red shades indicate dry air. (2/2)
GOES East 7.3 µm (colorized) – 15 April 2026, 08:50 UTC – An active thunderstorm‑conducive weather pattern is bringing a threat of severe weather to parts of the southern US. The GOES‑16 water vapor band 10, is sensitive to moisture primarily in the mid‑troposphere. (1/2)
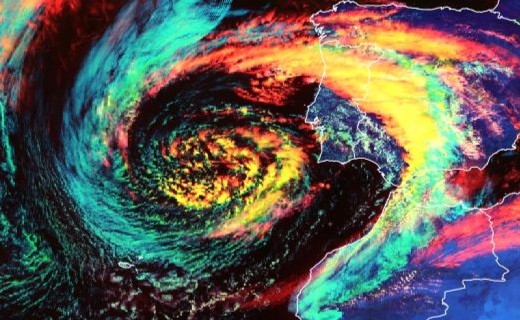
The clouds on the western side of the cyclone and over northwestern Morocco are cyan, indicating low to mid-level water clouds. Cloud Type RGB provides distinction between cloud types through its colour contrast, combining information about cloud density, height, and phase. 2/2
FCI Cloud Type RGB – 8 April 2026, 12:30 UTC – A cyclone developed over the Atlantic Ocean, southwest of the Iberian Peninsula. Around its core and over the Iberian Peninsula, thick ice clouds, shown in yellow, are visible and accompanied by thin cirrus clouds in red. 1/2