@801010athlete I'm amazed with the process you do to get into such tight risk spots, cost wise the portfolio looks great. Question: do you take profit into strength. Like MRNA, looks extended, Whats the thought process when it comes to trimming or holding?
@BlogJulianKomar I like 2 the most. Price declines on low volume after the 2nd peak. Rising volume on accumulation with a shakeout before the rise and then a nice flag before continuation. Generally what we tend to see in the market.
If you are a swing trade this is what you WANT to print out and put on your desk.
Thanks Denis for the study and @jfsrev for the referral on your substack!
Elite Trading Framework (Structural Momentum & HVE Systems)
This master blueprint outlines my execution ready trading methodology. It is engineered to capture explosive moves in high velocity growth stocks by combining supreme institutional urgency, structural price compression, and flawless mathematical risk management relying strictly on clean daily and weekly price action for entry and invalidation.
Strategy 1: The Core Structural Swing System
This strategy focuses on trading elite relative strength and structural chart compression directly against key moving averages on the daily and weekly timeframes.
Phase 1: Screening & Selection
Elite Relative Strength (RS): You target market leaders actively outperforming the broader indexes ($SPY/$QQQ). You prioritize vehicles pushing into "blue sky" all-time high territory or tightly consolidating directly under lifetime resistance, proving they are immune to market selling pressure.
True Fundamental Engines: Setups must be backed by undeniable institutional drivers, such as recent "beat and raise" earnings reports or powerful secular trends (e.g., AI data center infrastructure and next-gen semiconductor components).
Phase 2: The Setup & Volatility Compression
You never buy extended, chasing stocks away from support. You patiently wait for the near term supply to dry up and the moving averages to catch up to the price.
High Tight Flags (HTFs): High velocity moves that flag sideways, refusing to retrace deeply, proving that institutions are aggressively defending the shares.
The "Squat" Pattern: The stock "squats down" tightly into its key dynamic moving averages using the 8w eek EMA on the weekly chart as your ultimate reference point for pullbacks to determine if it is ready to move immediately or needs more time, or the 21 EMA on the daily chart.
Inside Days & Volume Dry Up (VDU): You look for tight daily candles trading entirely within the prior day's range. As the stock sits in the squat, volume must completely disappear, proving that floating supply has been completely absorbed.
Phase 3: Absolute Daily Execution & Invalidation
The Trigger: Entry is executed on a clean breakout past the immediate daily consolidation pivot level (e.g., the high of the inside day, the high of the flag, or down-trend resistance).
The Stop Loss: Your risk is pegged strictly and mathematically to the structural low of the consolidation setup typically placed right under the low of the "squat" candle, the inside day low, or the key supporting 8 week EMA. If the stock triggers the breakout but immediately reverses through this low, the squat isn't ready. You cut the trade instantly with zero hesitation.
Strategy 2: The HVE (Highest Volume Ever) Breakout Strategy
This is your specialized, ultra high conviction strategy reserved exclusively for historic corporate milestones and absolute institutional urgency.
The Setup: You scan for a stock printing its Highest Volume Ever Traded, typically accompanied by a massive, violent gap up or breakout past all time highs or out of a multi month institutional base.
The Psychology: This represents a permanent structural regime shift. Massive mutual funds and institutions are trapped in a state of extreme urgency, scrambling to build positions all at once. This historic volume signature permanently changes the character of the stock.
Execution & The First Pullback: * Day of Print Entry: Entering directly on the breakout daily candle if it clears a clean key level with a defined structural daily low stop.
The First Pullback (The High Probability Play): If the initial HVE gap is too extended to manage risk safely on a daily chart, you place the ticker on a high priority watchlist. You wait to buy the very first orderly pullback or "squat" back to a key technical level or the 8-week EMA, knowing institutions will heavily step in to defend the baseline of the highest volume day in the company's history.
System Mathematics: Asymmetric Expectancy
The ultimate engine of both strategies is pure mathematical expectancy. Because you buy right at the exact inflection point of a tight daily/weekly flag or a structural squat, your risk from entry to your daily stop loss is remarkably small (frequently only 1% to 3%).
The Reward: When a high RS leader or an HVE catalyst stock successfully clears its daily pivot and unlocks its next major momentum expansion leg, it can easily surge 10% to 15% or more in a matter of days.
The Ratio: This creates a clean 1:5 risk to reward ratio (risking $1 to make $5).
The Expectancy: Under this mathematical profile, you do not need a high win rate to compound capital rapidly. Even with a modest 25% to 30% win rate, your outsized winners will heavily multiply your small, tightly controlled losses, guaranteeing consistent, geometric account growth over a large sample size of trades.
I don't post much here but I spent years keeping a trading journal, not the kind with entry prices and stop losses, but the kind where you write things down at 2am after a bad week. Now I put it together for boom and bust traders.
Maybe it helps someone.
https://t.co/KVHRFY8j6o
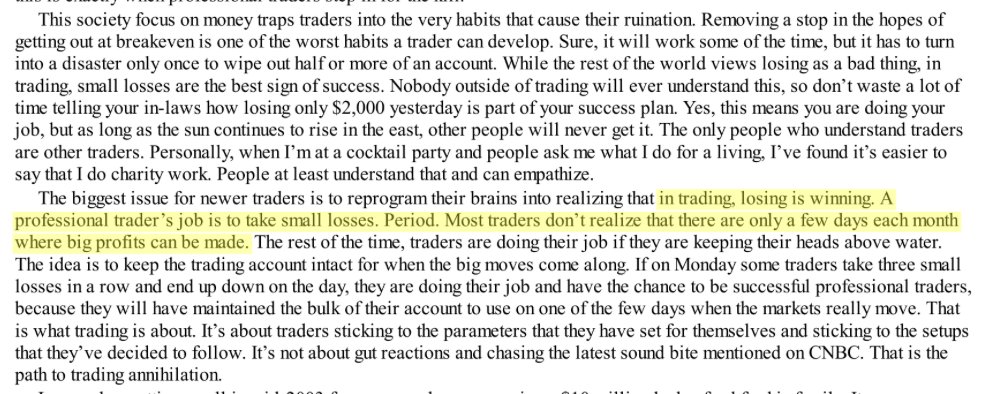
John Carter puts it bluntly in "Mastering the Trade":
"In trading, losing is winning. A professional trader's job is to take small losses. Period. Most traders don't realize that there are only a few days each month where big profits can be made."
This took me a long time to accept. I spent my first couple years chasing green days. Every morning I sat down with the goal of making money. And on the days I didn't, I felt like I'd failed.
The shift happened when I started reframing what a "good day" looked like. A good day wasn't necessarily a profitable day. A good day was one where I followed my rules, kept my losses small, and stayed in position to play the next day.
Most of the real money I've made in any given month came from 20% of the sessions. The rest of the time, I was just doing my job. Managing risk. Taking small hits. Staying ready.
Once I stopped trying to force profit on days the market wasn't offering it, my equity curve smoothed out in a way that made my emotions associated with my performance a lot more steady. The big days come and go, but more of the time I'm just focussed on doing my job.
If you find yourself repeating self-destructive behavior over and over again in the markets ie. breaking rules, pulling stops, not pre-defining risk before placing a trade, chasing entries, and not understanding why, this will help.
Its due to your belief system.
You do not believe that those things are necessary to accomplish your objectives.
You'd be right.
Because what you THINK your objective is, is almost certainly not your TRUE objective. You are deluding yourself. If your TRUE objective was to keep your drawdowns controlled, then you would ALWAYS trade with a stop loss, cap your risk per trade and always pre-define your risk. How else could you possibly achieve your goal?
If your TRUE objective is to make as MUCH money as possible right NOW then keeping your risk capped to 1% of account equity would make zero sense. Capping risk would be a hindrance, it would be impossible to achieve your objective if you did.
You get exactly what you want... and then the inevitable drawdown hits and it blows you up.
If your TRUE goal is being right. Then you should absolutely pull your stop. Because if you stop out, you are admitting that you were wrong. The only way you can be right is by pulling the stop, holding the loss and hoping it goes back in your favor.
"Everyone gets what they want out of markets." It's true. If you don't see it yet, you are likely not being honest with yourself about what you TRULY want out of markets.
I've been talking a lot about undercuts and playing reversals that way
BUT
Another concept I've been trying to implement into my trading is the opposite of an undercut to the short side
Ever notice how when you buy a breakout.. sometimes the failed breakout moves create super violent reversals?
The concept is that breakout buyers and late longs get trapped at the highs and then add to the selling pressure on the way down
In this choppy market.. every pop into the moving averages has been used as a level to sell into strength.
Using this concept you can catch some nice downside ideas and get great entries without shorting the "hole".
I call this concept the: "uppercut" or failed breakdown
It looks like this:
1. Key level of resistance
-Previous days highs
-Range highs
-key moving average overhead
2. Now price breaks above that high
A proper uppercut usually has:
-A quick break above resistance
-Often increased volume
-Sometimes long upper wick
This is institutions grabbing liquidity and traders getting trapped
3. The most important part is NOT the uppercut.
It’s the reclaim back through the level
A proper reclaim looks like:
-Strong push back below the level
-Ideally strong volume
-Seller stepping in aggressively
When the markets start to retest the moving averages and there's a ton of overhead resistance... upside Ideas don't make as much sense anymore..
So now I'm looking for those failed breakouts and moves lower