For my first post, I’m sharing a letter @NVIDIA signed on why open models matter.
AI will transform every industry, power every company, and be built by every country.
Open models strengthen safety and cybersecurity, accelerate innovation and diffusion, and enable sovereignty.
The world needs both frontier closed models and frontier open models.
https://t.co/AUKzoQ5Ikb
Today’s market setup is simple:
Red to green is on the table.
The early weakness looks more like a shakeout than a full risk-off breakdown.
What matters now:
• Can buyers defend the morning low?
• Can leaders reclaim VWAP?
• Can high-beta names stop fading and start leading?
• Can $QQQ and $SPY close near the highs?
If that happens, today becomes a momentum reset, not a damage day.
My read:
The market is trying to flush weak hands before pushing higher.
Red open.
Absorption.
Leadership reclaim.
Green close.
That is the clean bull script for today.
Follow for clean decision maps. Repost to help others.
#Markets #Stocks #Trading
$SPY $QQQ
$ETH and $BMNR may be offering the kind of long-term opportunity most people only recognize after the move is already obvious.
When price is weak, conviction gets tested.
When price is high, everyone suddenly finds confidence.
That is the market’s oldest trap.
Buying $ETH weakness near panic levels is uncomfortable.
Buying $ETH at $4,000 will feel safer.
But safer often just means more expensive.
Same logic with $BMNR.
If the long-term thesis is $ETH accumulation, institutional crypto infrastructure, staking economics and treasury leverage, then the best entries rarely come when the chart looks perfect.
They come when sentiment is ugly and the risk/reward is asymmetric.
My opinion:
This is not the place to be reckless.
But it is the place to think like a long-term allocator.
Scale slowly.
Respect risk.
Avoid leverage.
Keep dry powder.
Let volatility work for you.
The people who cannot buy fear usually end up buying confirmation.
And confirmation usually comes with a much higher price.
Follow for clean decision maps. Repost to help others.
#Ethereum #Crypto #Investing
$ETH $BMNR
$AAOI Applied Optoelectronics Inc.: Intraday read
Actionable takeaway: $AAOI is trying to reclaim momentum, but bulls need acceptance above $200-$205 to confirm the next leg higher.
Momentum
Momentum is improving after the recent pullback. The stock is trading near $198 and buyers are defending the higher range, but this is not a clean breakout yet.
Structure
The structure remains bullish overall, but choppy. $AAOI is building a wide consolidation after the huge run from the $80-$100 zone. As long as price holds above $175-$180, the larger uptrend remains intact.
RSI
RSI is around 57, above its average near 54. That is constructive, but not overheated. Momentum is healthy enough for continuation if price clears resistance.
Key levels
Support:
• $190-$195: first support. Bulls need this to hold intraday.
• $175-$180: key demand zone. Losing this would weaken the recovery.
• $155-$160: deeper support. A break below this would damage the larger structure.
Resistance:
• $200-$205: immediate reclaim zone. This is the first real test.
• $215-$220: next supply area from the recent range.
• $230-$240: major prior high zone and bigger prove-it area.
Read-through
Bull case: hold $190-$195, reclaim $205, then $215-$220 becomes the next target zone.
Invalidation: lose $175-$180 with volume, and the setup turns back into range weakness.
My opinion
$AAOI looks constructive, but not fully confirmed yet. I like the setup above $190. I like it much more above $205. Below $180, patience is better because the chart could need a deeper reset.
Follow for clean decision maps. Repost to help others.
#AI #Optical #Stocks
$AAOI
ethereum:native Ethereum: Technical read
Actionable takeaway: $ETH is in breakdown mode. RSI is extremely oversold, so a relief bounce is possible, but bulls need a reclaim of $1,700-$1,750 before the chart improves.
Price action
$ETH has broken below the prior $1,800-$2,000 range and is now trading near $1,580. The structure is clearly bearish: lower highs, lower lows, and no confirmed demand yet.
Key levels
Support:
• $1,500-$1,550: first support. Psychological zone where buyers may attempt a reaction.
• $1,350-$1,400: deeper demand zone if selling continues.
• $1,150-$1,250: capitulation support if the breakdown accelerates.
Resistance:
• $1,700-$1,750: immediate reclaim zone. Bulls need this first.
• $1,900-$2,000: former support, now likely supply.
• $2,250-$2,400: major resistance from the prior range.
RSI
RSI is around 13, deeply oversold. That increases the probability of a sharp relief bounce, but oversold alone is not a buy signal. It only says the move is stretched.
What the tape is saying
Sellers are fully in control. The chart needs either a capitulation low or a strong reclaim above $1,700-$1,750 to stop the downside momentum.
My estimate / opinion
I would not chase shorts here because RSI is extremely stretched. But I also would not call this bullish yet. A bounce into $1,700-$1,750 can happen fast, but the real trend repair only starts above that zone. Below $1,500, downside risk opens toward $1,350-$1,400.
Follow for clean decision maps. Repost to help others.
#Ethereum #Crypto #Markets
$ETH
$AVGO Broadcom earnings call was strong on fundamentals, but the stock is down over 10% after hours because expectations were even stronger.
This was not a bad call.
It was a “great numbers, very high bar” reaction.
Key points from the call:
• Q2 revenue hit a record $22.2B, up 48% YoY
• AI semiconductor revenue hit $10.8B, up 143% YoY
• AI networking was almost 40% of Q2 AI revenue
• AI semiconductor bookings were over $30B in the quarter
• Q3 AI semiconductor revenue is guided to $16B, up over 200% YoY
• FY2026 AI semiconductor revenue guidance is now $56B, up around 180% YoY
• Management reiterated AI semiconductor revenue above $100B in FY2027
• Adjusted EBITDA margin was 69%
• Free cash flow hit $10.3B
• Broadcom says AI visibility now extends into 2028
The bullish part:
Demand is clearly not slowing.
Hock Tan said demand for XPUs and networking is “insatiable.” Broadcom is seeing massive AI bookings, multi-GW customer commitments, and growing visibility from Google, Anthropic, OpenAI, Meta and two other core customers.
This confirms that $AVGO is becoming a core supplier of custom AI accelerators and AI networking.
But here is why the stock is falling:
Expectations were extremely high
The stock had already priced in a monster AI update. When a stock is crowded and loved, even strong numbers may not be enough.
Gross margin guide disappointed
Q3 gross margin is expected to fall to around 74% as AI semiconductor revenue becomes a bigger share of total revenue.
Management said this is mix-driven, not structural, but the market is reacting to the margin compression.
AI is lower margin than software
Infrastructure software has very high gross margin. As AI semiconductors become a larger percentage of revenue, consolidated gross margin gets diluted.
That does not mean the business is weaker.
It means the revenue mix is changing.
Networking share may normalize
AI networking was almost 40% of AI revenue in Q2, but management suggested a more normal long-term mix could be closer to 30%.
That may have cooled some of the upside excitement around networking margins.
The market wanted more precision on 2027
Management reiterated more than $100B AI semiconductor revenue in FY2027, but did not dramatically raise the number.
After a big run, investors often want guidance to move from “strong” to “shockingly strong.”
My opinion:
This selloff looks more like expectation reset than thesis damage.
The business update was excellent.
Record revenue.
Huge AI bookings.
Massive free cash flow.
Strong operating leverage.
AI visibility into 2028.
More than $100B AI revenue target for FY2027 still intact.
The real issue is valuation.
$AVGO is no longer being judged like a normal semiconductor company.
It is being judged like an AI infrastructure winner.
That means the market punishes anything that looks like margin compression, mix pressure or guidance that is not aggressive enough.
Final read:
The call strengthened the long-term AI thesis.
The after-hours drop reflects positioning, valuation and margin sensitivity.
For long-term investors, the key question is not whether AI demand is real.
It clearly is.
The key question is whether Broadcom can convert that demand into durable earnings growth while managing mix-driven margin pressure.
$AVGO remains one of the cleanest non-$NVDA AI infrastructure winners.
But after a huge run, even great companies need resets.
Follow for clean decision maps. Repost to help others.
#AI #Semiconductors #Stocks
$AVGO $NVDA
$AVGO Broadcom Q2 FY2026 results were extremely strong.
This was not just another AI beat.
This was Broadcom proving that custom AI accelerators and AI networking are becoming a massive second pillar of the AI infrastructure buildout.
Key points:
• Revenue hit a record $22.2B, up 48% YoY
• Semiconductor Solutions revenue reached $15.0B, up 79% YoY
• Infrastructure Software revenue reached $7.2B, up 9% YoY
• AI semiconductor revenue hit $10.8B, up 143% YoY
• Adjusted EBITDA reached $15.2B, or 69% of revenue
• Free cash flow was $10.3B, or 46% of revenue
• Non-GAAP EPS was $2.44, up 54% YoY
• Cash ended the quarter at $19.6B
• Quarterly dividend was set at $0.65 per share
• Q3 revenue guidance is approximately $29.4B, up 84% YoY
• Q3 AI semiconductor revenue is expected to reach $16.0B, up more than 200% YoY
The most important number is the AI semiconductor guide.
$16B in expected AI semiconductor revenue next quarter is a huge signal.
Broadcom is not just participating in AI.
It is becoming one of the core infrastructure suppliers behind custom AI chips and AI networking.
That matters because the AI buildout is no longer only about GPUs.
It is also about:
Custom accelerators.
Networking.
Interconnects.
Scale-out architecture.
Power efficiency.
Hyperscaler-specific silicon.
That is exactly where $AVGO is positioned.
My opinion:
This was a very strong quarter.
The combination of 48% revenue growth, 69% adjusted EBITDA margin, $10B+ free cash flow and accelerating AI semiconductor demand is elite.
$AVGO is starting to look like one of the cleanest non-$NVDA AI infrastructure winners.
The risk is valuation and expectations.
The stock now has to support a very high bar. AI demand needs to keep scaling, custom silicon programs need to stay strong, and hyperscaler concentration remains something to watch.
But the results were clear:
Broadcom is not a side bet on AI.
It is becoming a major AI infrastructure platform.
Final read:
$AVGO remains expensive, but execution is outstanding.
Strong revenue growth.
Massive free cash flow.
AI acceleration.
High-margin operating model.
This is a quality compounder with real AI leverage.
Follow for clean decision maps. Repost to help others.
#AI #Semiconductors #Stocks
$AVGO $NVDA
$EOSE Eos Energy Enterprises Inc.: Technical read
Actionable takeaway: $EOSE is pushing back into the $9.40-$10.00 breakout zone. Bulls need acceptance above $9.50 to confirm continuation.
Price action
The stock has rebuilt well from the $6.80-$7.00 pullback zone and is now trading near $9.42. This is constructive momentum, but price is approaching the same area where sellers rejected the last spike.
Key levels
Support:
• $8.80-$9.00: first support. Holding this keeps the breakout attempt alive.
• $7.80-$8.10: prior reclaim zone. A pullback here would still be constructive.
• $6.80-$7.00: deeper demand zone. Losing this would weaken the recovery structure.
Resistance:
• $9.50-$10.00: major prove-it zone. This is where bulls need a clean breakout.
• $10.80-$11.20: next supply zone if momentum expands.
• $12.00-$12.50: larger resistance from the prior breakdown area.
RSI
RSI is around 64, above its average near 58. Momentum is improving and not fully overheated yet. A push above 70 would confirm strength but also raise chase risk.
What the tape is saying
Buyers are regaining control, but the stock is now at a decision point. Above $10, the chart gets much cleaner. Below $8.80, this can turn into another failed breakout attempt.
My estimate / opinion
$EOSE looks constructive. I like the setup above $8.80, but the real confirmation is a clean move through $10. Above that, $10.80-$11.20 becomes the next logical target zone.
Follow for clean decision maps. Repost to help others.
#EnergyStorage #CleanEnergy #Stocks
$EOSE
The Blue Origin New Glenn explosion matters for space stocks, but not equally.
$ASTS and $RKLB sold off because the whole space trade was already crowded, extended and pricing in a lot of good news.
This is the real read:
For $ASTS, the impact is medium-term indirect.
The direct-to-device thesis is not broken.
The technology, MNO partnerships, FCC progress, satellite performance and commercial roadmap are still the core story.
But launch cadence matters.
If Blue Origin delays reduce available heavy-lift capacity, then the market will price more risk into ASTS’ future deployment schedule, especially because the company needs consistent satellite launches to reach network scale.
So for $ASTS:
Not thesis-breaking.
Not irrelevant either.
It increases the market’s focus on launch redundancy and execution timing.
For $RKLB, the impact is much more sentiment-driven.
Rocket Lab is not Blue Origin.
Its own execution story is Electron cadence, Neutron progress, space systems growth, defense demand and vertical integration.
A Blue Origin failure does not directly damage Rocket Lab’s business.
If anything, it reminds the market that launch is hard, reliability is valuable and proven execution deserves a premium.
But after a major run, $RKLB was vulnerable to any sector-wide de-risking event.
My opinion:
This news is a short-term reset for the space trade, not a long-term thesis killer.
The biggest damage is to sentiment, not fundamentals.
$ASTS has more real exposure because satellite deployment cadence is central to the story.
$RKLB has less direct exposure, but still trades with the space basket when risk comes off.
Final read:
For $ASTS, watch launch schedule clarity.
For $RKLB, watch whether buyers defend the breakout structure.
The market is not saying space is dead.
It is saying crowded momentum trades need discipline when execution risk shows up.
Follow for clean decision maps. Repost to help others.
#Space #Aerospace #Stocks
$ASTS $RKLB
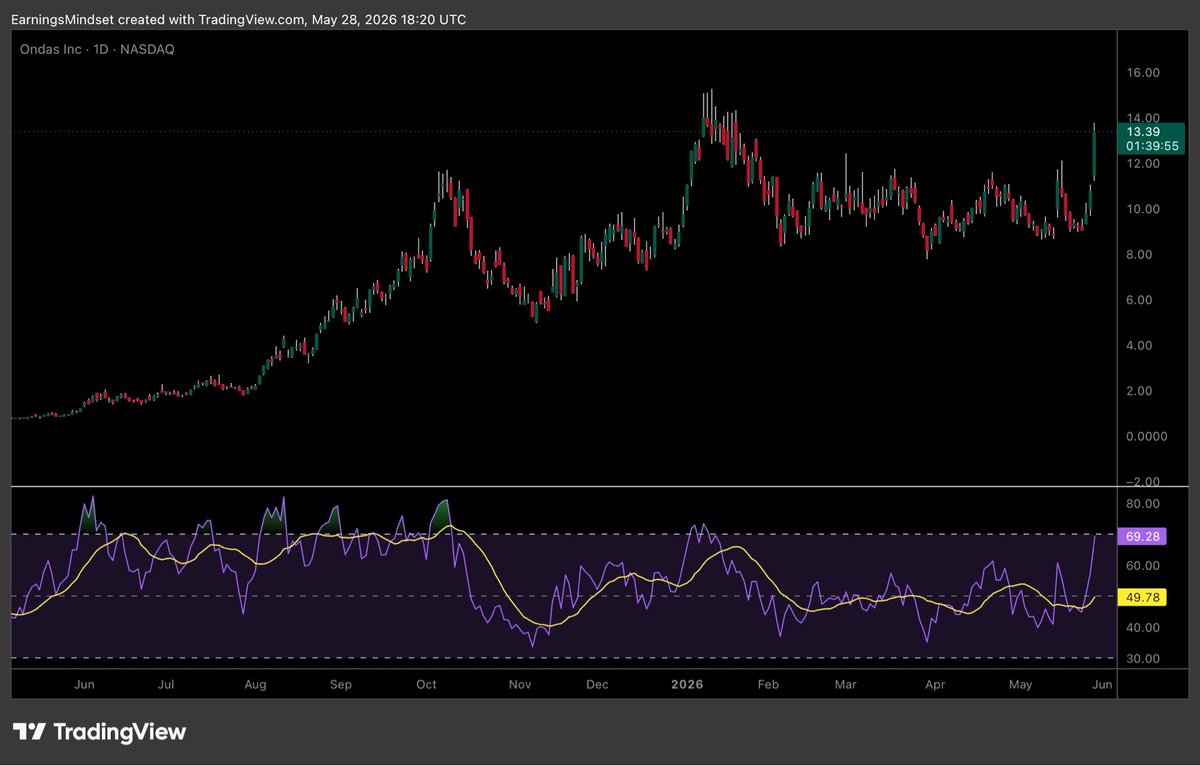
$ONDS Ondas Inc.: Intraday read
Actionable takeaway: $ONDS is breaking out of its recent range, but the clean test is whether buyers can hold $12.80-$13.00 after the spike.
Momentum
Momentum has shifted strongly bullish. The stock pushed from the $10-$11 zone into $13.39, and RSI jumped near 69. This confirms strong buyer control, but the move is now close to short-term hot territory.
Structure
The chart moved out of the recent sideways range around $9-$11.50. This is a real breakout attempt, not just a weak bounce. The next test is whether price can build acceptance above $13 instead of giving the candle back.
RSI
RSI is around 69, while the average is near 50. That is a strong momentum expansion. Not bearish, but chasing risk is higher now.
Key levels
Support:
• $12.80-$13.00: first support. Holding this keeps the breakout alive.
• $11.70-$12.00: prior breakout zone. A pullback here would still be constructive.
• $10.80-$11.20: deeper support. Losing this would weaken the new setup.
Resistance:
• $13.80-$14.20: immediate resistance and first profit-taking zone.
• $15.00-$15.50: major prior high zone.
• $16.00: psychological extension level if momentum expands.
Read-through
Bull case: hold $13 and push through $14, then $15-$15.50 becomes the next target zone.
Invalidation: lose $12 with volume, and the breakout risks turning into a failed range expansion.
My opinion
$ONDS looks very constructive here. The breakout is strong, but not a low-risk chase after this vertical candle. I like it above $13. I like it much more if it consolidates and holds $12.80-$13.00. Below $12, patience is better.
Follow for clean decision maps. Repost to help others.
#Defense #Robotics #Stocks
$ONDS
$EOSE just got another important Frontier Power USA read-through.
FPUSA and Stella Energy Solutions announced a strategic framework across a 2+ GWh late-stage storage pipeline.
This matters because FPUSA intends to evaluate and potentially convert eligible Stella projects onto its long-duration energy storage platform using Eos Z3 battery systems.
The key points:
• Stella has a 2+ GWh late-stage BESS development pipeline
• The pipeline is focused on high-growth U.S. markets, anchored by ERCOT
• FPUSA would receive exclusive evaluation rights on eligible projects
• Stella is expected to act as a designated execution partner
• Conversions would count toward FPUSA’s existing 2 GWh capacity reservation with $EOSE
• FPUSA plans to pair Eos Z3 systems with Technology Performance Insurance arranged with Ariel Green
• FPUSA would fund 100% of construction equity for eligible conversions after full equity capitalization
Why it matters for $EOSE:
This is not just another pipeline headline.
It is about the Frontier model starting to take shape.
The biggest problem for long-duration storage is not demand.
It is bankability.
Projects need technology, execution partners, insurance, capital and construction equity before they become real deployments.
This framework adds another piece to that puzzle.
For $EOSE, the positive read-through is clear:
FPUSA is actively building a project conversion engine around Eos technology.
If Stella’s pipeline starts flowing onto the FPUSA platform, the Eos 2 GWh reservation becomes more credible as a deployment path, not just a theoretical agreement.
My opinion:
This is bullish for the $EOSE thesis, but it is not full confirmation yet.
The framework still needs definitive agreements. FPUSA still needs full equity capitalization. Projects still need to convert, finance and execute.
But strategically, this is exactly what Eos needs to see.
Less “huge pipeline someday.”
More “specific projects, specific execution partner, specific financing structure, specific Eos capacity access.”
Final read:
$EOSE remains high risk, but this strengthens the bull case.
The Frontier platform is becoming more real.
If FPUSA can convert late-stage pipelines into financed long-duration storage projects, Eos moves closer to proving that its technology can scale commercially.
Follow for clean decision maps. Repost to help others.
#EnergyStorage #CleanEnergy #Stocks
$EOSE
$NBIS Nebius Group N.V.: Technical read
Actionable takeaway: $NBIS is breaking into price discovery after the Leopold 5.6% stake news, but the clean test is whether $225-$230 holds after the after-hours spike.
Price action
Regular session closed near $208, but after hours the stock is trading around $239, up almost 15%. That changes the setup from consolidation to breakout attempt. The move confirms strong sponsorship demand, but it is also a fast vertical expansion.
Key levels
Support:
• $225-$230: first support. Holding this would show buyers are accepting the after-hours breakout.
• $208-$212: prior close/reclaim zone. A pullback here would still keep the larger trend intact.
• $195-$200: deeper support. Losing this would turn the move into a failed breakout risk.
Resistance:
• $239-$240: immediate breakout zone. Bulls want acceptance above this.
• $250-$260: next psychological extension zone.
• $280-$300: larger momentum extension if the sponsorship trade keeps expanding.
RSI
RSI was around 60 before the after-hours move, so momentum was healthy, not overheated. The spike toward $239 will likely push momentum closer to hot territory. Strong, but chase risk is higher now.
What the tape is saying
The market is treating the Leopold stake as validation for the AI infrastructure thesis. This is not just a technical move. It is sponsorship + credibility being priced in.
My estimate / opinion
Very bullish signal for $NBIS, but after a 15% after-hours move I would not chase blindly. The best confirmation is a hold above $225-$230. Above $240, the stock can squeeze toward $250-$260. Below $225, I would expect a reset before the next attempt.
Follow for clean decision maps. Repost to help others.
#AI #Cloud #Stocks
$NBIS
$CIFR Cipher Digital Inc.: Technical read
Actionable takeaway: $CIFR is pressing into a major breakout zone. The clean signal is whether buyers can clear $25.50-$26.00 and hold $23-$24 as support.
Price action
The stock has rallied sharply from the $16-$18 base and is now trading near $25.16, right at the prior high zone. This is strong momentum, but also a key resistance test.
Key levels
Support:
• $23-$24: first support. Holding this keeps the breakout attempt alive.
• $21-$22: prior consolidation zone. A pullback here would still be constructive.
• $18-$19: deeper demand zone. Losing this would weaken the current trend.
Resistance:
• $25.50-$26.00: major prove-it zone and prior high area.
• $27-$28: next extension zone if buyers clear the breakout.
• $30: psychological upside level if momentum expands.
RSI
RSI is around 69, with the average near 59. Momentum is strong, but the stock is close to overbought territory. Strong tape, but not a low-risk chase.
What the tape is saying
Buyers are clearly in control, but this is the first real test of prior supply. A clean move above $26 would confirm breakout strength. A rejection here could send the stock back toward $23-$24.
My estimate / opinion
$CIFR looks very constructive, but extended near resistance. I like the chart above $23. Above $26, the setup opens toward $27-$28. Below $23, I would expect a reset before the next attempt.
Follow for clean decision maps. Repost to help others.
#AI #Infrastructure #Stocks
$CIFR
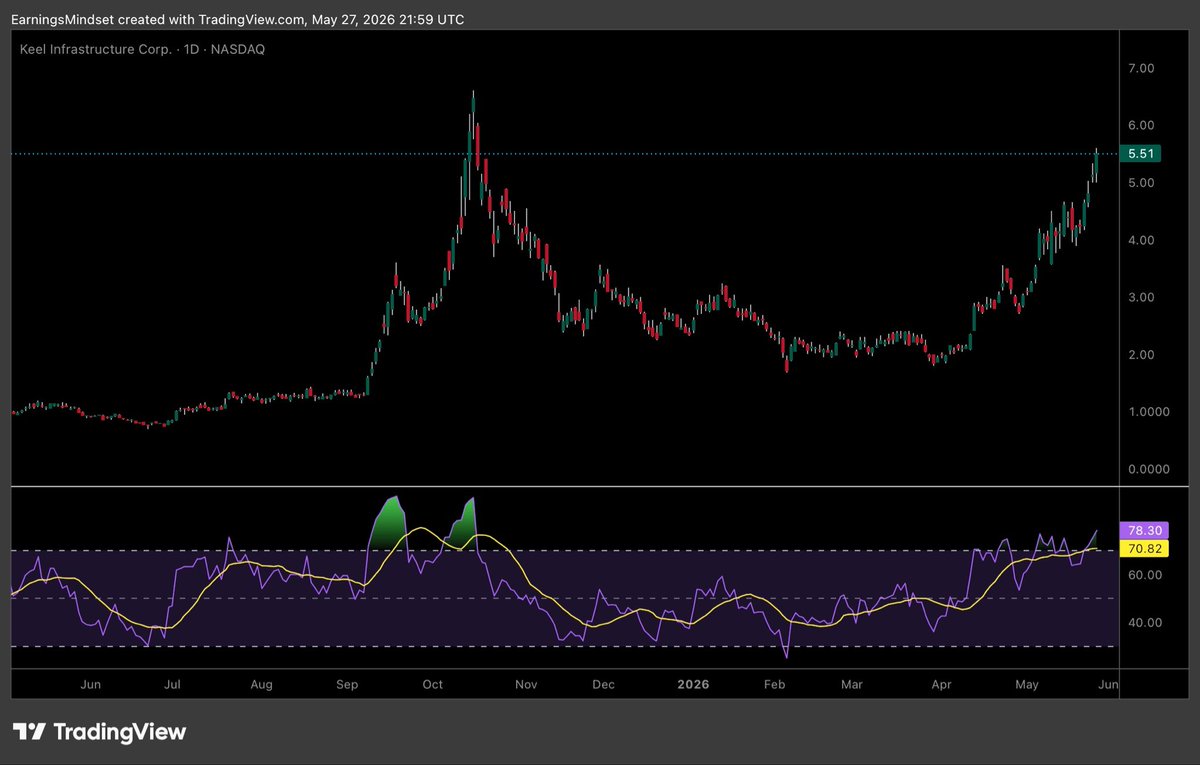
$KEEL Keel Infrastructure Corp.: Technical read
Actionable takeaway: $KEEL is in a strong momentum breakout, but RSI is hot. The clean test is whether buyers can hold $5.20-$5.50 after the spike.
Price action
The stock has been grinding higher from the $2.00 base and is now pressing into the $5.50 area. This is a major momentum expansion, not a weak bounce. The issue is that price is now close to the prior blow-off supply zone.
Key levels
Support:
• $5.20-$5.50: first support. Holding this shows buyers are accepting the breakout.
• $4.50-$4.70: prior breakout zone. A pullback here would still be constructive.
• $3.80-$4.10: deeper support. Losing this would damage the trend.
Resistance:
• $5.80-$6.00: immediate resistance and first profit-taking zone.
• $6.40-$6.60: major prior peak zone.
• $7.00: psychological extension level if momentum keeps expanding .
RSI
RSI is around 78, with the average near 71. Momentum is very strong, but the stock is clearly extended short term. Overbought does not mean bearish, but it does mean chasing risk is high.
What the tape is saying
Buyers are fully in control, but the move needs a reset or consolidation. If $KEEL holds $5.20-$5.50, the breakout remains strong. If it rejects near $6 and loses $5.20, a pullback toward $4.50-$4.70 becomes likely.
My estimate / opinion
Very bullish structure, but extended. I would not chase aggressively into this candle. Best setup is either consolidation above $5.20 or a controlled pullback into support. Above $6.00, the chart can test $6.40-$6.60.
Follow for clean decision maps. Repost to help others.
#Infrastructure #Momentum #Stocks
$KEEL
$IREN IREN Limited: Technical read
Actionable takeaway: $IREN is pressing into a major reclaim zone. The clean signal is whether buyers can hold $65-$68 and push through $70.
Price action
The stock has bounced sharply from the $48-$50 area and is now trading near $67.84. This is a strong momentum recovery, but price is now testing the same zone where prior rallies started to fail.
Key levels
Support:
• $65-$68: first support. Holding this shows buyers are accepting the breakout attempt.
• $60-$62: prior reclaim zone. A pullback here would still be constructive.
• $52-$55: deeper support. Losing this would damage the recovery structure.
Resistance:
• $70-$72: immediate resistance and key breakout test.
• $76-$78: major prior high zone.
• $85-$90: extension zone if momentum expands.
RSI
RSI is around 66, above its average near 58. Momentum is clearly improving, but the stock is getting close to short-term hot territory.
What the tape is saying
Buyers are back in control, but confirmation needs a clean move above $70. If $IREN holds $65-$68, the chart stays constructive. If it rejects under $70 and loses $65, a reset toward $60-$62 becomes likely.
My estimate / opinion
$IREN looks bullish again, but I would not chase aggressively into the first major resistance. The best setup is either a clean breakout above $70 or a controlled pullback that holds $65.
Follow for clean decision maps. Repost to help others.
#AI #Infrastructure #Stocks
$IREN
Strong signal for $NBIS.
Leopold owning 5.6% is not just a headline. It adds credibility to the AI infrastructure thesis, especially with the stock already up over 9% after hours.
The market is treating this as sponsorship + validation.
Still, valuation discipline matters after a move like this.