Data analysis is no longer a regime for data science professionals only. Non-technical managers and business owners can now make sense of their data effortlessly. Watch to learn more.
#aidataanalysis#dataanalysis
Insurance data shouldn’t slow healthcare decisions down. Watch how EasyAIBridge analyzes health insurance charges data to reveal pricing drivers, high-risk segments, and cost patterns — all guided by human-led AI for clarity and control. Built for healthcare analysts who need insight, not complexity.
https://t.co/CugI0C4F2w
This dataset contained airport names, ICAO, IATA, country, and scores information. The EasyAIBridge can analyze other data about flight operations, management datasets, and airlines finances and supply chain data easily. See this report, where the DASHBOARD prompt was utilized to create an analysis dashboard with visualizations and narrative summary. You can change the prompt and ask more questions related to your data. The system will help you think, validate, and lead with confidence.
https://t.co/Eyy36MTLCO
Extract, filter, and export email marketing leads instantly using AI. In this short demo, see how EasyAIBridge helps email marketers organize lead data with simple prompts — no formulas, no manual cleanup, and no technical skills required.
https://t.co/BMh7ebypEQ
You have to see Looker Studio training and tutorial videos to analyze data, ask questions, and create meaningful dashboards that not only visualize what's obvious but also empower you with key insights that everyone in your team needs. All of this takes time. And, for the new data scientists and non-technical managers and executives this learning is scary. The https://t.co/87BAb0Y9zC promises an easy, detailed, and quicker alternative to analyze data with the power of human-guided AI.
Most AI tools focus on automation. EasyAIBridge https://t.co/UonzFWgl3o focuses on guided intelligence. In this video, we explain Human-Led AI Data Analysis — a smarter approach where human intent directs AI models to deliver fast, thoughtful, and well-structured insights. With EasyAIBridge, you don’t need technical skills or complex workflows. You connect your data, ask a clear question, and the system guides the AI to produce insights that are easy to understand and ready to use. Perfect for: • Managers • Executives • Business owners • Non-technical teams If you want clarity instead of complexity, this is how modern data analysis should work. 👉 Try EasyAIBridge today and get free trial.
Before you analyze data, you often need to extract specific information from Excel, Google Sheets, or CSV files. In this video, we demonstrate how EasyAIBridge SMART ASK allows non-technical users to extract targeted information using simple prompts—no formulas, no SQL, no technical setup.
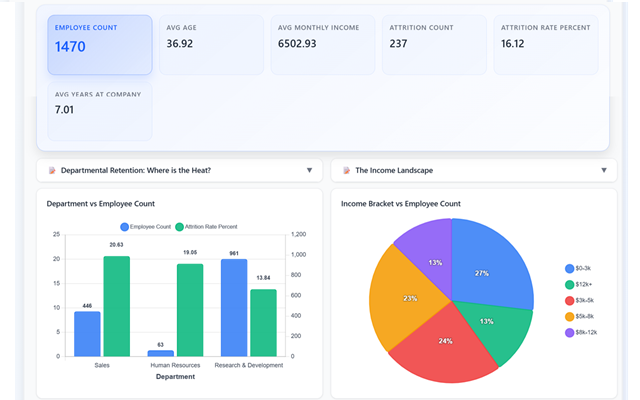
In this video, I show how EasyAIBridge creates complete data analysis dashboards in under 45 seconds.
You’ll see how non-technical managers can:
• Connect Excel or Google Sheets
• Ask real business questions
• Get instant dashboards and visuals
• Rerun analysis as data updates in real time
No SQL.
No Excel formulas.
No dependency on technical teams.
If your role requires fast, confident, data-driven decisions-this changes how you work.
👉 Get a free trial today!
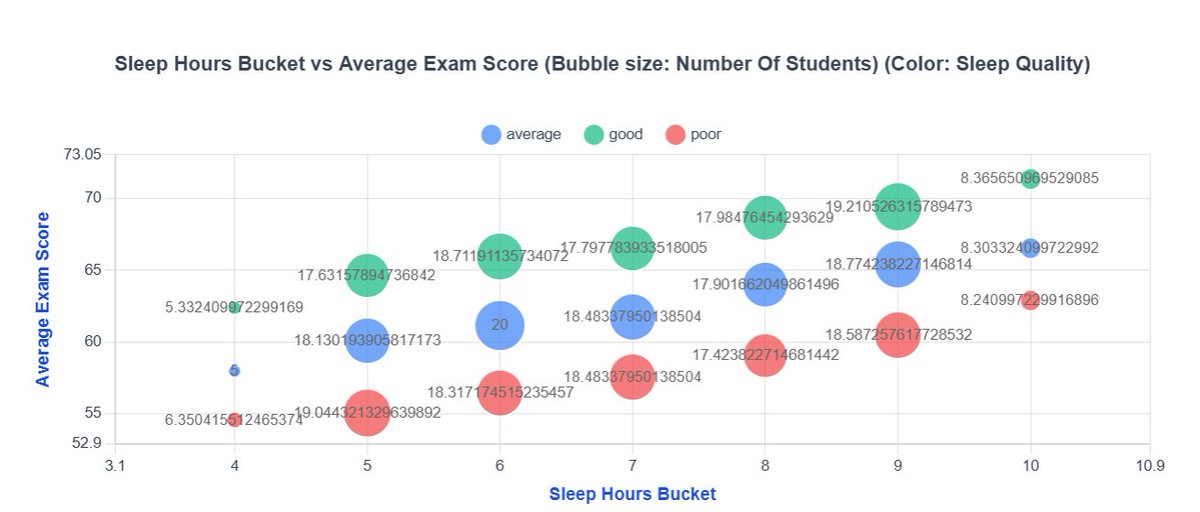
This dataset provided an extensive and realistic representation of various factors contributing to student exam performance. It contains 20,000 records, each describing a student’s academic behavior, study habits, lifestyle routines, and exam conditions. Easy AI Bridge extracted highlights from this data in seconds to facilitate a detailed understanding.
https://t.co/fSNbOqjMOz
EasyAIBridge is a powerful data analysis solution that creates dashboards in less than 45 seconds and works across multiple excel csv files and google sheets doing concurrent analysis. It utilizes Fusion Intelligence core and gap-filling intelligence to fix missing data. It, without stumbling on big data like chatbots do, does the job of data strategist, data analyst, and narrative builder. You can perform data analysis with zero technical knowledge and combine interactive dashboards, share reports, charts, graphs, and tables with your team for better decision making.