The descriptive PSI combines protest activity (30%), non-peaceful protest share (35%), and reported fatalities per 100 protests (35%). It is not predictive.
“Read the project methodology, limitations, and design rationale: https://t.co/R5nqwPUH0V”
Global Protest Monitor maps 232,507 ACLED protest records across 209 countries (Jan 2024–Jul 2025). Explore activity concentration, regional momentum, and observed severity through a transparent PSI.
https://t.co/FhPukMINbb
@tableau@tableaupublic#Tableau#DataViz#VizOfTheDay
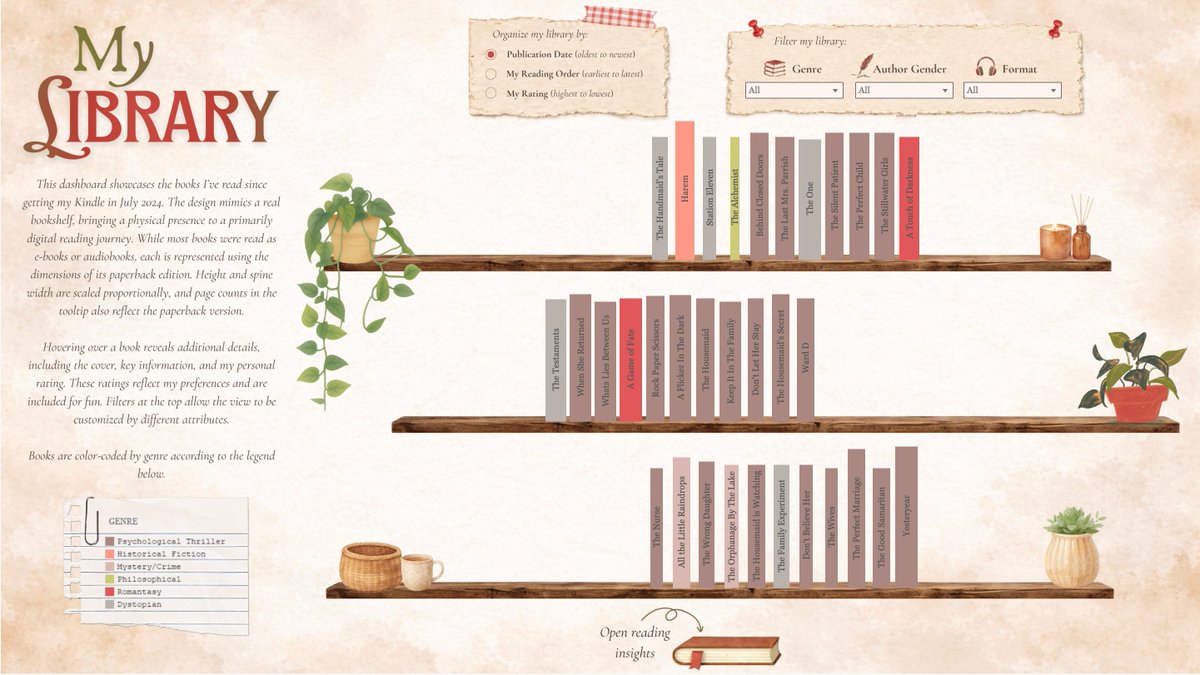
I turned my reading habits into a data viz 📚
Explore my digital library by hovering over the books, using the filtering/sorting options, and clicking the book icon for deeper insights.
🔗https://t.co/2HLRigxEiJ
@tableau@tableaupublic#Tableau#DataViz#VizOfTheDay