#XPIN#coin#market update. Technical chart analysis.
Elliot wave analysis:
- After the 3rd wave made its big move and hit 0.00297 ranges it had a shallow correction at fib retracement 0.382 ranges, and soon after started its huge 5th wave.
Momentum Analysis:
- Bullish momentum still relatively strong as shown by 4H MACD and EFI (trajectory suggests bullish strength will continue until 18th-19th).
- Volume is declining which as coincides with Elliot Wave Analysis (5th wave less volume than 3rd).
- Shorter outlook time frames (2H, 1H) suggests dips to occur but overall will move up.
Trend Analysis:
- Price is above Kernal Indicator on medium outlook time frames (2H-4H), which indicates bullish trend.
- Price is hitting the macro trend line but is likely to break above.
🚨🇹🇷🇮🇱 Mensaje del presidente turco Erdogan:
"Si Israel no deja de jugar con fuego y crea obstáculos para la paz en la región, nos aseguraremos de que APRENDA UNA BUENA LECCIÓN. Cualquier ataque a Líbano e Irán ahora se considerará un ataque a Turquía"
#XPIN technical chart update analysis.
Elliot Wave Analysis:
- 5 wave count are in and we are in the corrective ABC wave.
- We are currently on the A wave but it looks like we are entering the B wave to the upside to retest break down.
Momentum Analysis:
- 30m (short outlook) time frame indicates that A wave is starting to lose momentum to the downside.
- 2h (med term outlook) time frame indicates that bearish momentum of the overall downward of price is still just starting.
Trend Analysis:
- We broken down of the bullish trend line which coincides with Elliot wave analysis.
- We have still strong support at 0.00287 ranges.
Divergence Analysis:
- 15min RSI indicates oversold regions (A wave)
- 30min indicates oversold regions (A wave)
Fib Analysis:
- Retracement of overall 5 wave structure 0.382 or 0.5 is likely levels where ABC structure ends which is around 0.0025 price range.
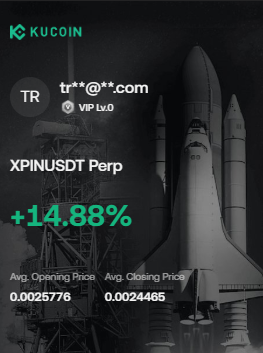
#XPIN possible long setup will post possible entry.
Trend analysis:
- Trending pretty well against bitcoin as btc consolidates and had a bounce off 104k
- Short term outlook (15m, 30m) price is still relative trending above the kernal MA, indicating bullish trend continuation but starting to see weakness as we enter in the 5th wave.
- Rejected from major uptrend line, however may retest one more time in the final 5th wave.
Momentum analysis:
- MACD and EFI have still very strong bullish momentum strength in the medium term outlook (2h, 4h) suggesting 5th Wave may continue up.
Divergence and volume:
- Volume and MACD on 2h shows bearish divergence which coincides with the 3rd wave and 5th wave structure.
- Stoch crossed the MA which we want to look for when the 3rd Wave ends and 5th wave retesting.
#XPIN#coin#market update. Technical chart analysis.
Elliot wave analysis:
- After the 3rd wave made its big move and hit 0.00297 ranges it had a shallow correction at fib retracement 0.382 ranges, and soon after started its huge 5th wave.
Momentum Analysis:
- Bullish momentum still relatively strong as shown by 4H MACD and EFI (trajectory suggests bullish strength will continue until 18th-19th).
- Volume is declining which as coincides with Elliot Wave Analysis (5th wave less volume than 3rd).
- Shorter outlook time frames (2H, 1H) suggests dips to occur but overall will move up.
Trend Analysis:
- Price is above Kernal Indicator on medium outlook time frames (2H-4H), which indicates bullish trend.
- Price is hitting the macro trend line but is likely to break above.
#BTC short term market update.
- BTC hits 103-104k regions and looks like it finding support as it bounces up towards 106k retest.
- Momentum analysis for 4H macd shows a weakening in bearish momentum hence the bounce 106k. However longer term outlook 3D macd shows bearish momentum is still in early stages.
- Ideal strategy: best play is to look for bearish/short setups (however be very cautious as BTC may continue this bounce).
@DrProfitCrypto Risk to reward is bad. Bull market is a period to sell, not a period to hold long term. Bet on the bear market phase and halving cycles.
People believe bear markets are easy
In 2022 bear SOL went from $250 to $8
You need a x32 increase for break even!
Most of coins never ever recover!
This bear will break many people!
How to get rich? Compounding. Bet on the #BTC#bear market and aim to buy the bottom.
If BTC drops to 45-50k region. Buy it and hold it until 2028, which is next halving date. Assuming BTC goes back to ATH, you would x2 or x3 your amount from the bottom.
Now sell and rotate into ETH or SOL, wait for that to x2 and sell and go into privacy coins, and wait for that to x2.
You would turn that 50k initial investment into 400k.
Repeat for next halving 2032.
@DrProfitCrypto Best strategy is make sure to have some reserves in case we do enter bear season. Play the long game. The bull market has been over extended and the risk to reward is not good. I agree with doctor profit. Now is time to de-risk and not invest long term.
104k-102k region support.
Possible short opportunity for #XPIN.
Setup: Shorting the 5th Wave
Trend:
- Bitcoin short term is trending bearish.
- XPIN is trending inversely to BTC, so its doing its own thing.
- XPIN looks like its consolidating after a big move and possibly starting to lose momementum.
Eliiot Wave pattern:
- 5 wave count are in.
- 30m MACD MA crossover.
Entry: TBD
Divergence analysis on 1h time frame shows that there are signs of bearish divergence (macd, volume). This could indicate consolidation period or possible downtrend.
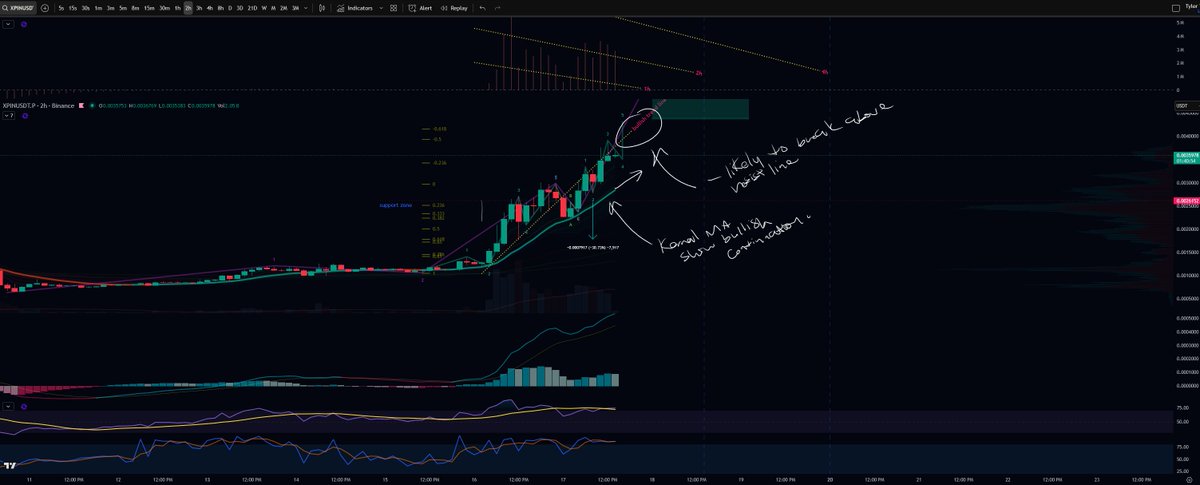
#XPIN Trend analysis:
- Still holding to bullish trend as indicated by price above the kernal MA
- Price just cross the macro trend line (horizontally indicating consolidation)
- Price is still relatively close to fib support zone
Overall: Price may still have more to go and not drop yet