TODAY IS THE DAY!
And what better than a Friday when you can add a whole playlist of #dataviz to your weekend?
The @DataVizSociety@OutlierConf 2023 talks are all now available to watch!
If you joined us in May, what talk would you recommend to folks?
https://t.co/cmcRdb4MB5
🇺🇸 Bar Chat is a #dataviz gathering aimed at energizing the local data community by fostering idea exchange among people from diverse backgrounds around a bar table. It promotes learning, partnerships, and collaborations over drinks.
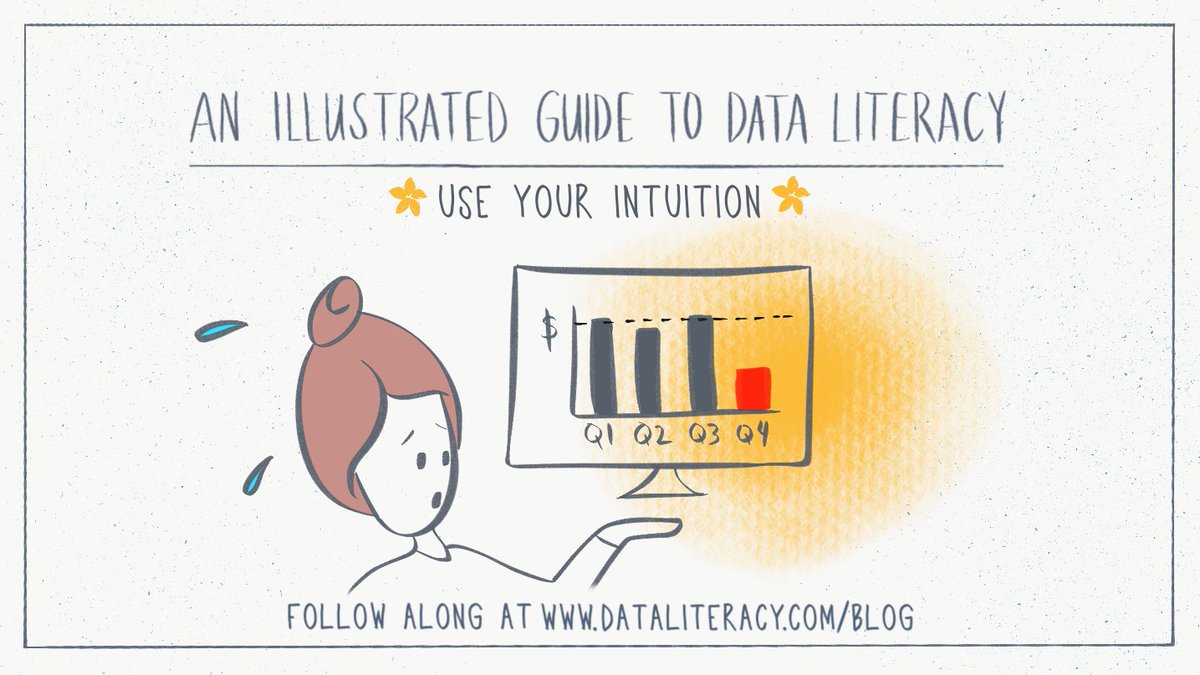
🧠📊 Have you ever had a gut feeling that something's off with your numbers? It turns out, intuition plays a big role in working with #data. In our new comic, Becky and Fern learn that intuitive and analytical thinking are complementary! https://t.co/xXqwpszJmV
"There's nothing inherently objective about charts." @jburnmurdoch
Reminds me of @AlbertoCairo's "A chart hides as much as it shows."
Important in a world where people are more accustomed to seeing charts AND more people are more skeptical of charts post-pandemic. #outlier2023
#outlier2023 wrapping up the outlier conference in Porto! Great conference with inspiring speakers, and a passionate and engaging community! Lot’s of new ideas to reflect over the next few days. @DataVizSociety
#outlier2023 Text matters! Text or chart, which one comes first? @JohnBurnMu6509 First think on the message you need to convey, then design the chart and iterate back to the title.
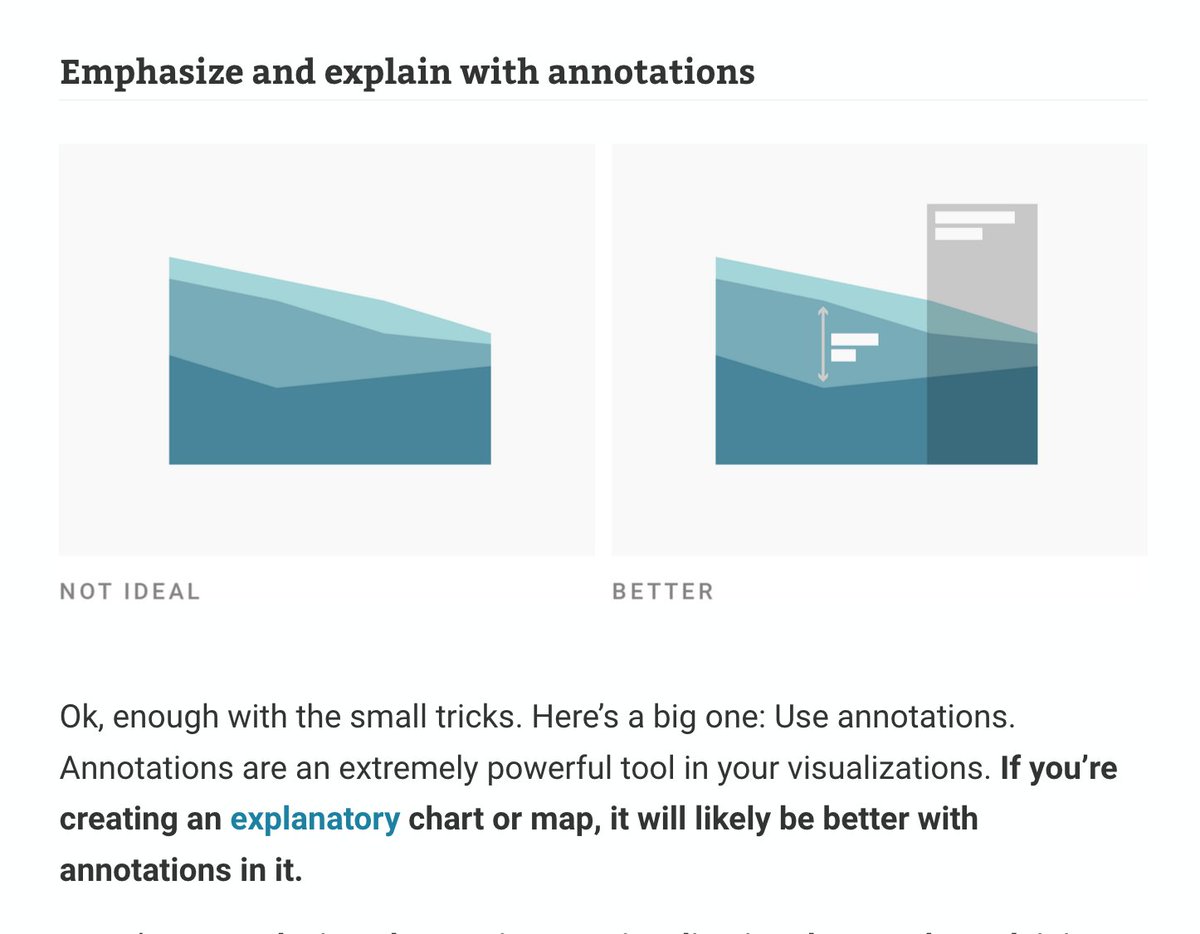
#outlier2023@jburnmurdoch perspective on some “datavis rules”👍 and how some small details can really transform charts into pieces of communication. E.g.,text and annotation can have a high impact on the consumption of the chart. Great presentation 👌
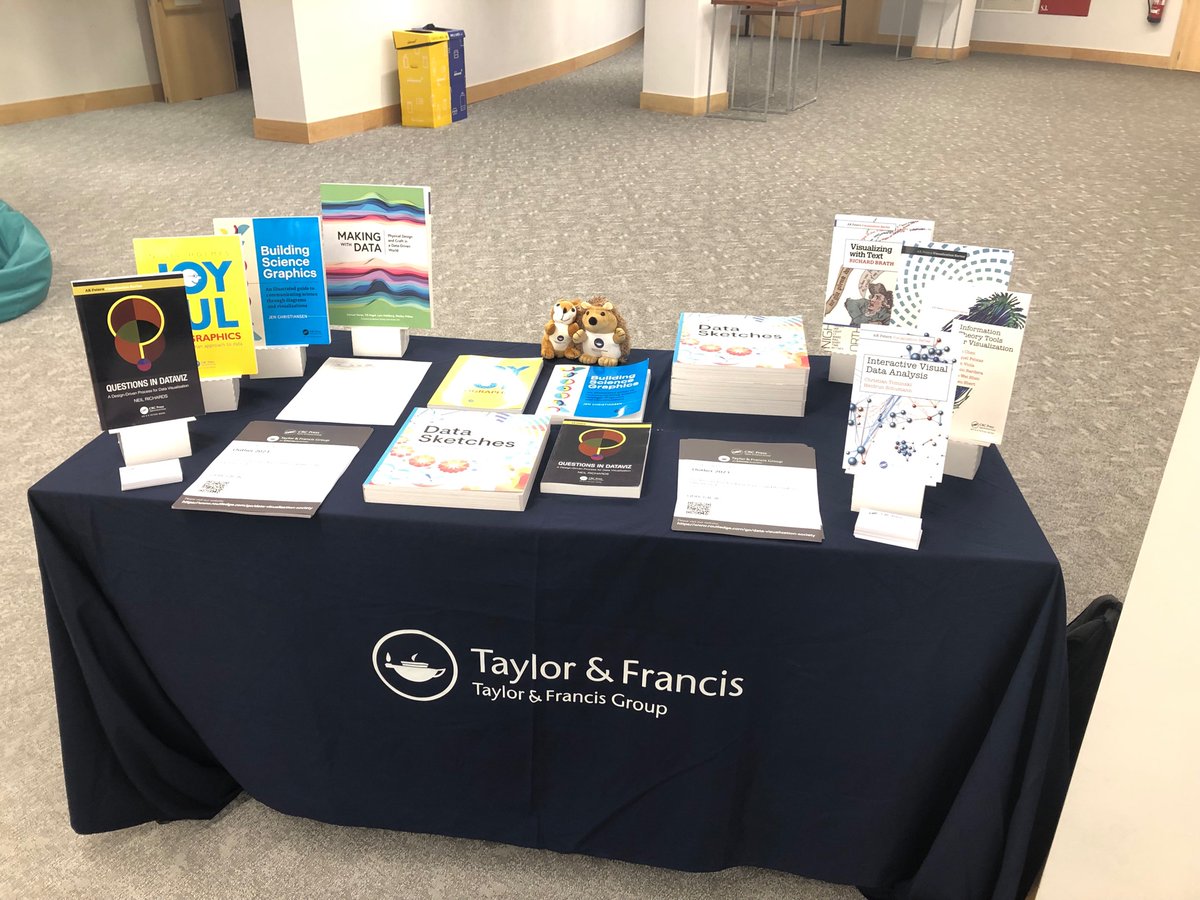
Attn @OutlierConf!
All of the books on display can be ordered with a discount via the following 🔗 https://t.co/B31em54cQ8
There is also a 'FreeBook' 🔗 https://t.co/1k82qtFmrj
Next up virtually at #outlier2023 is awesome data viz creative (and book cover designer) @AlliTorban with lessons on deciding our own creative toolkit - always excited to hear from Alli!
.@visualisingdata & @Jasonforrestftw take the stage to talk about the making of Nightingale Magazine, the journal of the @DataVizSociety. Print Issue 3 drops this month! #outlier2023
.@DatavisLisboa supports @OutlierConf by @DataVizSociety, which will take place on 3-5 May in Porto! 🇵🇹
Outlier brings together all corners of the data visualization community, from artists to business intelligence developers, working in every tech stack you can imagine and...
Win a ticket and attend a free event?
🙌 We offer you both!
Thanks to our collaboration with @OutlierConf, (@DataVizSociety) which will take place on 3-5 May in Porto, we can offer:
🎙 An insight into gender inequality in the toponymy of cities, bringing 2 Portuguese projects
+
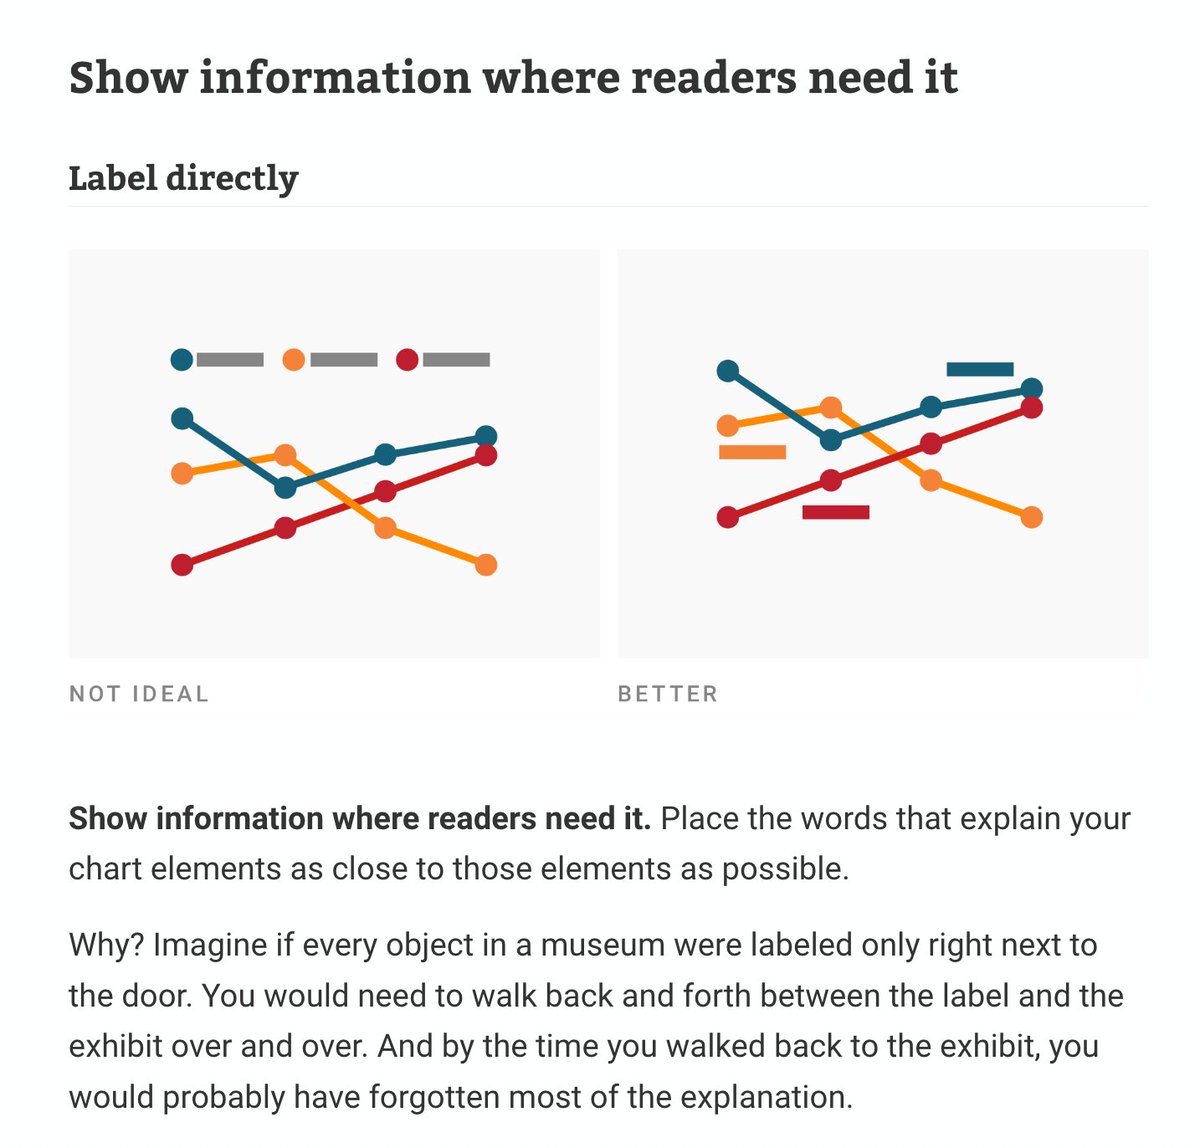
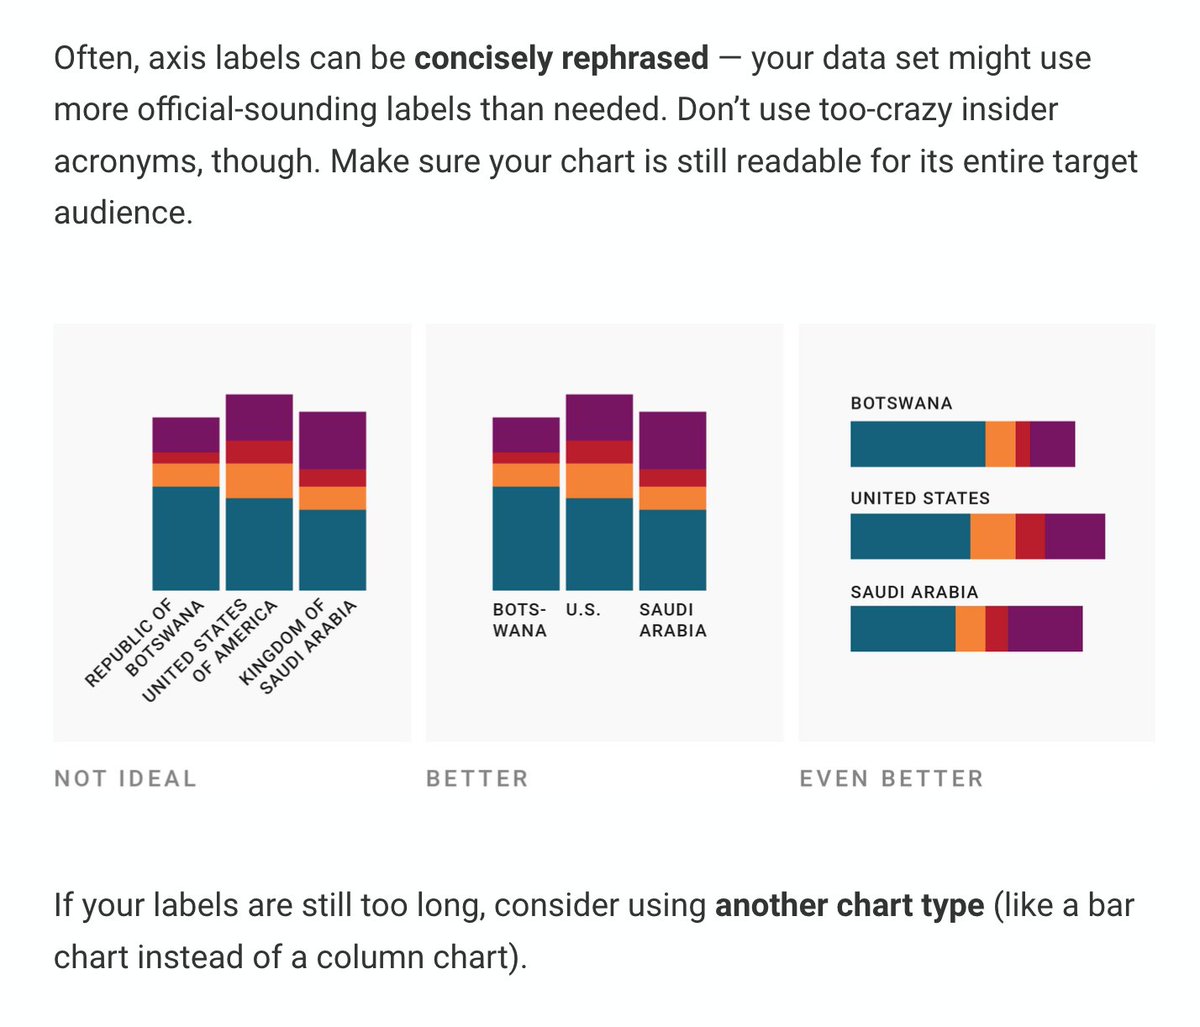
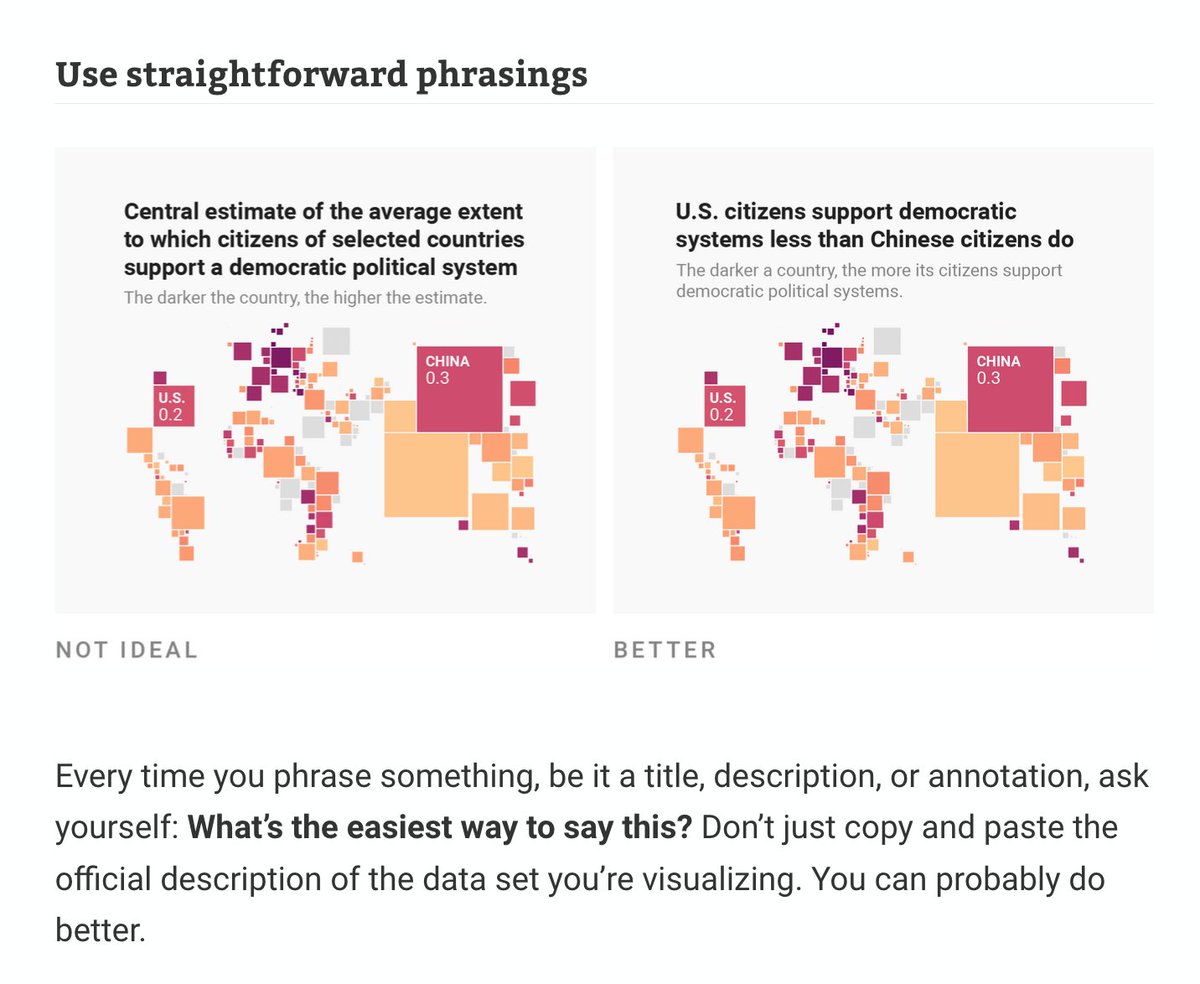
Text might be the most neglected part of #dataviz. We talk a lot about how the right chart type and colors can improve visualizations – but not enough about how to use words well.
So I wrote about that in my latest article: https://t.co/Ao1HhBNZ95