I've recently added another powerful BI tool to my arsenal!
Learning Google Looker Studio has been an enjoyable journey. What surprised me is that it shares some remarkable similarities with Power BI, making the transition smoother than I expected... 1/4
We are excited to celebrate the outstanding participants of the 30 𝐃𝐚𝐲𝐬 𝐨𝐟 𝐋𝐢𝐧𝐮𝐱 𝐂𝐡𝐚𝐥𝐥𝐞𝐧𝐠𝐞 organised by the Data Engineering Community (DEC)! 🎉
A huge congratulations to our winners who showed consistency, discipline,
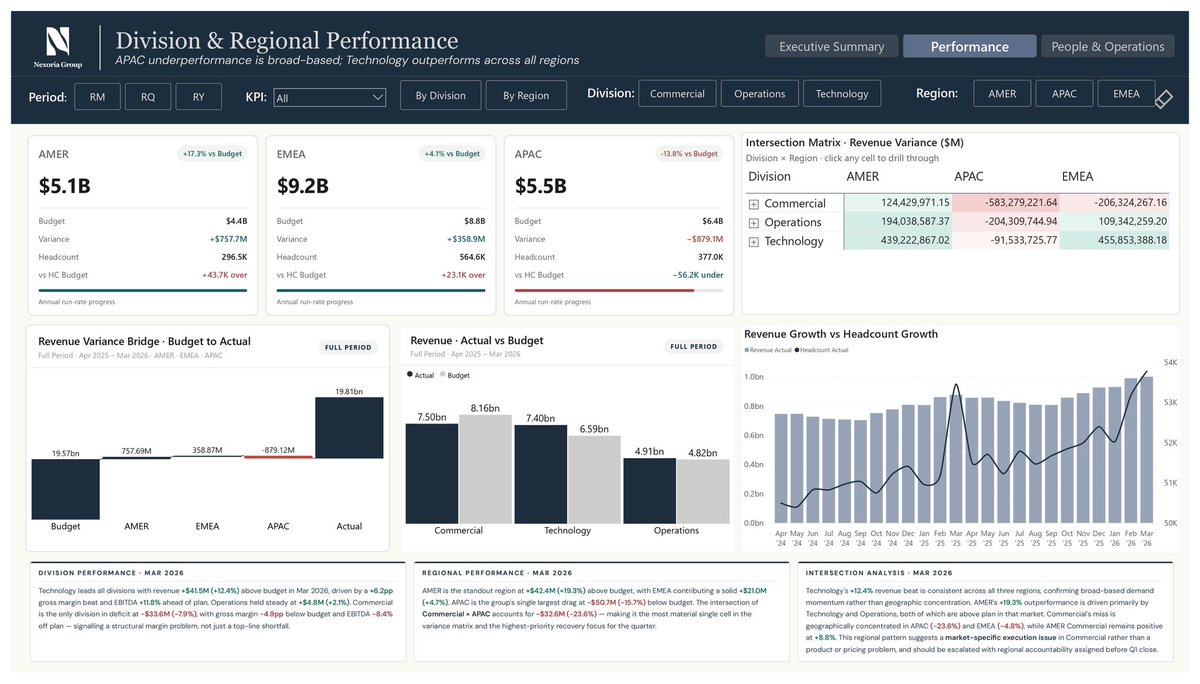
For @zoom charts #4ureports challenge, I asked myself a question: what would a truly board-ready Power BI report look like; not just functional, but one that tells a story?
So I built one.
The project is Nexoria Group, a fictional global enterprise across three divisions (Technology, Operations, Commercial) and three regions (AMER, EMEA, APAC). 24 months of data. Actual, Budget, and Forecast. Financial, customer, people, and operational KPIs.
The question on my mind while I built this: what does a board member actually need to feel when they open this report?
They need to know where they stand in three seconds. They need to know why a number moved. And they need to know what to do about it — before anyone has to explain it.
That shaped every decision I made.
The Executive Summary answers “where are we?” — Revenue, EBITDA, Gross Margin, Headcount, and Active Customers against budget, with a 24-month trajectory showing the full story arc from Apr ’24 to Mar ’26.
The Performance page answers “what’s driving it?” — a waterfall bridge, a Division × Region intersection matrix, and dynamic narratives that summarizes what’s happening and what should be done.
The People & Operations page answers “are we set up to sustain it?” — headcount productivity, operational health, and customer momentum, all in one view.
And the drillthrough page answers “show me the detail” — right-click any cell in the matrix and land on a scoped page with a revenue bridge, product line breakdown, margin trend, and board-ready narrative.
On the technical side, I explored Zoomcharts for the first time and I used custom HTML DAX measures to render fully styled KPI cards and narrative blocks directly inside Power BI, maintaining a consistent dark navy design system across every page. Exploring these HTML DAX has pushed me to think about DAX not just as a calculation engine, but as a presentation layer.
#PowerBI #DataStorytelling #DAX #BusinessIntelligence #DataVisualization #DataAnalytics #ExecutiveDashboard #builtwithzoomcharts
Cohort 5 isn't just a course; it's a 12-week career transformation.
✅ Weeks 1-6: Excel Mastery 📗
✅ Weeks 7-12: Power BI Dashboards
✅ 72+ Hours of Live Learning 🏆
🔥 THE BONUS: Pay in full & get 1 month of Data Labs for FREE! Build a portfolio that recruiters can't ignore
The journey to mastery begins February 26th. 🚀
Don't stay on the sidelines. Join our community today and prepare to turn your curiosity into a high-income skill.
Join the family here: 👇
https://t.co/ymWQeJG4dX
#skillphore#ᴍᴏɴᴅᴀʏᴍᴏᴛɪᴠᴀᴛɪᴏɴ#datamastery
Data is a global language and your skills are the passport.
Join our Data Community today to get a head start, connect with fellow learners, and stay updated as we prepare for the new cohort.
Join the family here: 👇
https://t.co/ymWQeJG4dX
#JapaWithData#DataAnalytics
@La_j0lz They are some Internet scammers in Nigeria, doesn't mean Nigeria is a nation of Internet scammers. Jesus is the best way. Just because some people are in church doesn't mean they follow the way. Selah
The future of civil service is digital. Are you ready?
Learn Excel, Data Analytics, and modern digital tools designed to help you:
✅ Work faster
✅ Automate reports
✅ Stay relevant in the digital era
Enrol now!👇
https://t.co/kDd4dVXS5w
#CivilService#DataAnalytics#Upskill
@skillphore@Tech_babby Oh, and we understand that learning new concepts are hard, so we @skillphore teach with empathy and relatable contents. Our strengths are in making data learning for newbies clear and relatable - from the curiosity stage to learning these new concepts & applying them.
@Tech_babby@skillphore has exceptional data analytics tutors & a supportive data community that help newbies start their data analytics journey.
With live online classes, mentoring sessions, interview prep & career readiness sessions, & capstone projects, learners experience real growth.