@iam_daniiell@Aadam455 When was the last time Ronaldo was properly fed by a world class midfield
Ronaldo is old and not as sharp as he used to be but he's not the problem of Portugal The midfield and the coach's tactics are the problem
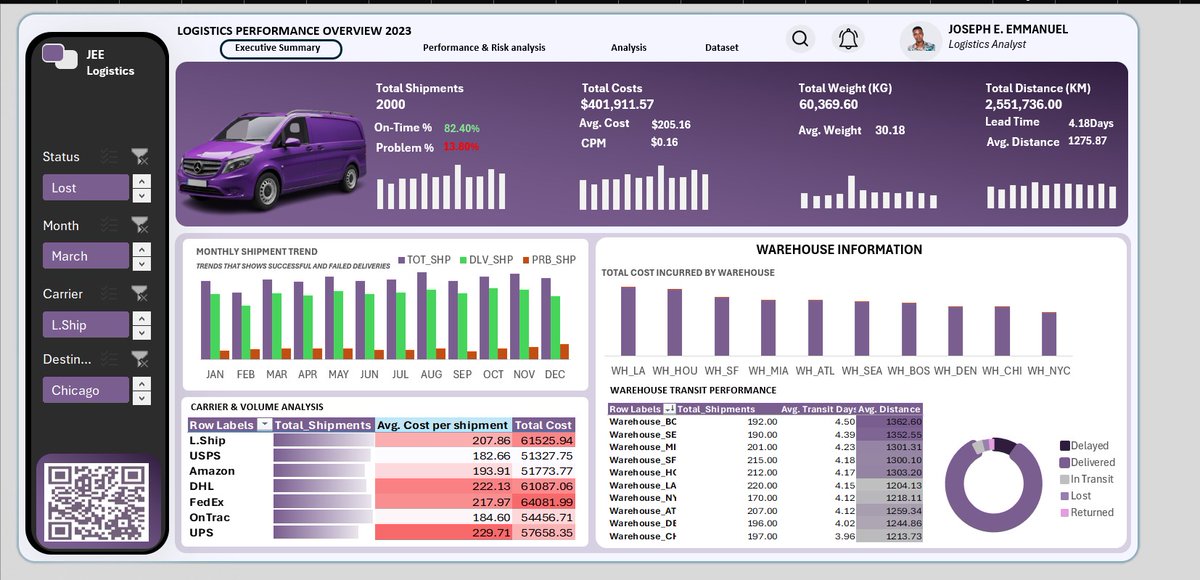
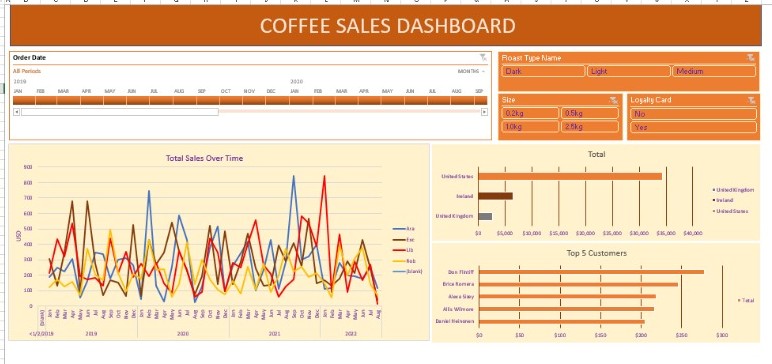
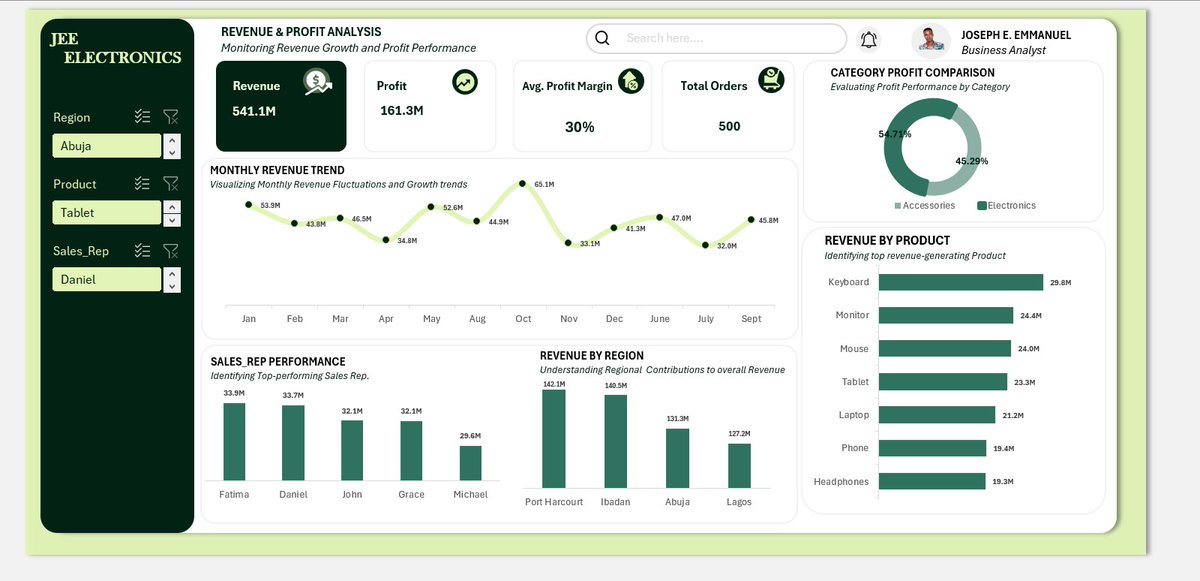
The first frame was my first guided project, the second frame my first solo project.
Blessed to have had an amazing tutor @iam_daniiell. Every project has been a learning milestone 🙌📈
@CFC_OBED 🏆 Player of the Season: João Pedro and Enzo
❌ Flop of the Season: Delap
💪 Most Improved Player: Hato
👏 Unsung Hero: Sanchez
👕 Signing of the Season: João Pedro
🏠 Keep this player : Enzo
👍: sell this player Delap Garnacho Tosin Badiashile
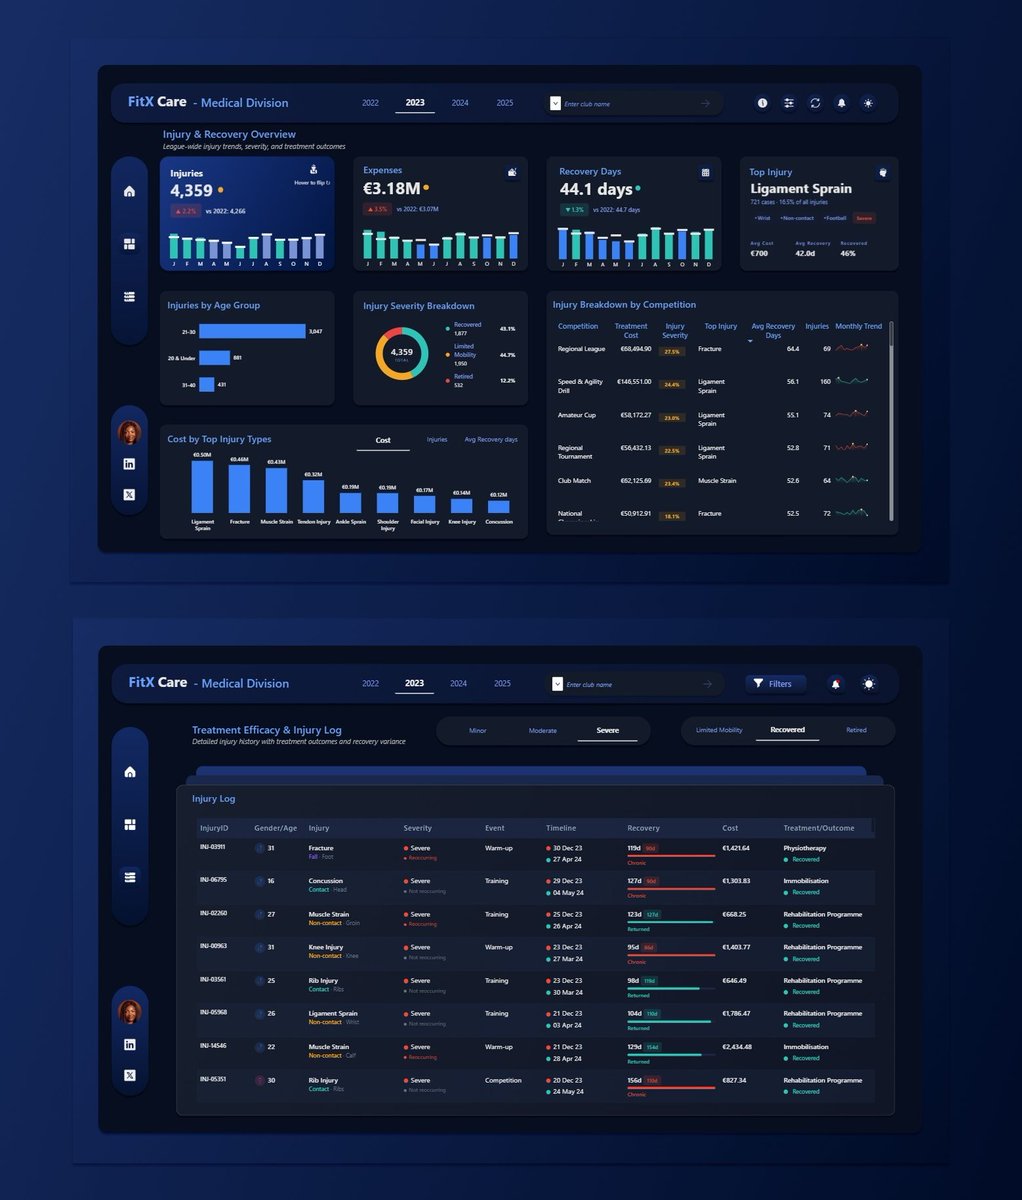
𝗙𝗶𝘁𝗫 𝗖𝗮𝗿𝗲 𝗷𝘂𝘀𝘁 𝗽𝘂𝘁 𝗶𝗻 𝗮 𝗯𝗶𝗱 𝘁𝗼 𝗺𝗮𝗻𝗮𝗴𝗲 𝗮𝘁𝗵𝗹𝗲𝘁𝗲 𝗺𝗲𝗱𝗶𝗰𝗮𝗹 𝗼𝗽𝗲𝗿𝗮𝘁𝗶𝗼𝗻𝘀 𝗮𝘁 𝘁𝗵𝗲 𝟮𝟬𝟮𝟴 𝗢𝗹𝘆𝗺𝗽𝗶𝗰𝘀.
As the major health provider for a prominent sports league, the executive team needs to audit 4 years of injury data — 60+ clubs, 800 athletes, 5 sports — before they pitch.
Three individuals are leading this pitch, starting with the Chief Medical Officer.
Dr. Claire needs to walk into that pitch room knowing what FitX Care has handled, what worked, and where the gaps are. Her questions are the same ones the Olympic committee will ask:
𝗤𝟭: What's the scale of what we've managed?
→ 16,800+ injuries across 2022–2025. All 800 athletes affected. Ligament Sprain dominates every year, Ankle the most impacted body part.
𝘛𝘩𝘦 𝘤𝘰𝘯𝘴𝘪𝘴𝘵𝘦𝘯𝘤𝘺 𝘪𝘴 𝘢 𝘴𝘵𝘳𝘦𝘯𝘨𝘵𝘩 — 𝘪𝘵 𝘮𝘦𝘢𝘯𝘴 𝘵𝘩𝘦 𝘵𝘦𝘢𝘮 𝘩𝘢𝘴 𝘥𝘦𝘦𝘱 𝘱𝘢𝘵𝘵𝘦𝘳𝘯 𝘳𝘦𝘤𝘰𝘨𝘯𝘪𝘵𝘪𝘰𝘯. 𝘓𝘦𝘢𝘥 𝘵𝘩𝘦 𝘱𝘪𝘵𝘤𝘩 𝘸𝘪𝘵𝘩 𝘵𝘩𝘪𝘴.
𝗤𝟮: Are things getting better or worse?
→ Injuries rose from 4,266 (2022) to 4,410 (2024), then dropped to 3,765 in 2025. Average recovery fell from 44.7 to 35.6 days — a 20% improvement. August–September spikes repeat every year.
𝘛𝘩𝘦 𝘳𝘦𝘤𝘰𝘷𝘦𝘳𝘺 𝘪𝘮𝘱𝘳𝘰𝘷𝘦𝘮𝘦𝘯𝘵 𝘪𝘴 𝘵𝘩𝘦 𝘩𝘦𝘢𝘥𝘭𝘪𝘯𝘦. 𝘉𝘶𝘪𝘭𝘥 𝘵𝘩𝘦 𝘖𝘭𝘺𝘮𝘱𝘪𝘤 𝘴𝘵𝘢𝘧𝘧𝘪𝘯𝘨 𝘮𝘰𝘥𝘦𝘭 𝘢𝘳𝘰𝘶𝘯𝘥 𝘵𝘩𝘦 𝘴𝘦𝘢𝘴𝘰𝘯𝘢𝘭 𝘴𝘱𝘪𝘬𝘦 𝘱𝘢𝘵𝘵𝘦𝘳𝘯.
𝗤𝟯: What has treatment cost us?
→ €12.9M over 4 years, rising from €3.07M to €3.45M annually. Ligament Sprains and Fractures consistently dominate the spend.
𝘊𝘰𝘴𝘵𝘴 𝘢𝘳𝘦 𝘳𝘪𝘴𝘪𝘯𝘨 𝘧𝘢𝘴𝘵𝘦𝘳 𝘵𝘩𝘢𝘯 𝘪𝘯𝘫𝘶𝘳𝘺 𝘷𝘰𝘭𝘶𝘮𝘦 — 𝘪𝘯𝘷𝘦𝘴𝘵𝘪𝘨𝘢𝘵𝘦 𝘸𝘩𝘦𝘵𝘩𝘦𝘳 𝘵𝘳𝘦𝘢𝘵𝘮𝘦𝘯𝘵 𝘮𝘪𝘹 𝘩𝘢𝘴 𝘴𝘩𝘪𝘧𝘵𝘦𝘥 𝘵𝘰𝘸𝘢𝘳𝘥 𝘮𝘰𝘳𝘦 𝘦𝘹𝘱𝘦𝘯𝘴𝘪𝘷𝘦 𝘪𝘯𝘵𝘦𝘳𝘷𝘦𝘯𝘵𝘪𝘰𝘯𝘴.
𝗤𝟰: How effective are our outcomes?
→ 43.7% recovery rate overall. 48.5% reinjury rate. The Injury Log exposes every case with progress bars, treatment method, and color-coded outcomes — chronic cases flagged red.
𝘛𝘩𝘦 𝘳𝘦𝘪𝘯𝘫𝘶𝘳𝘺 𝘳𝘢𝘵𝘦 𝘪𝘴 𝘵𝘩𝘦 𝘣𝘪𝘨𝘨𝘦𝘴𝘵 𝘳𝘦𝘥 𝘧𝘭𝘢𝘨. 𝘚𝘵𝘳𝘦𝘯𝘨𝘵𝘩𝘦𝘯𝘪𝘯𝘨 𝘳𝘦𝘵𝘶𝘳𝘯-𝘵𝘰-𝘱𝘭𝘢𝘺 𝘱𝘳𝘰𝘵𝘰𝘤𝘰𝘭𝘴 𝘣𝘦𝘧𝘰𝘳𝘦 𝘵𝘩𝘦 𝘣𝘪𝘥 𝘪𝘴 𝘯𝘰𝘯-𝘯𝘦𝘨𝘰𝘵𝘪𝘢𝘣𝘭𝘦.
𝗤𝟱: Where is risk concentrated?
→ Severe injuries held at ~17% for three years, then spiked to 23.9% in 2025. Regional League carries the highest severity at 27.5%.
𝘛𝘩𝘦 2025 𝘴𝘦𝘷𝘦𝘳𝘪𝘵𝘺 𝘴𝘱𝘪𝘬𝘦 𝘯𝘦𝘦𝘥𝘴 𝘢 𝘳𝘰𝘰𝘵 𝘤𝘢𝘶𝘴𝘦 𝘢𝘯𝘢𝘭𝘺𝘴𝘪𝘴 — 𝘸𝘢𝘴 𝘪𝘵 𝘸𝘰𝘳𝘬𝘭𝘰𝘢𝘥, 𝘴𝘤𝘩𝘦𝘥𝘶𝘭𝘪𝘯𝘨, 𝘰𝘳 𝘴𝘰𝘮𝘦𝘵𝘩𝘪𝘯𝘨 𝘴𝘺𝘴𝘵𝘦𝘮𝘪𝘤?
—
Next: the Performance Director (availability, training load, return-to-play)
—
Based on these numbers — a 20% recovery improvement but a 48.5% reinjury rate and a rising severity trend — would you recommend FitX Care send the bid? What would you fix first? Let me know in the comments😉
@iam_daniiell
#DataAnalytics #PowerBI #HealthcareAnalytics #DataVisualization #DAX #SportsAnalytics
I revisited one of my Power BI reports and added CSS flip animations to the KPI cards.
One toggle switches the entire report between Category (blue) and Location (purple) views — cards, heatmaps, tooltips, everything.
Here's what's under the hood 🧵
𝗠𝘆 𝘀𝘁𝘂𝗱𝗲𝗻𝘁𝘀 𝗱𝗶𝗱𝗻’𝘁 𝗸𝗻𝗼𝘄 𝗱𝗮𝘁𝗮 𝗮𝗻𝗮𝗹𝘆𝘀𝘁𝘀 𝘂𝘀𝗲 𝗙𝗶𝗴𝗺𝗮.
Honestly, that reaction told me everything.
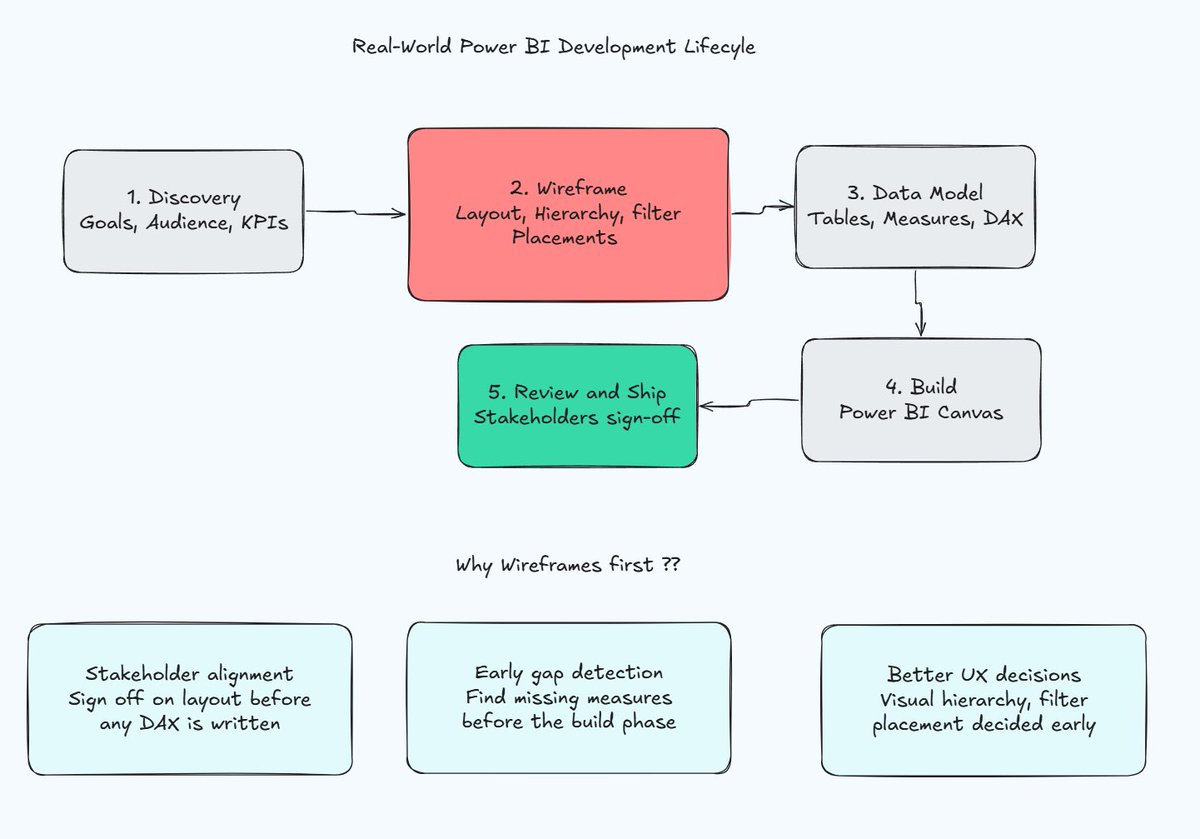
Today we covered wireframing in Power BI.
The moment I showed them how a wireframe catches gaps before a single DAX measure is written —
the questions got intense.
One student asked:
“So wireframing can actually prevent build problems?”
Yes.
That’s exactly the point.
Most people jump straight into Power BI and start building.
Then halfway through they realise:
→ The layout doesn’t tell a story
→ A measure they need doesn’t exist yet
→ The stakeholder wanted something completely different
Wireframing fixes all of that before it becomes expensive.
Discovery → Wireframe → Data Model → Build → Ship
That’s the real Power BI development lifecycle.
Not “open Power BI and start dragging visuals.”
𝗧𝗵𝗶𝘀 𝗶𝘀 𝘄𝗵𝘆 𝗜 𝘁𝗲𝗮𝗰𝗵 𝘁𝗵𝗲 𝗽𝗿𝗼𝗰𝗲𝘀𝘀, 𝗻𝗼𝘁 𝗷𝘂𝘀𝘁 𝘁𝗵𝗲 𝘁𝗼𝗼𝗹.
#Datafam
𝗚𝗼𝗼𝗱 𝗻𝗲𝘄𝘀.
Talk Data With Danny is back.
First video of 2026 is already in the edit —
an advanced Excel Social Media Analytics Dashboard.
Real data.
Real metrics.
Built from scratch.
Dropping this weekend.
If you’ve been waiting… it’ll be worth it 👀
Subscribe so you don’t miss it 🔗
https://t.co/cQSfna5E8K
#Datafam