This is your chance to get on the bottom floor of a group that is truly going to rise like a skyscraper! @_Selinoo@dafilipinotradr are growing a magnificent community of affable and positive-minded traders that are focused on educating and trading the best setups in the market on a daily basis (with our main traders focusing on everything from credit spreads to forex and everything in-between). If you are interested in joining us, please DM any one of us for more information or click the link below, and I promise you there will be no regrets in joining us at Capital Compass Trading. 🙂🙏 https://t.co/DrPjfffx9w
Over 27k in profits for August💪✅
Majority came from securing some $ASTS shares near $53 from $31.
$FSLR $QQQ & $BABA were some of my big options winners along with a good win from the $BLSH IPO.
Join me and 50+ other dedicated traders on the journey and learn how to navigate the market.
https://t.co/hqTmTP5A3J
$PLTR is looking rather interesting.
On the Quarterly time frame, price has recently reclaimed the Quarterly 8 EMA, showing strength is beginning to return slowly to this ticker.
On the Monthly time frame, the Monthly 21 EMA has recently been surmounted by price, but $PLTR still has to overcome the Monthly 8 EMA as a level of resistance before I can be truly convinced that strength is returning for a move to the upside.
What has me hypothesizing that we could be seeing some good momentum returning soon to $PLTR is on the Weekly time frame, where a rising wedge can be seen. With the Weekly 100 and 8 EMAs below for support, there is still the 21 and 50 Weekly EMAs to contend with just above my Quarterly breakout level at $136.32. With price movement compressing in this wedge as it moves up towards my trigger level, like a coiled spring if we see higher than average volume push us through these major levels of resistance we could see some explosive price action moving us up to $143.
To add even more evidence to my thesis, on the Daily time frame, a bullish flag pattern can be seen forming just below my breakout level. In the past 42 days, price has tried 6 times to close above $136.32. With every tap of my trigger level, resistance becomes weaker, and with just the 100 and 200 EMAs above as resistance and 8, 21, and 50 EMAs below as support, it is only a matter of time before the pressure from this cauldron explodes and we see the next move up. With volume falling as price consolidates over all time frames mentioned in this post, bigger players are not selling out of $PLTR, and, just like us, they are biding their time waiting for the next breakout to emerge.
I will alert here if I take a position in $PLTR.
$EOG made a fairly decent move up today, but I did not take a position on this ticker for a few reasons:
1) The most important indicator I take into consideration before I take any position is volume. At about 10:50 AM (pointed out by yellow arrow) on the 5 minute time frame, we see that price almost breaks over my breakout level at $141.11 with significant volume seen below with my volume indicators. But, when you look at the candle you see that even though there was a lot of volume behind the move, sellers were in control pushing price back down significantly to where it essentially started creating a falling star candle pattern. Later in the morning at around 11:45 AM, price finally breaks over and closes above my trigger level, but if you look at the volume, it is severely lacking compared to what was seen an hour before, which always gives me pause. As I continued to monitor price action over the course of the day, price began to fade below my breakout level. Then, during power hour at the very end of the day, we see huge volume return and price makes a move back up closing just below my trigger level at $141.09 (seen by the green arrow). This shows me that there is still interest and promise in my original thesis for this ticker.
2) Another important factor I take into consideration is the Average Daily Range (ADR) Percentage, or how much a stock's price moves on average during a normal trading day. When price first crossed my trigger level ($141.11) at 11:45 AM, you can see with the blue arrowed line that price had already moved 2.07% from the low of day to my trigger level. The ADR Percentage of this stock is 2.35%. So, by the time price had crossed my breakout level, the stock doesn't have very much momentum left since price has already moved 2.07% out of its average price movement of 2.35%. This was another deciding factor that prevented me from taking a position, which was supported by the fact that after 12:50 PM, price stalled and faded into the end of the day.
3) Overall market sentiment is also very important to consider before taking any position. SPY, QQQ, DIA, IWM, all showed weakness, selling off for most of the day. There is a saying that a rising tide lifts all boats and when the market is hot and moving up this can help support momentum breakouts greatly. But when the tide is falling, you must be extra cautious before taking a trade because if the market has a bearish sentiment for the day, that state of mind is incredibly contagious and will change the bias of all market players. Even the best setups can fail when general market conditions are poor.
During a day like today, it is a very prudent course of action to take note of which stocks showed relative strength today and moved upwards even when the stock market as a whole sold off. I will be reviewing my screeners and I will soon post the best looking ticker going into tomorrow.
I will still be keeping $EOG on my watchlist because my thesis is still intact, we just need more time to see it play out. With that promising price action we saw with a large volume price move at the end of day on Monday, this shows me that there is still a spark of interest in this stock, we are just waiting for the flames of momentum to lift us higher.
Over the past month, the Energy Minerals sector has been heating up and Integrated Oil has been one of the leading industries in this sector.
One ticker in particular that stood out to me was $EOG , where it is shaping up on multiple time frames in continuation patterns that lead me to believe that a big move is coming soon. The general trend for this stock is bullish, with a bull flag pattern noticeable on the Quarterly, Monthly, and Daily time frames, and a rising wedge visible on the Weekly time frame. With the 8, 21, and 50 EMAs firmly established below price on all time frames and volume for the most part decreasing as the stock consolidates, the trend is strong for $EOG . Price has been consolidating under my Quarterly breakout level of $141.11 for about 100 days, so when a breakout finally coalesces, I would expect momentum to move price up to $144 quickly.
I will be watching this ticker keenly during the upcoming week and I will alert here if I take any action on $EOG .
The overall sentiment for the market last week was consolidation and weakening upward momentum, with the larger indexes like QQQ and SPY chopping around for most of the week leading to a large gap down on Friday the 17th. Could we be entering into a new bearish trend or will strength return to maintain the current cosolidation period with an eventual move back up?
As for my playlist from the previous week:
- $CVS had noteworthy relative strength last week, being able to maintain its price above the Daily 8 EMA for the entire week. Price did cross my trigger level over the course of 3 days, with 2 of those days price closing below my trigger point. So, if I did enter a options position on the first and second cross of my breakout level, I would have been stopped out twice. On the third trigger of my level, I would have been able to secure some small profits on that same day I took my position. So, not a clean easy trade by any means, but the market has been tricker to trade as of late.
- $RDDT ended up never crossing my breakout level and taking a dive later into the week, breaking below the 8 and 21 EMAs, but holding the 50 EMA. The continuation pattern I was watching is now broken, but I will be keeping an eye on this ticker to see what develops in the future.
- $AMZN had a very strong day when it broke through my trigger level, but then the following days, it came right back down. It seems like the market is having more quick intraday pops and drops, which will encourage me to take my positions off sooner to secure profits, especially with the wider market direction looking tumultuous.
- $HIMS is another stock where price never crossed my breakout level and also ended up moving down towards the end of the week. With the continuation pattern broken on the Daily time frame, we will see how price develops in the future.
I want to thank everyone who has taken the time to read my posts and follow me on my journey. I welcome anyone to comment, give advice, and share their own thoughts as I grow to become a better trader and a better person. I am incredibly thankful and immensely fortunate to have @_Selinoo, @dafilipinotradr, and @Johnsh2000 at Capital Compass Trading giving me their time, guidance, and expertise as I learn and continue to build my edge in the market. Thank you gentleman so much and if anyone is curious about what Capital Compass Trading has to offer, check out the link in my bio for more information and give these guys a follow! They post so much good material about the markets, it is an absolute goldmine of valuable information!
For Friday's session, I will be checking in on my playlist for the week: $CVS , $AMZN , $RDDT , $HIMS
I will also take note of things that I have noticed this week, as well as opportunities for me to grow into a better trader.
With the overall market showing weakness, $HIMS ended up moving down with the market as well. Reminding us all that you never fight the trend of the market, the trend is your friend. Despite a down day today, I will continue to watch this ticker and see how it develops.
With Health Services being a leading sector in the past 3 months, I have been watching $HIMS very closely. I really like how explosive this ticker can be when a catalyst really gets price moving. On the Quarterly time frame, price appears to be pivoting upwards. And as we look at the Monthly time frame, this trend is much more apparent, with price finally reclaiming the 8 and 21 Monthly EMAs. On the Weekly time frame, price has started to form a very nice flag, with all the Weekly EMAs gathering just below price. Looking at the Daily time frame, a rising wedge has been forming over the past couple of weeks. With the EMAs lining up neatly, as well as volume shrinking as price slowly moves higher on multiple time frames, I am watching to see if we get a breakout over the quarterly level at $39.05. A strong impulsive move with significant volume through this quarterly level could yield a price move up to $42 quickly. I will be observing $HIMS closely to see how price develops and I will alert if I take a position on this ticker.
$AMZN was able to move past my trigger level and past the daily 21 SMA early in the morning but did not move much further the rest of the day. This move. while good, reflected the overall market sentiment today, ranging without much direction up or down. It will take more observation and patience to find out which direction the market wants to move. And once a move up or down begins, it will be very interesting to see how the tickers I am tracking will respond. More ideas to come and I am hoping to take a good position soon.
$AMZN looks fascinating as of late. On the Quarterly and Monthly time frames, price is starting to form a bull flag as it moves upwards with all EMAs stacked perfectly below carrying price higher. On the Weekly and Daily time frames, you can see a wedge is beginning to form, with the tip of the wedge cozying up right against a major quarterly level at $251.03, which will serve as my trigger level. Within the wedge on the Daily time frame, you can see over the last 4 trading days a bull flag is forming as well. With volume drying up on all time frames and EMAs tightly coiled below price on the Daily time frame, I am waiting for a large volume influx to push price through my trigger level with a possible push up to another quarterly level at around $259. Keep an eye on this one, I surely will, and I will alert if I take a position on this ticker.
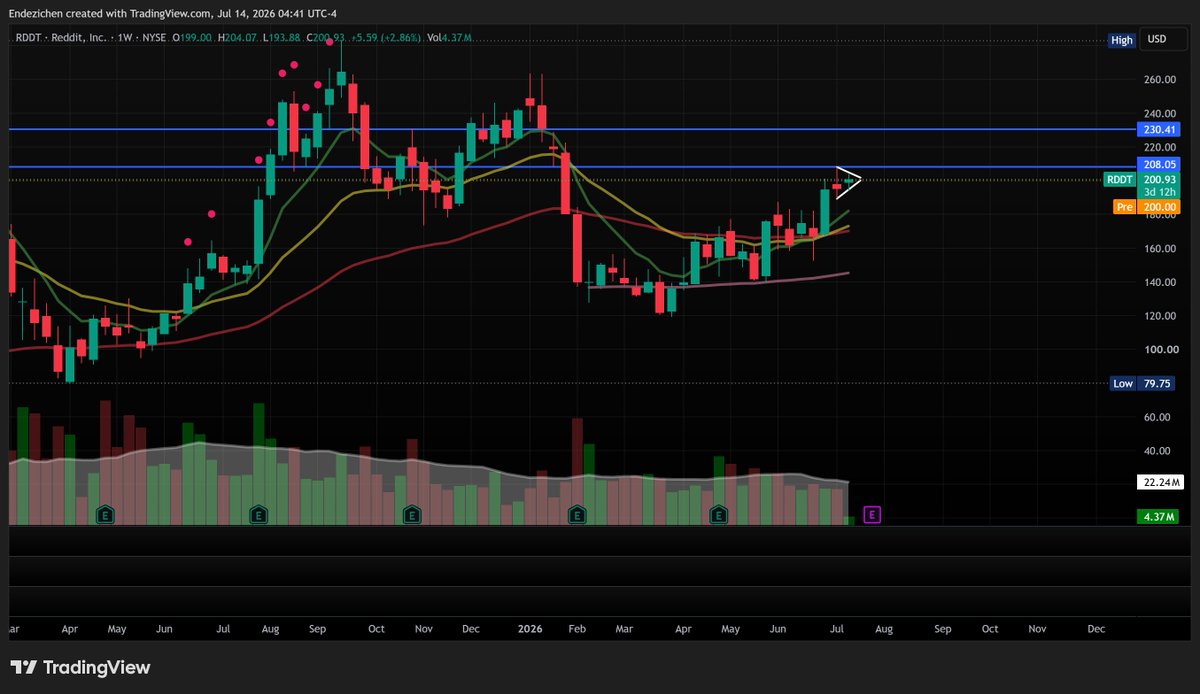
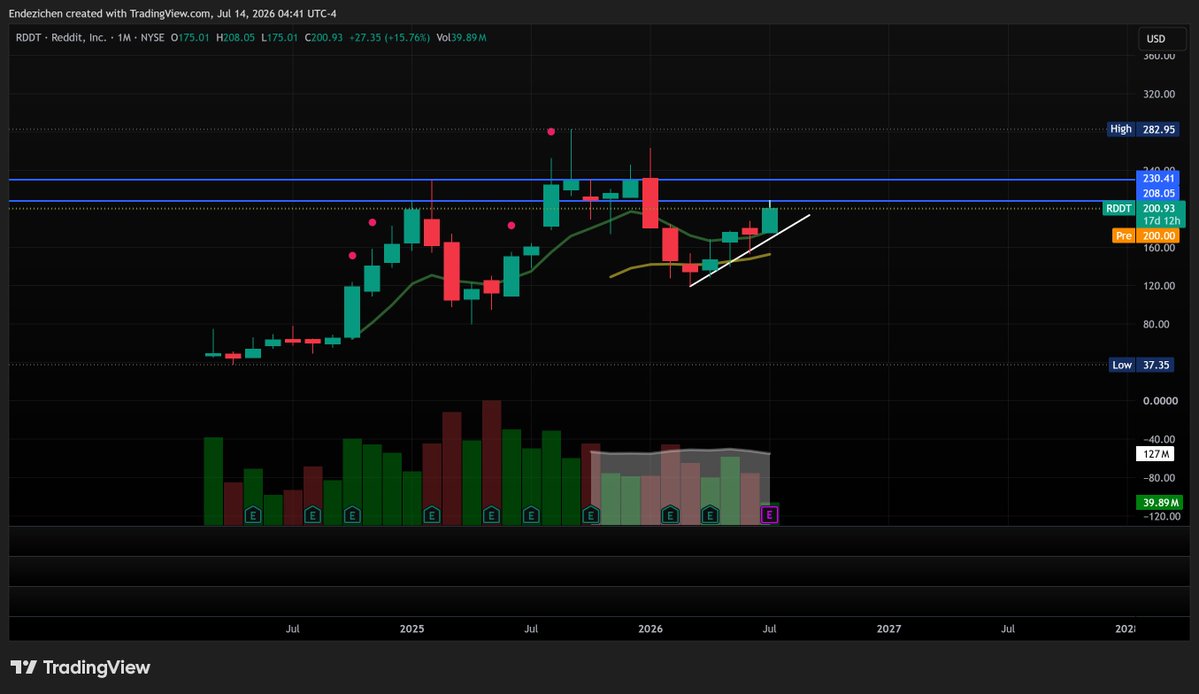
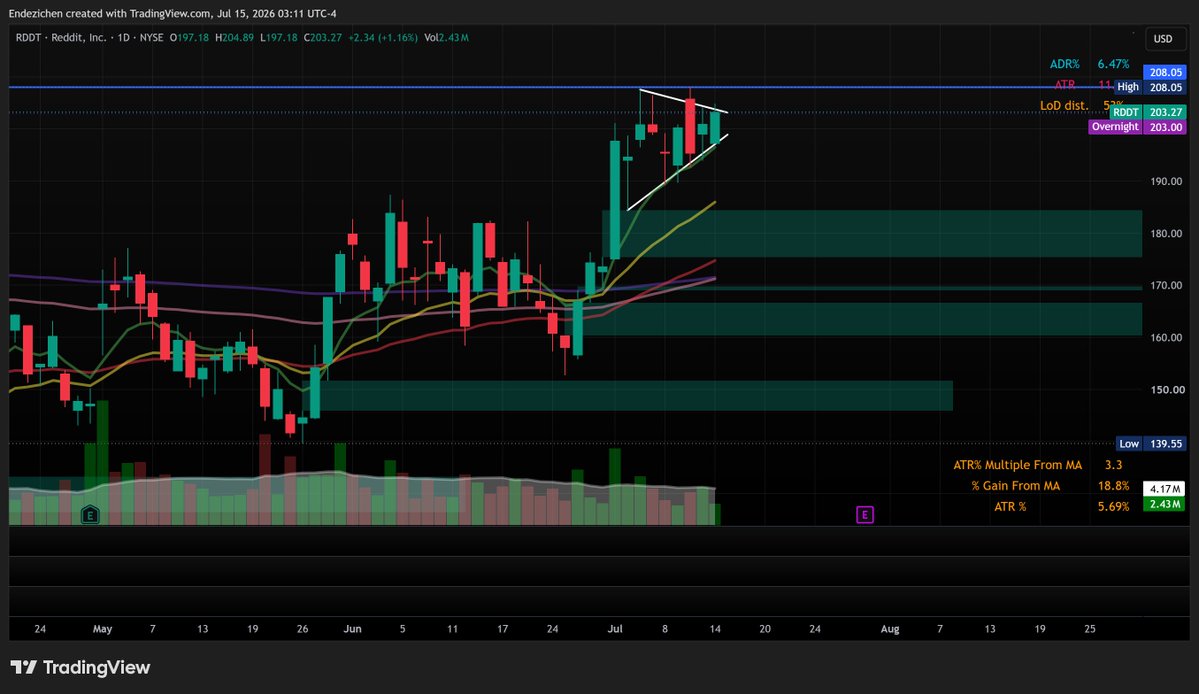
$RDDT had a good low volume day of continued consolidation. Trigger level was not tripped today, but my thesis for this ticker is still intact, the bull flag continues to fly proudly. I will keep this on my watchlist to see how $RDDT develops over the coming weeks.
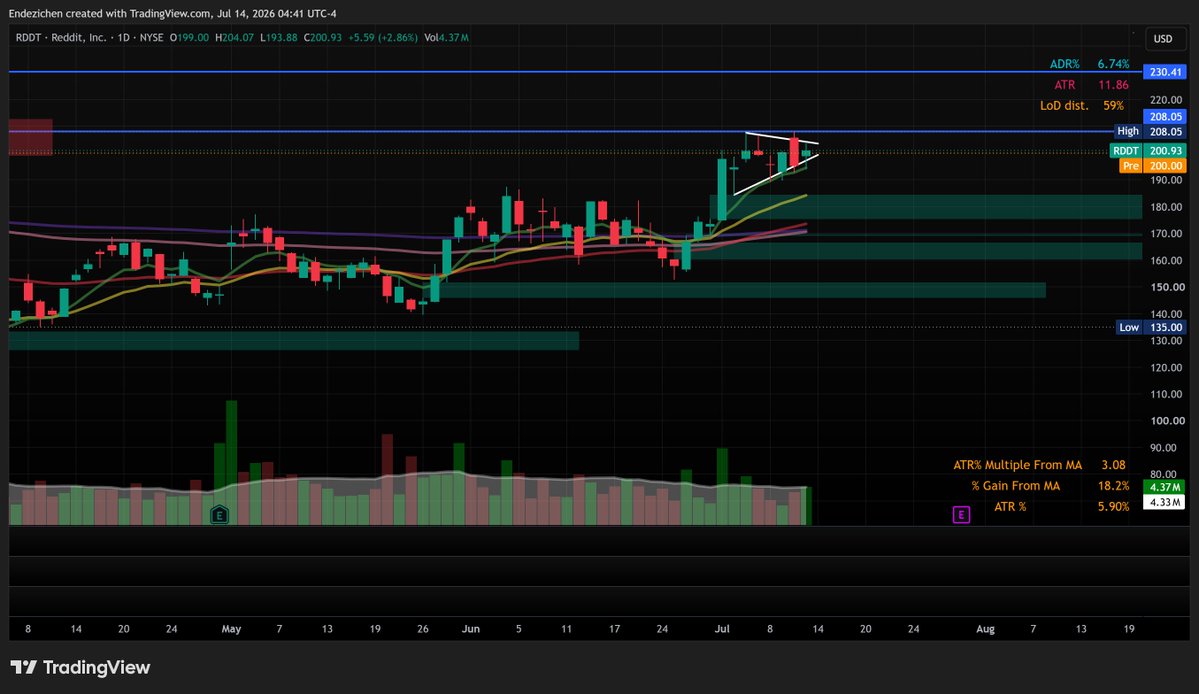
Another ticker that is looking very interesting to me this week is $RDDT.
On the Quarterly and Monthly time frames, price is trending up, and on the Weekly and Daily time frames, a clear bear flag can be seen. On all mentioned time frames, price is holding above 8, 21, 50, 100, and 200 EMAs well and volume is shrinking nicely, which makes me believe that a big move up is brewing. I will be watching a big quarterly level at $208.05 for an entry for a breakout swing trade if the market and volume align properly. If we get a huge volume move through this trigger level, we could see a move up to $222.
Capital has not been moving too much into the Technology Services sector as of late and with big economic events coming up as well as a choppy market overall, I will be cautious if I do take an entry and alert here if I do take a position.
https://t.co/FQTTzuHvFv
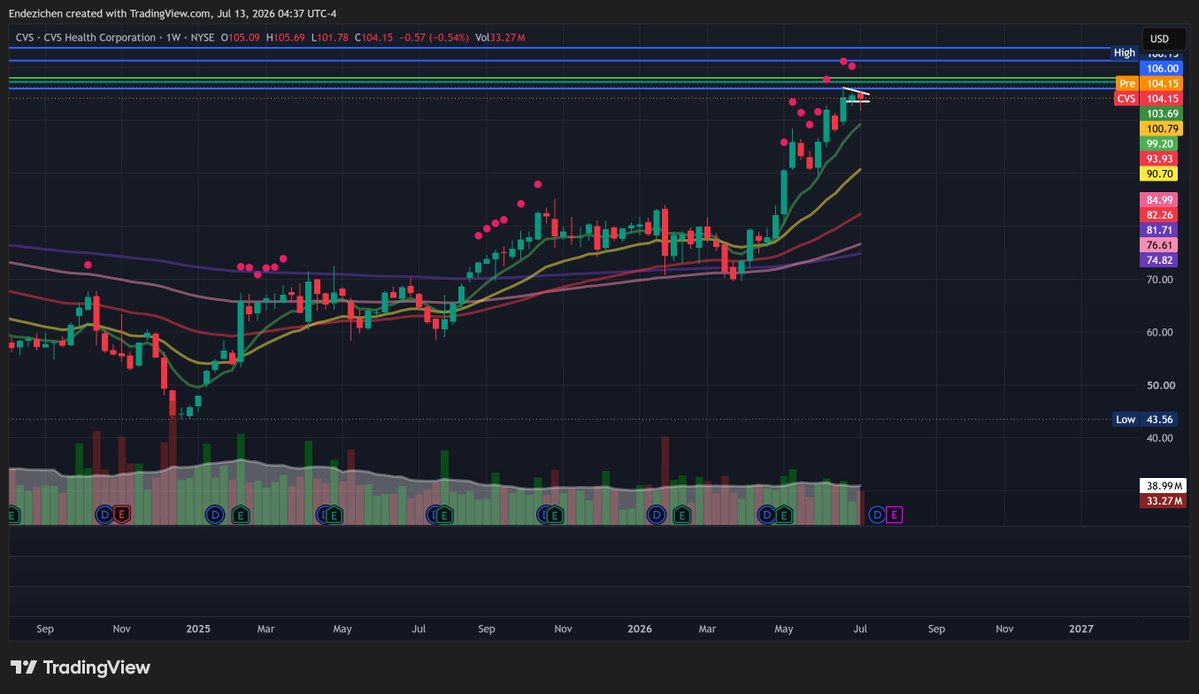
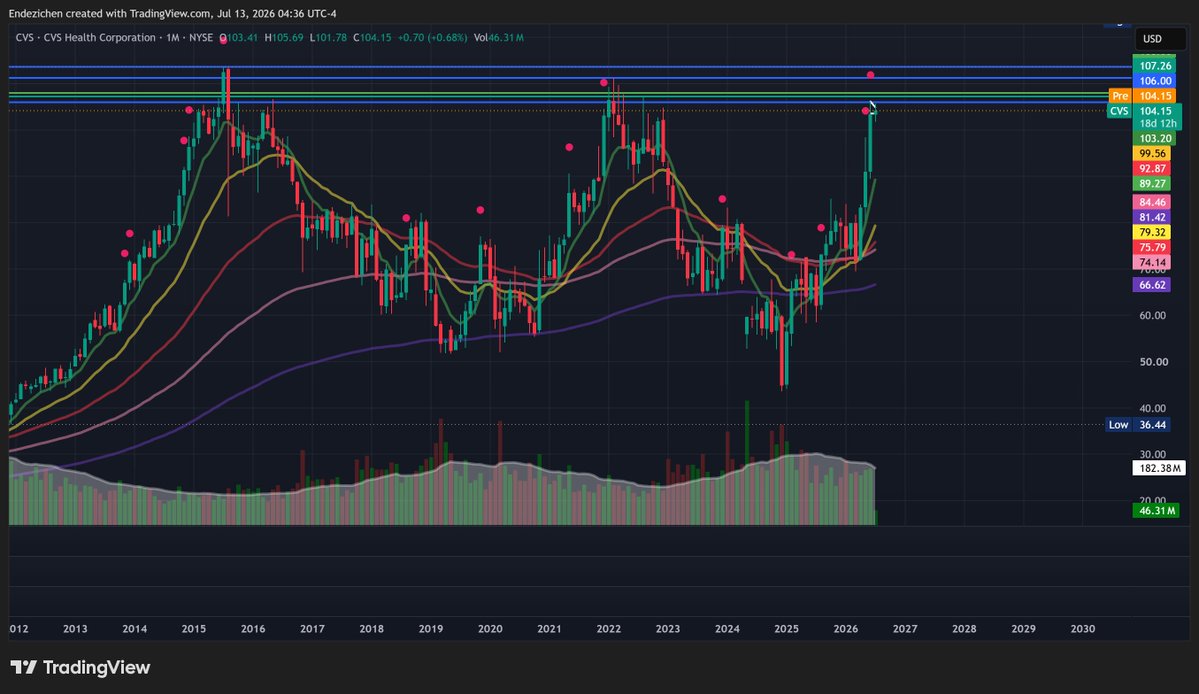
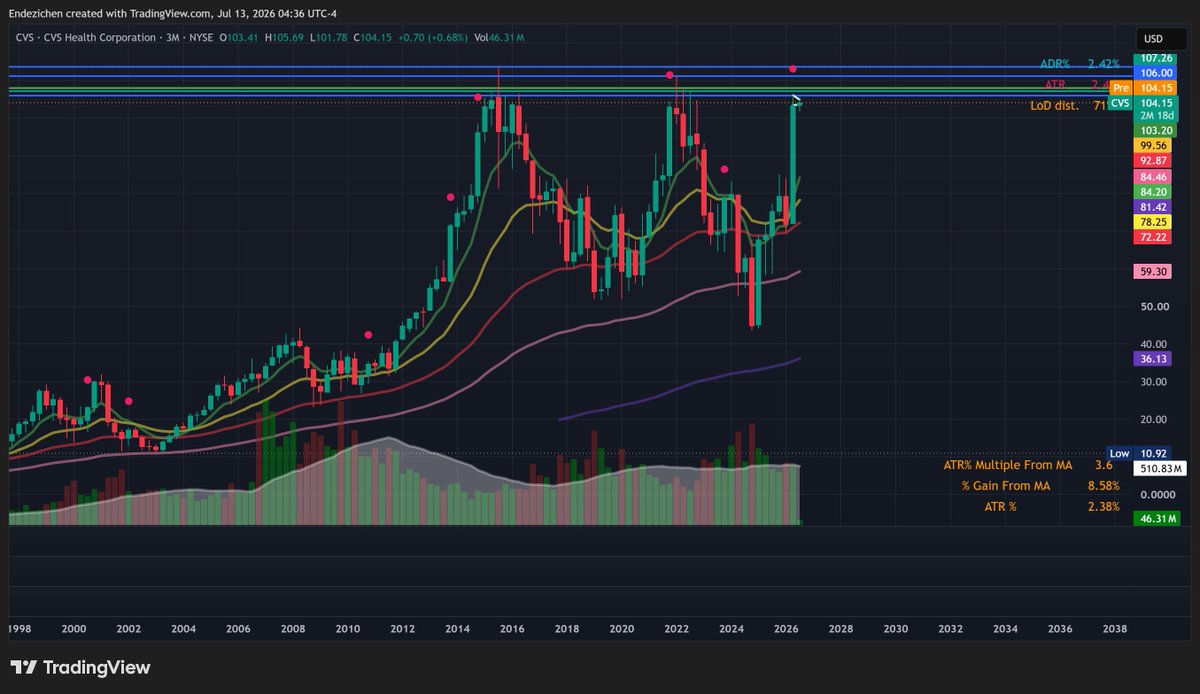
Early in the morning on Monday, $CVS hit my trigger level at $106 and respected the fair value gaps made on the 5 minute timeframe, but I did not take a position. This is because the move up lacked the volume ignition needed to push price higher and $CVS ended up languishing at my trigger zone, reflecting the overall market sentiment for Monday. I will keep an eye on this ticker and I will watch how it develops over the coming days and weeks. With significant economic data coming out this week (CPI, PPI, Jobless Claims, etc.), and a ranging market overall, I will be very cautious with my entries. More ideas to come and thanks for following me along on my journey.
Starting today, I am going to be using X as my journal for my trading ideas, entries, and exits. I will do my best to update my ideas often so that I can track what worked, what didn't work, and how I can improve. I have been working closely with my incredible mentors, @_Selinoo and @dafilipinotradr, and if you want to follow me on my journey or if you want to learn for yourself how you can harness the power of the stock market for your financial gain, join us at Capital Compass Trading, link is in my Bio.
For this week, I will be closely tracking $CVS. It has just started to flag on multiple time frames (3M, 1M, 1W, Daily), price has the 8, 21, 50, 100, and 200 EMAs all nicely stacked below, volume patterns are contracting nicely, and the Drugstore Chains have seen some capital influx over the past 1-3 months. The stock is a little extended currently, but I am interested if price breaks through a major quarterly level at $106. If I see significant volume follow through with a breakout at this level, I will watch closely to see if we get a push to $108.
@Johnsh2000 I absolutely LOVE that we are embarking on this journey together @Johnsh2000 , and I really love your picks for your weekly watchlist, LETS GET IT BRO! 🤜🤛🤝🙌😎📈
Starting today, I am going to be using X as my journal for my trading ideas, entries, and exits. I will do my best to update my ideas often so that I can track what worked, what didn't work, and how I can improve. I have been working closely with my incredible mentors, @_Selinoo and @dafilipinotradr, and if you want to follow me on my journey or if you want to learn for yourself how you can harness the power of the stock market for your financial gain, join us at Capital Compass Trading, link is in my Bio.
For this week, I will be closely tracking $CVS. It has just started to flag on multiple time frames (3M, 1M, 1W, Daily), price has the 8, 21, 50, 100, and 200 EMAs all nicely stacked below, volume patterns are contracting nicely, and the Drugstore Chains have seen some capital influx over the past 1-3 months. The stock is a little extended currently, but I am interested if price breaks through a major quarterly level at $106. If I see significant volume follow through with a breakout at this level, I will watch closely to see if we get a push to $108.
Here I go over:
-Market sentiment
-Possible winners of the Samsung Investments
-10/300 setups
-Must watch names to keep on radar for this week.
$SPY $QQQ $MU $SNDK $CLPT $QURE
$SEZL $ASML $LLY $MXL $MRVL $MSFT
🧵 2025 Trading Recap + 2026 Blueprint
Over a 500% return YTD with over 111K in realized profits.
2025 was a breakthrough year for me. 2024 is when I built a real process, and this was the year I started to scale it.
Below is a transparent breakdown of 2025 & exactly what I’m doing to start 2026:👇