@putyourchart Black-Scholes is a solid reference but it's static, so no matter what the market context, you apply the same formula. I use Markov (when allowed to) to better understand conditional probabilities.
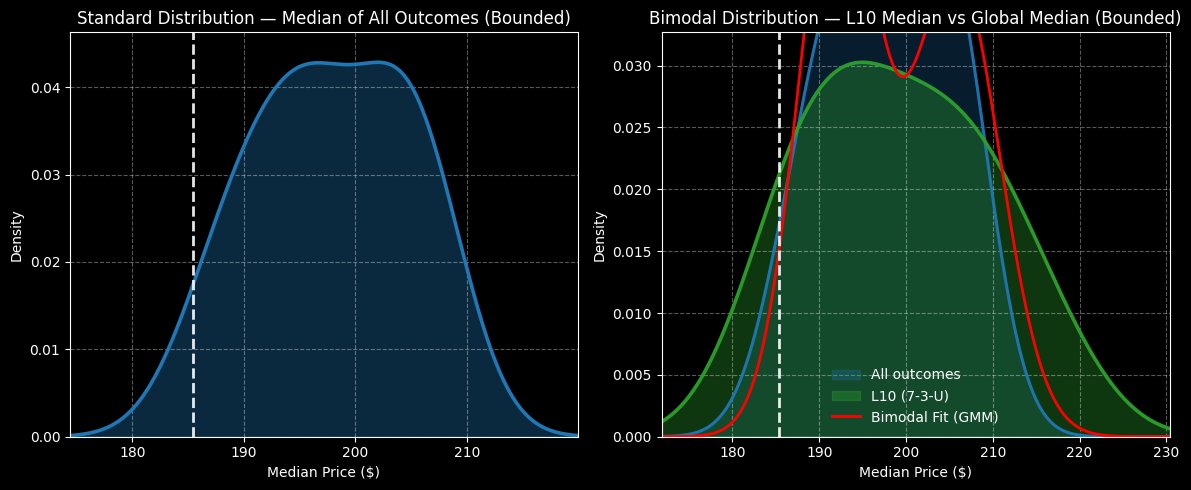
@putyourchart The expected move calculator helps reveal differences b/ween traditional models vs. Markov frameworks. For the April 17 exp. date, EM calculates a range of about $158 to $213 for $NVDA . With the Markov model, NVDA's probability density peaks around $193 under 7-3-U conditions.
@putyourchart What I have done differently from standard Markov analyses is to frame the last 10 weeks as the 'current' state. This gives me a stable structure where I can analyze the same sequence via past analogs to help determine forward probabilities.
@putyourchart Sure thing! The Markov property is technically memoryless because you don't need the entire history of a dataset to determine forward probabilities. However, the current state has already embedded a compressed encoding of the past.
I just read an analysis on Micron $MU that suggested buying the 270/240 bear put spread expiring Feb. 20. But over that timeframe, the expected downturn would typically land around $275 as a 'best'-case scenario. There's a massive statistical hurdle to trigger the $240 strike.
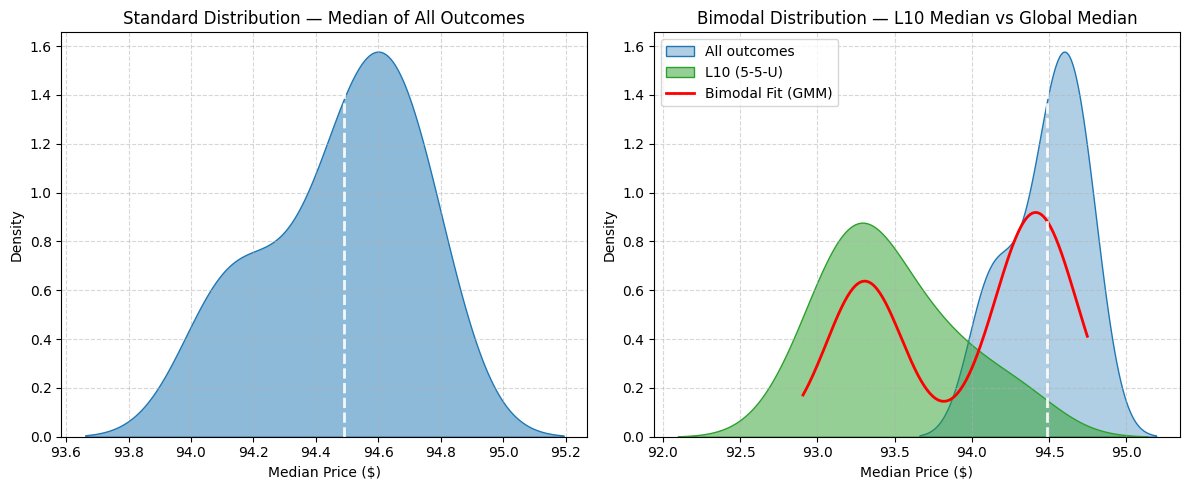
I'm keeping closet tabs on Taiwan Semiconductor (TSM). The way $TSM stock is behaviorally structured, the tendency is for a double-digit percentage move, which could place the security around $340 over the next 2 months. https://t.co/CeT1NKs0Pe
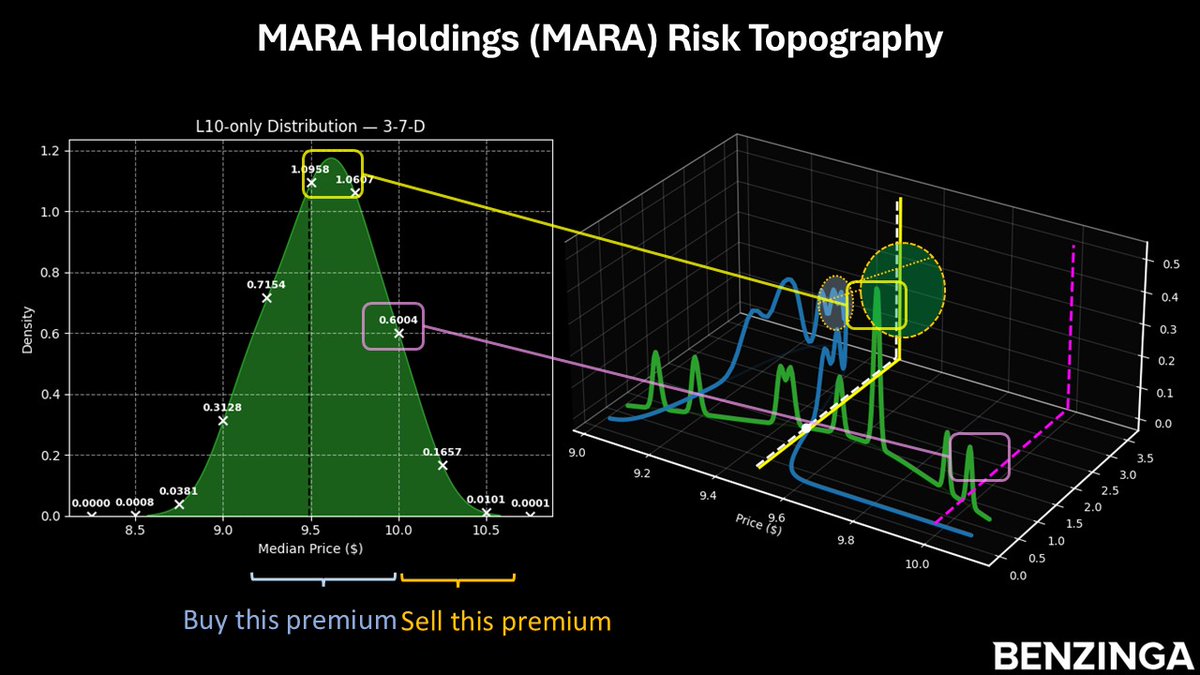
#MARA fell ~60% since mid-October. 😬
That by itself doesn’t create an edge. 🤔
The shape of how price moves afterward does. 🤑
Learn how three-dimensional analysis can properly shape the discussion 👉 https://t.co/da9Wlqk6Q7
One of the concerns with fundamental and technical analysis is that they assume universal cause-and-effect signals, such as 'low PE = good' or 'H&S pattern = bad'. That hasn't been proven. For example, I'm not jumping on $PLTR (yet) because the data doesn't justify bullishness.
@MichaelEd123 Probably because it went up so quickly beyond even normal bullish expectations, $MRK would quantitatively be considered a not-right-now situation. That's just what the data says.
If you're looking for a major tech deal, $ADBE should be on your radar. Its quant signal points to a contrarian reversal, in part thanks to a 3.22% positive delta in expected price density dynamics. Read the analysis here 👉 https://t.co/iES26xeVTD
@MichaelEd123 At this very moment, $ADBE is structured in a 4-6-D formation and if we were to consider data going back to Jan. 2009, you're looking at extreme price clustering at $335. With a positive earnings showcase, I still like the original $350 target exp. Dec. 19.
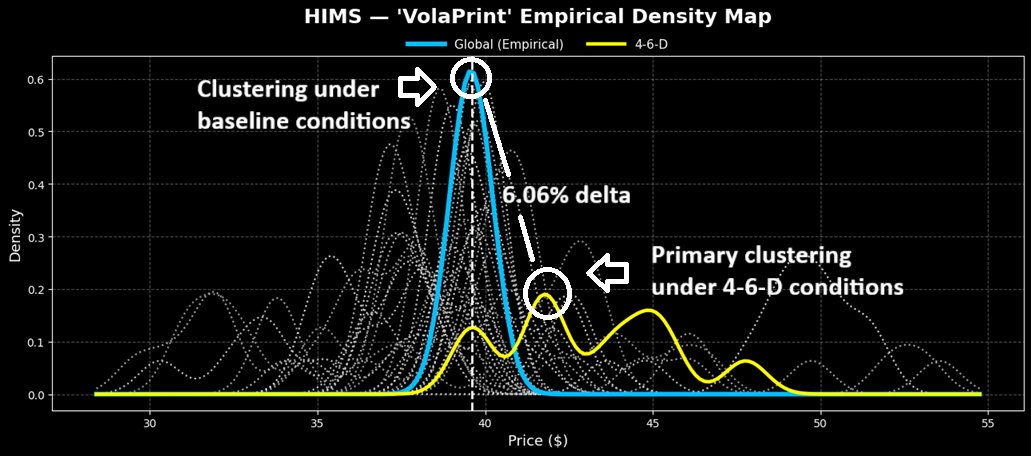
Some of you may have received a ticker recommendation for $HIMS in your inbox. Usually, I delete these spam-ish emails but I checked the quant picture and surprisingly, there's a 6.06% delta between expected and contextually 'realistic' outcomes over the next 10 weeks.
@MichaelEd123 Also, I'm constantly refining the model to get the accuracy to the highest rate possible. Of course, you can never get 100% and probably the theoretical/practical limit is 70%.
Still, this work should help rationalize the expected risk/reward profile 👍
@MichaelEd123 3) The difficulty of the quant approach is that the signal may not always stay consistent for very long and unusual fluctuations could change the sequence/structure completely.
That said, I'm trying to give you all the best quality signals I can find within market constraints.
@MichaelEd123 Thanks so much, I really appreciate it! A couple of things:
1) I use Tiingo's API for the data and sometimes the open/close data is slightly different in edge cases.
2) In other cases, there's a lag between when I propose the idea vs. when the story gets published.
Please take this with a grain of salt as I'm long this penny stock but $GPUS under its current quant profile features a 14.28% positive delta in forward 10-week price clustering dynamics relative to baseline.
Opendoor $OPEN is struggling right now but here's an overlooked datapoint that may spell opportunity for intrepid contrarians #stocks#options#trading https://t.co/0ODoqfz6qR